Page 10 of 14 FirstFirst ... 8 9 10 11 12 ... LastLast
Results 91 to 100 of 140
Like Tree1Likes

AUD Technical Analysis

This is a discussion on AUD Technical Analysis within the Forex Trading forums, part of the Trading Forum category; For those intraday traders, we can pinpoint the pattern a little further. A shorter term key level to watch for ...


  1. #91
    member TechnoMeter's Avatar
    Join Date
    Apr 2013
    Posts
    1,636
    Blog Entries
    426

    AUD/USD Aims for 77 Cents

    AUD Technical Analysis-audusd-h4-metaquotes-software-corp.png


    For those intraday traders, we can pinpoint the pattern a little further. A shorter term key level to watch for is the June 13 low of .7524. Holding above this low keeps new highs towards .7640 vulnerable. A break below this level puts bulls on ice while support may form above .7329.

    more...
    Trading blogs || My blog

  2. #92
    member TechnoMeter's Avatar
    Join Date
    Apr 2013
    Posts
    1,636
    Blog Entries
    426

    AUDUSD Options Point to Confinement Between Key Price Levels

    AUDUSD options-derived one-week range low & high in confluence with important price levels
    After ratcheting higher for most of July, AUDUSD cooled its jets and is finding difficulty in breaking above a resistance zone penciled in from around 8060 up to 8160. This zone extends back as far as a key low formed in 2010. The reversal-bar off the bottom of resistance is proving to have been a solid sign of exhaustion so far and could mean even if aussie is to continue trading higher it may take some time before being able to do so. Yesterday we saw another rejection to trade higher following the RBA meeting (the central bank held on rates at 1.5% as expected). The one-week one-standard deviation projected high is at 8062, in almost exact alignment with the exhaustion-day high of 8065. This furthers the notion of seeing price trade below that threshold over the next week.

    AUD Technical Analysis-audusd-d1-gci-financial.png


    Looking lower, should we see the recent reversal gain traction lower there lies support around 7874 down to the April 2016 breakout level at 7835. Almost right in the middle of this zone falls the projected one-week low at 7856, and may indicate that support will indeed hold if sellers show up.
    Overall, AUDUSD is set up to find difficulty gaing traction in either direction, suggesting one-week implied volatility priced at 9.3% could prove to be just about right.

    more...
    Trading blogs || My blog

  3. #93
    member TechnoMeter's Avatar
    Join Date
    Apr 2013
    Posts
    1,636
    Blog Entries
    426

    AUD/USD Technical Analysis: Aussie Gains Most in 5 Months

    The Australian Dollar shot sharply higher, posting the largest gain in five months against its US counterpart following the release of minutes from July’s FOMC meeting. Overall positioning hints that the rising trend established from May/June lows may be starting to resume.

    AUD Technical Analysis-audusd-w1-gci-financial.png


    From here, a daily close above the 23.6% Fibonacci expansion at 0.7979 opens the door for a test of the 0.8066-87 area (July 27 high, 38.2% level). Alternatively, a reversal back below the 14.6% Fib at 0.7913 clears the way for another challenge of the 0.7784-0.7821 area (38.2% Fib retracement, trend line).

    more...
    Trading blogs || My blog

  4. #94
    member TechnoMeter's Avatar
    Join Date
    Apr 2013
    Posts
    1,636
    Blog Entries
    426

    AUD/USD Technical Analysis: Struggling to Build on Upside Break

    The Australian Dollar has struggled to build upside momentum against its US counterpart since bouncing from rising trend support set from May/June lows. Prices seemingly completed a bullish Flag continuation pattern but have been unable even to retest the prior swing high, much less to overcome it.

    AUD Technical Analysis-audusd-d1-alpari-international-limited2.png


    Resistance is at 0.7979, the 23.6% Fibonacci expansion, with break above that on a daily closing basis opening the door to challenge the 0.8066-87 area (July 27 high, 38.2% level). Alternatively, a turn below trend line support, now at 0.7859, exposes the 0.7784-0.7805 zone (38.2% Fib retracement, August 15 low) anew.

    more...
    Trading blogs || My blog

  5. #95
    Administrator newdigital's Avatar
    Join Date
    Feb 2013
    Posts
    10,477
    Blog Entries
    2957
    Follow newdigital On Twitter Add newdigital on Facebook Add newdigital on Google+ Add newdigital on MySpace
    Add newdigital on Linkedin
    Breakout Systems (indicators and the EA) from premium section -

    AUD Technical Analysis-jpy12.png
    Premium Trading Forum: subscription, public discussion and latest news
    Trading Forum wiki || MQL5 channel for the forum
    Trading blogs || My blog

  6. #96
    member TechnoMeter's Avatar
    Join Date
    Apr 2013
    Posts
    1,636
    Blog Entries
    426

    AUDUSD Options Pricing in Muted Price Movement Week of RBA Meeting

    AUDUSD one-week implied volatility at 7.85% ahead of RBA, projects a weekly range of 7729-7899, with support at range-low

    One-week implied volatility is at a relatively subdued level of 7.85%, suggesting we will see limited price movement over the course of the next few days. There is of course room for a surprise with tomorrow’s events but the market isn’t anticipating anything which will shake things up too much. Of interest, is the confluence between the projected one-week range-low of 7729 and solid support in the same area as far back as August 2016. With there being good confluence between projected price movement and support it appears likely we will see a hold of support should AUDUSD trade down to that point, at least on any initial test.

    AUD Technical Analysis-audusd-h4-metaquotes-software-corp.png


    Looking higher, there isn’t any particular alignment between resistance and price levels. Giving the path of least resistance in the near-term (lower) it may be difficult for aussie to exceed the projected range-high of 7899 with conviction.

    more...
    Trading blogs || My blog

  7. #97
    member TechnoMeter's Avatar
    Join Date
    Apr 2013
    Posts
    1,636
    Blog Entries
    426

    Australian Dollar Set to Fall on Bearish Bias

    AUDUSD: Retail trader data shows 53.7% of traders are net-long with the ratio of traders long to short at 1.16 to 1. The number of traders net-long is 4.7% lower than yesterday and 4.7% lower from last week, while the number of traders net-short is 12.0% lower than yesterday and 13.0% lower from last week.

    AUD Technical Analysis-audusd-h4-metaquotes-software-corp.png


    We typically take a contrarian view to crowd sentiment, and the fact traders are net-long suggests AUDUSD prices may continue to fall. Traders are further net-long than yesterday and last week, and the combination of current sentiment and recent changes gives us a stronger AUDUSD-bearish contrarian trading bias.

    more...
    Trading blogs || My blog

  8. #98
    member TechnoMeter's Avatar
    Join Date
    Apr 2013
    Posts
    1,636
    Blog Entries
    426

    AUD/USD Technical Analysis: All Eyes on Trend-Defining Support Line

    The Australian Dollar is perched at trend-defining support, with the currency yet to decide on near-term direction against its US counterpart. A series of descending highs and lows argues for a bearish near-term bias but the longer-term view warns that recent losses might have been corrective within a larger advance.

    AUD Technical Analysis-audusd-d1-alpari-international-limited.png


    Support is in the 0.7611-25 area (October 27 low, 23.6% Fibonacci expansion), with a daily close below that exposing the 38.2% level at 0.7538 and arguing for a structural tone shift in favor of the downside. Alternatively, a breach of the 23.6% Fib retracement at 0.7743 targets the 38.2% mark at 0.7816.

    more...
    Trading blogs || My blog

  9. #99
    member TechnoMeter's Avatar
    Join Date
    Apr 2013
    Posts
    1,636
    Blog Entries
    426

    AUD/USD Technical Analysis: daily bearish ranging for direction

    The Australian Dollar seems to be struggling to pick a direction to choose from against its US counterpart as of late. In the meantime, well-established support and resistance levels have formed and the gap between the two is slowly shrinking. These are the 76.4% Fibonacci retracement at 0.7651 and the descending line from March 16th respectively.

    AUD Technical Analysis-audusd-d1-metaquotes-software-corp-2.png


    Before AUD/USD got to where it is now, the pair has essentially been in a downtrend since February. Since then, a falling wedge bullish pattern has formed. However, for confirmation, the pair will have to ascend to and break above the upper line of the formation. Positive RSI divergence shows that momentum to the downside is ebbing and it hints that prices may soon turn higher.

    Beyond the aforementioned level, the next resistance target is the 61.8% retracement at 0.7743. A push above that exposes the upper line of the falling wedge. Should AUD/USD break through, it may soon find itself struggling to get past the 50% midpoint of the retracement.

    more...
    Trading blogs || My blog

  10. #100
    member TechnoMeter's Avatar
    Join Date
    Apr 2013
    Posts
    1,636
    Blog Entries
    426

    Canadian Dollar Rate Forecast

    A strong Candian Dollar is emerging on the back of elevated crude oil prices and a weakening US Dollar on a soft CPI print for April. Now, the focus will turn to the US/CA 2Yr yield differentials to see if the CAD can make up even more ground. The key risk to further CAD strength appears to be overconfidence on a successful outcome to NAFTA talks and potentially rich pricing in of a May rate hike.

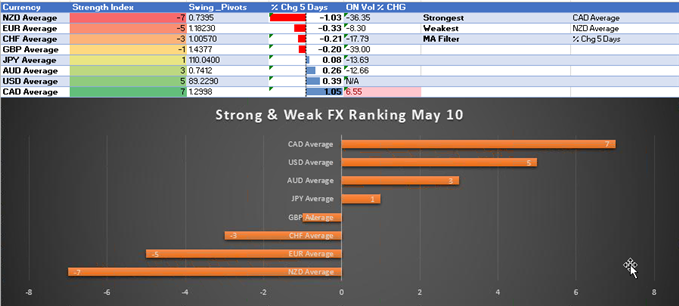
    May 10 Strong/Weak G8 FX Dashboard


    The strong/weak table above that I also share on FX closing bell helps to visualize where there is broad strength in the FX market. Currently, the strongest currency is the Canadian dollar based on an equally weighted 5-day % change with the US Dollar as a close second. The weakest currency after the RBNZ and their new Governor Orr provided a message of patience is the New Zealand Dollar.

    Price had appeared wedged between clean support at C$1.2803 and resistance at C$1.29 per USD. However, a swift move higher to C$1.2999 that was reversed provides swing traders with a strong resistance point to build a CAD long bias from. However, the US Dollar remains strong, so if CAD strength persists, GBP/CAD or EUR/CAD may be better plays.

    We typically take a contrarian view to crowd sentiment, and the fact traders are net-short suggests USDCAD prices may continue to rise. Yet traders are less net-short than yesterday and compared with last week. Recent changes in sentiment warn that the current USDCAD price trend may soon reverse lower despite the fact traders remain net-short (emphasis mine.)

    more...
    Trading blogs || My blog

Page 10 of 14 FirstFirst ... 8 9 10 11 12 ... LastLast

Tags for this Thread

Bookmarks

Posting Permissions

  • You may not post new threads
  • You may not post replies
  • You may not post attachments
  • You may not edit your posts
  •