Page 1 of 17 1 2 3 11 ... LastLast
Results 1 to 10 of 169

GBP Technical Analysis

This is a discussion on GBP Technical Analysis within the Forex Trading forums, part of the Trading Forum category; GBP/CHF Triangle Pattern with an Elliott Wave Twist Talking Points: Daily Triangle Consolidation in GBP/CHF Clear Elliott Wave Pattern Also ...


  1. #1
    member TechnoMeter's Avatar
    Join Date
    Apr 2013
    Posts
    1,636
    Blog Entries
    421

    GBP Technical Analysis

    GBP/CHF Triangle Pattern with an Elliott Wave Twist

    Talking Points:

    • Daily Triangle Consolidation in GBP/CHF
    • Clear Elliott Wave Pattern Also in Progress
    • The Ideal Time Frame for Selling GBP/CHF


    As many currency pairs move into more confusing territory amid deeper pullbacks on their respective daily charts, the market environment is becoming one where probability favors the downside in many cases.
    There are several valid responses to these conditions, one of which is to reduce risk on each trade. This will be particularly attractive to those who have been on winning streaks and wish to preserve recent gains.
    Also, bear in mind that it’s best to not try to outsmart the market, so the best response is still to steadily take trades as the set-ups are being presented, and then manage each position as the market response develops.
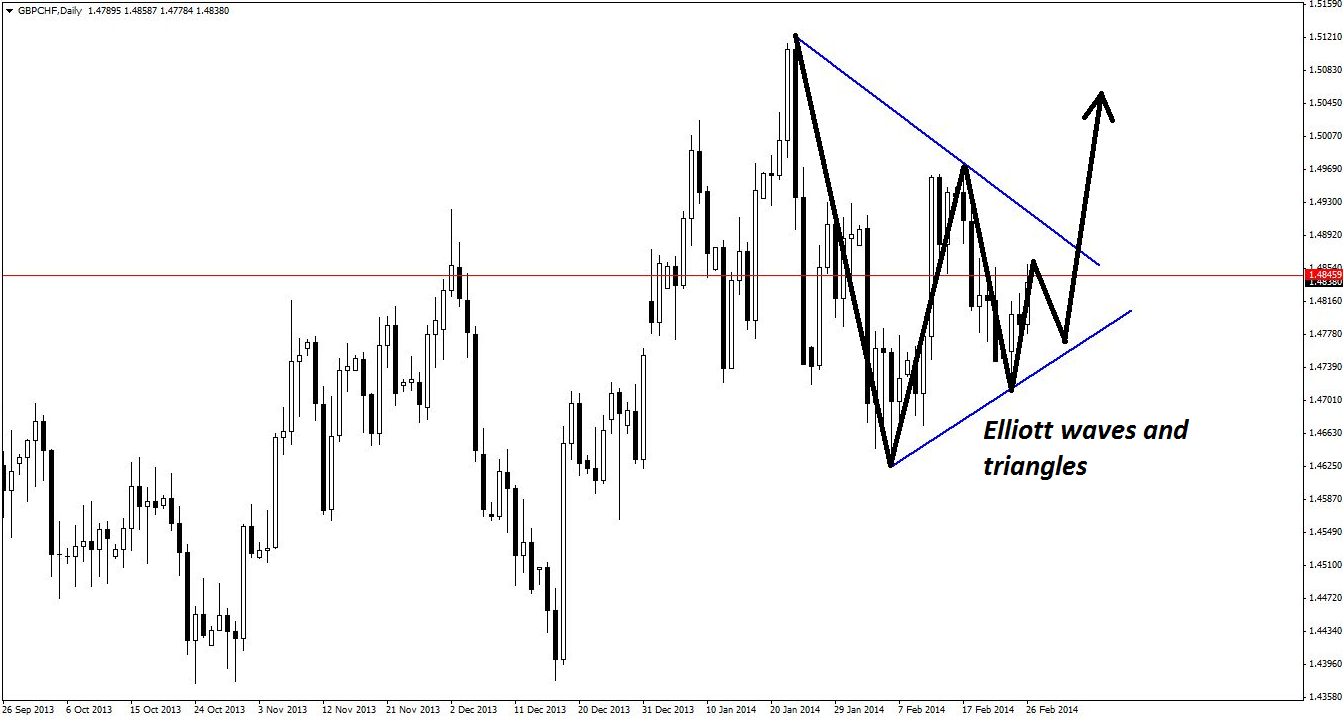
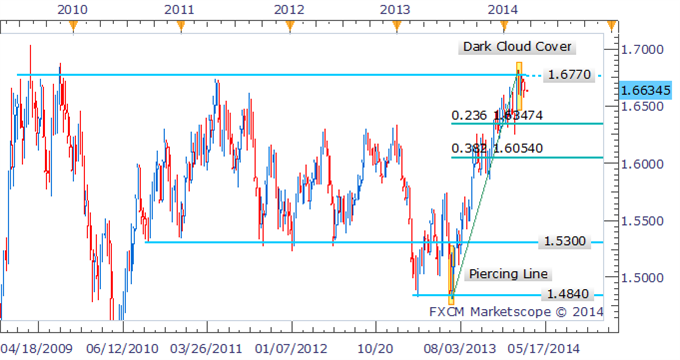
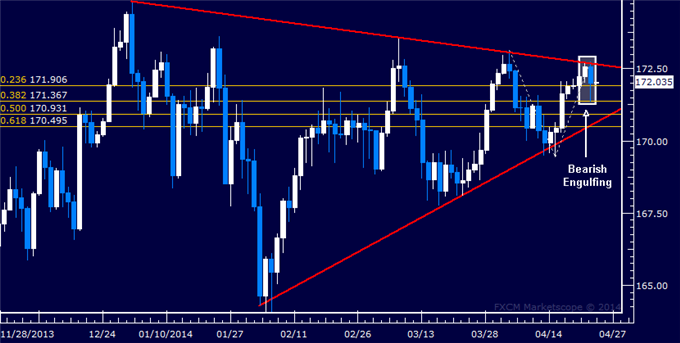
    The daily chart below of GBPCHF reflects a longer-term uptrend, but also a triangle-type consolidation pattern. Applying a Fibonacci expansion to recent price action reveals that there is a level of hidden resistance at 1.4845. Alone, this would be insufficient reason to take the trade, but Elliott wave theory provides another potential reason.

    Guest Commentary: Daily Triangle Consolidation in GBP/CHF


    According to Elliott wave theory, every triangle should consist of five main waves, each containing a three-legged move. Thus far, there have only been three of these waves, which suggests that the current upswing should soon turn around within the triangle.

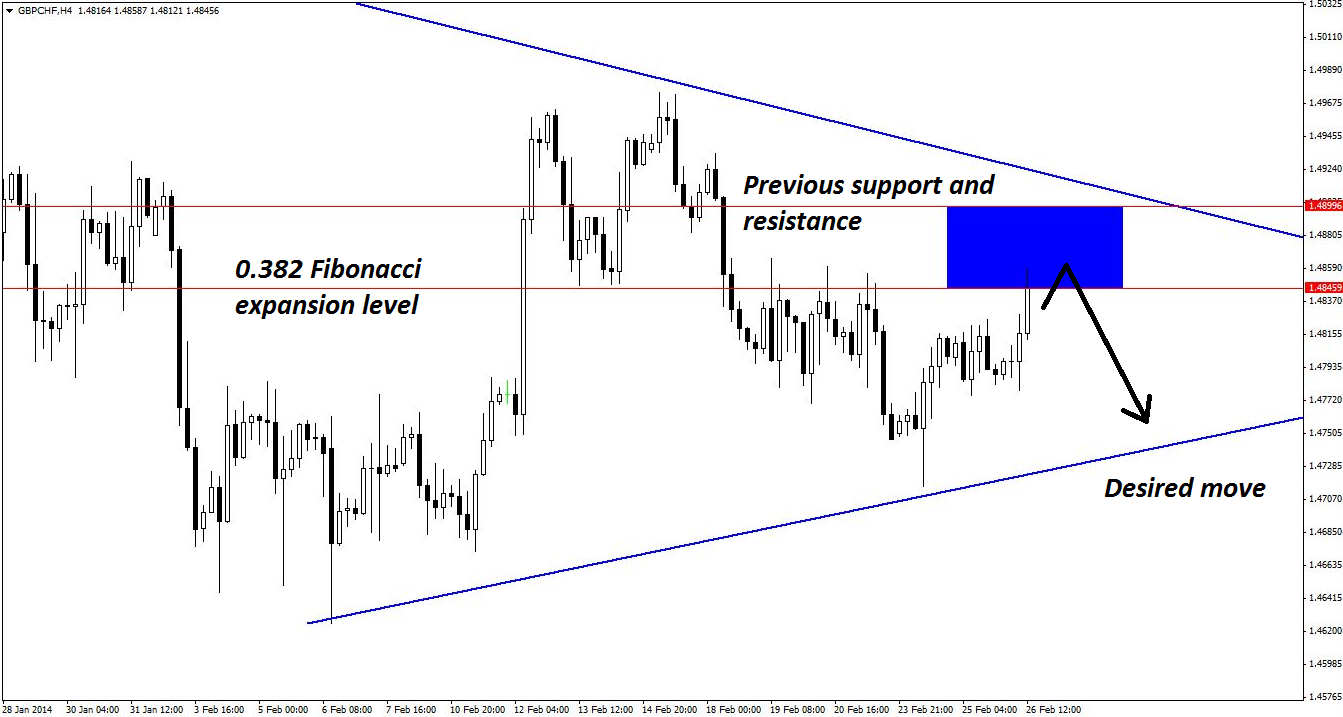
    On the daily chart below, the 38.2% Fibonacci expansion level has been retained for reference, and a rough plot of how it should develop according to classic Elliott wave theory has been supplied. Of course, in the real world, anything can happen, but the best response is simply to enter short at the overhead resistance level in anticipation that this pattern will develop and ultimately complete.

    Guest Commentary: Elliott-Inspired Set-up in GBP/CHF


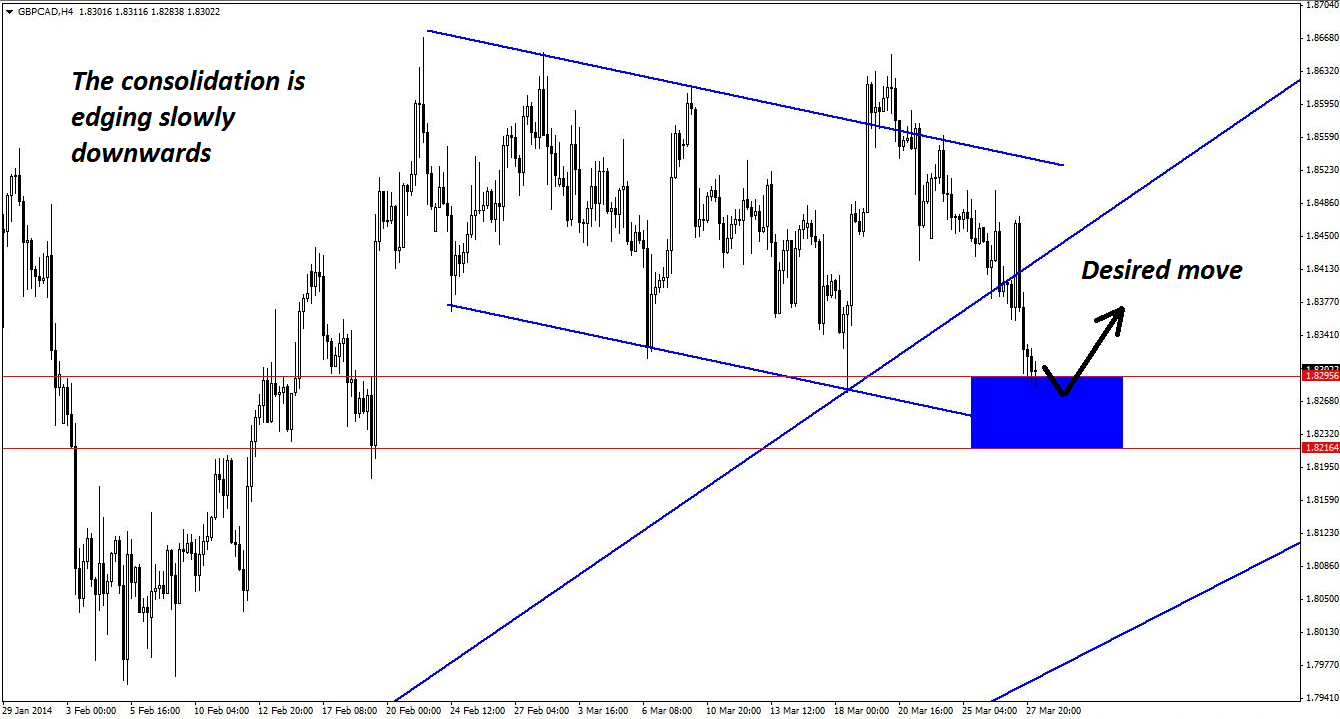
    The four-hour chart below readily provides a resistance zone using the 38.2% Fibonacci expansion level coupled with previous support and resistance for GBPCHF. This key zone where a reaction is likely to materialize is 1.4845-1.4899, or 54 pips deep. That level of risk is very much acceptable for any cross pair involving the British pound (GBP).

    Guest Commentary: Key Resistance Zone for Selling GBP/CHF


    A move to the bottom of the triangle formation would yield 100 pips or more, and although this trade is slightly less “juicy” than some others in terms of risk profile, when considering the consolidating nature of the markets and the need to be defensive in trade management, it is still quite appealing.

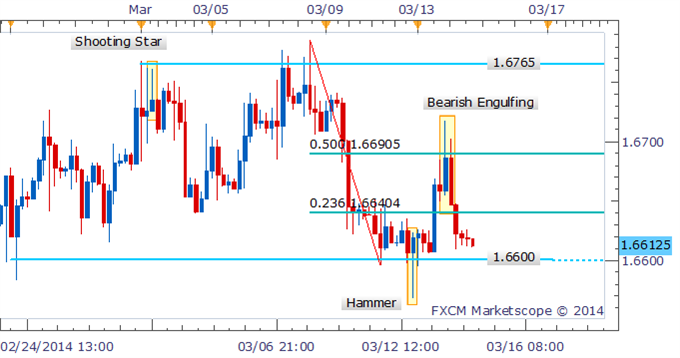
    Any potential trade entries should be found on the hourly chart (not shown), which will facilitate a reduction in risk. Acceptable triggers will include pin bars, bearish engulfing patterns, and bearish reversal divergence.
    Finally, and as always, two or three tries may be needed to trade this set-up, and indeed, multiple positions should be used in order to scale out should the trade begin to hesitate after the entry.

    By Kaye Lee, private fund trader and head trader consultant, StraightTalkTrading.com


    More...

  2. #2
    member TechnoMeter's Avatar
    Join Date
    Apr 2013
    Posts
    1,636
    Blog Entries
    421

    GBPAUD Technical Analysis

    A GBP/AUD Long That May Trigger Again

    Talking Points:

    • Daily Trend Line Break in GBP/AUD
    • Price Reacting Off Short-Term Support
    • Looking for a Second-Chance Entry Signal


    After some prolonged choppiness this week, it was certainly a welcomed sight to see the GBPCAD trade we profiled here yesterday move violently in our favor. However, traders will note that the bulk of the move was actually supported by the Canadian dollar (CAD), and not the British pound (GBP), which has instead continued somewhat sideways.
    Thus, today's GBPAUD trade, which also favors the long side, is intended to catch a move up in the pound while also benefiting from a potential weakening in the Australian dollar (AUD).

    Traders often wait impatiently for price to come towards a trend line, but when it is actually tested, they fear the entry, wondering whether the trend line will hold. In line with the dictum that it is better to trade “with the trend,” the assumption that it will hold at some point is usually better than the alternative.
    In the case of GBPAUD, it is best to treat the break of the trend line on the below daily chart as a false signal, or at least one that will generate a retest of the broken trend line.

    Guest Commentary: Daily Trend Line Break for GBP/AUD


    The four-hour chart below shows that price is already at support that has been generated from past horizontal price action. The desired move to the upside has in excess of 400 pips to reach the previous high. Meanwhile, the support zone is 1.8260-1.8373, or 113 pips deep. This clearly represents a favorable risk profile, making this long set-up in GBPAUD one worthy of consideration.

    Guest Commentary: Key Support Zone for Buying GBP/AUD


    The hourly chart, however, reveals some complications with regard to this trade's entry.

    As shown below, bullish reversal divergence is already visible on the hourly chart, and price is beginning to turn up. Although the more intrepid traders may be tempted to hop on, this market environment is still far from safe, and as a result, the preferred entry trigger would be for price to make a lower low and flash another divergence signal. It is also possible to enter on a pin bar or bullish engulfing pattern once that lower low is made.

    Guest Commentary: Awaiting Another GBP/AUD Entry Signal


    If price runs up without providing one more swipe for entry, then it is likely better to miss this trade than to try and hop onto it too early (or perhaps too late). If it does come back down, then two or three tries at the entry would be appropriate given the attractive nature of this set-up.

    By Kaye Lee, private fund trader and head trader consultant, StraightTalkTrading.com


    More...

  3. #3
    member TechnoMeter's Avatar
    Join Date
    Apr 2013
    Posts
    1,636
    Blog Entries
    421

    GBP Technical Analysis

    Forex Strategy - GBP/USD Range-Bottom At 1.6600 In Focus

    Talking Points

    • GBP/USD Technical Strategy: Sidelines Preferred
    • Range between 1.6600 and 1.6765/70 intact
    • Dark Cloud Cover on weekly warns of larger correction


    The range between 1.6600 and 1.6765/70 for the Pound remains in force. While a test of the range-top looked possible yesterday, sellers at the 50% Fib Retracement level at 1.6690 acted to cap the GBP/USD’s advance. This has resulted in a Bearish Engulfing candlestick pattern that is threatening a break of the range-bottom at 1.6600.

    GBP/USD Range Remains Intact


    A break below 1.6600 may open up the 50% Fib Retracement level on the daily at 1.6536.

    GBP/USD Signs of Indecision on Daily


    The ominous Dark Cloud Cover formation on the weekly at multi-year resistance also remains on the radar, and may be warning of a more significant correction ahead for the Pound.

    GBP/USD Weekly Warns of Declines


    By David de Ferranti, Market Analyst, FXCM

    More...

  4. #4
    member TechnoMeter's Avatar
    Join Date
    Apr 2013
    Posts
    1,636
    Blog Entries
    421

    Forex Strategy - GBP/USD Dojis Signal Struggle To Reclaim 1.6770

    Talking Points

    • GBP/USD Technical Strategy: Sidelines Preferred
    • Range between 1.6600 and 1.6765/70 intact
    • Dark Cloud Cover on weekly warns of larger correction


    This week will be critical for the Pound as the pair threatens a downside break of the recent trading range. Several successive short sessions suggests conviction may not be strong enough amongst the bulls to push prices back to the 1.6770 top. A break of the range-bottom at 1.6600 would open up the 50% Fib Retracement level at 1.6540.

    GBP/USD Signs of Indecision on Daily


    As noted in yesterday’s GBP/USD candlesticks report the 1.6650 mark remains a key intraday level of resistance and may continue to cap gains for the pair.

    GBP/USD Range Break Threatened


    The ominous Dark Cloud Cover formation on the weekly at multi-year resistance also remains on the radar, and is threatening a more significant correction ahead for the Pound. A potential target is offered by the 23.6% Fib Retracement Level near 1.6350.

    GBP/USD Weekly Offers Warning


    By David de Ferranti, Market Analyst, FXCM

    More...

  5. #5
    member TechnoMeter's Avatar
    Join Date
    Apr 2013
    Posts
    1,636
    Blog Entries
    421

    GBPJPY Technical Analysis

    Forex: GBP/JPY Technical Analys

    Talking Points:

    • GBP/JPY Technical Strategy: Flat
    • Support: 168.08-47 (50% Fib exp., trend line), 166.79 (61.8% Fib exp.)
    • Resistance: 169.37 (38.2% Fib exp.), 170.97 (23.6% Fib exp.)


    The British Pound is stalling at rising trend line support set from August 2013 (168.47) after falling as expected against the Japanese Yen. The downside barrier is bolstered by the 50% Fibonacci expansion at 168.08. A break below this boundary exposes the 61.8% level at 166.79. Alternatively, a turn above resistance at 169.37 – the 38.2% Fib – targets the 23.6% expansion at 170.97.

    Prices are too close to relevant near-term up- and downside technical barriers to make a trade at current levels attractive from a risk/reward perspective. We will continue to stand aside for now, waiting for a more attractive setup to present itself.


    --- Written by Ilya Spivak, Currency Strategist for DailyFX.com


    More...

  6. #6
    member TechnoMeter's Avatar
    Join Date
    Apr 2013
    Posts
    1,636
    Blog Entries
    421

    Forex: GBP/USD Technical Analysis

    Talking Points:

    • GBP/USD Technical Strategy: Flat
    • Support: 1.6469 (61.8% Fib ret., trend line), 1.6386 (76.4% Fib ret.)
    • Resistance: 1.6536 (50% Fib ret.), 1.6604 (38.2% Fib ret.)


    Risk/reward considerations argue against entering short with prices so close to support. On the other hand, taking up the long side looks premature absent a defined reversal signal. We will continue to stand aside until a more actionable setup emerges.


    --- Written by Ilya Spivak, Currency Strategist for DailyFX.com


    More...

  7. #7
    member TechnoMeter's Avatar
    Join Date
    Apr 2013
    Posts
    1,636
    Blog Entries
    421

    GBPCAD Technical Analysis

    A Long Set-up Rarely Seen in GBP/CAD

    Talking Points:

    • Potential False Break on GBP/CAD Daily Chart
    • Rare Parallel Channel Consolidation in Play Now
    • Added Validation for GBP/CAD Longs

    GBPCAD is currently demonstrating a rather unusual situation: a sideways range that is relatively even and textbook in nature. In spite of how often texts about technical analysis show this sort of perfectly ranging market, they are, in practice, quite rare.
    In fact, even this situation is not perfect, as will be demonstrated later on the four-hour chart. However, the set-up happens to be in the direction of the daily trend, and as a result, it certainly comes as a viable trading opportunity.

    As seen on the daily chart below, a rising trend line has been broken recently, and as with all countertrend breakouts, and especially one that has been intact for so long, it is wise to assume that it is false. And, if so, traders may be able to buy GBPCAD at an advantageous price level and capitalize on a resumption of the prevailing uptrend.

    False Break on GBP/CAD Daily Chart


    Even if price only went up to retest the underside of the previous trend line support, there would be more than 150 pips to be had in that move. Needless to say, if price continues higher and the uptrend resumes, the proposition becomes increasingly attractive.

    The sideways motion mentioned earlier can be seen to the right on the daily chart above, and one interpretation of that would be a sideways consolidation pattern. However, the four-hour chart below offers a more precise perspective.

    This level of magnification shows that the consolidation is actually edging slowly down in a mostly consistent parallel channel. Price is now near support, as estimated from the declining line of support, as well as the double-bottom territory with which GBPCAD is currently flirting. The final support zone has been marked out as 1.8216-1.8295.

    Parallel Consolidation in GBP/CAD


    It is perhaps notable that if this had truly been a sideways consolidation, price would now be in a zone of particular interest to many professional traders. A false breakout to the downside followed by a quick reversal would leave many breakout sellers caught, and if all went according to plan, the panicked liquidation of short positions at that juncture could lead to a swift rise in GBBCAD.

    Of course, the market does what the market wants, but this trade has that type of reversal potential nonetheless.

    There is also a parallel channel on the hourly chart below, which lends further credence to the idea that support may be imminent. The best triggers for this trade would be bullish engulfing patterns, bullish reversal divergence, and/or pin bars on this hourly time frame.

    Further Validation for GBP/CAD Longs


    This move is currently showing some choppy action as evidenced by the last few candlesticks, but the good news is that most traders would have missed this anyway, and thus, the interaction will begin after price has had a chance to make up its mind. Nonetheless, the usual two or three attempts to get in on a potential bullish move up should be anticipated and prepared for.
    By Kaye Lee, private fund trader and head trader consultant, StraightTalkTrading.com


    More...

  8. #8
    member TechnoMeter's Avatar
    Join Date
    Apr 2013
    Posts
    1,636
    Blog Entries
    421

    4 GBP/AUD Signals That Favor the Downside

    Talking Points:

    • Potential Re-test of Broken Trend Line
    • 2 Concurrent Signals on the 4-Hour Chart
    • Rising Wedge Pattern in Play for GBP/AUD


    It is rare for a double-top pattern to represent a potential entry point in forex—or in other markets, for that matter—as prices often overshoot the estimated turnaround area. Today's trade is no exception to that general rule, although this is as close to a double top as we’re likely to see in such choppy markets.

    The story begins on the daily chart of GBPAUD, which is showing somewhat bearish momentum. A trend line was recently broken, but it has yet to be retested. That is a prime opportunity to look for a potential short set-up in order to hop on should the trend line break prove false and the move continue to the down side. Nonetheless, even a return to test the top of the broken trend line would quite easily produce a move in excess of 200 pips.

    Guest Commentary: Daily Trend Line Break in GBP/AUD


    As seen on the below four-hour chart, price has already hesitated once at a previous overhead resistance cluster, as marked. The pin bar that resulted on the four-hour chart did not result in a downward move, but it was sufficient evidence to support the continued presence of sellers in the area of the shaded blue box. Should price reverse from its current location, a double top (or as close to one as can be reasonably expected in forex) would be formed.

    It is also worth noting that this short trade is actually in the direction of the daily trend, and not against it.

    Guest Commentary: Key Resistance Zone for Selling GBP/AUD


    The estimated resistance zone is 1.7976-1.8061, an area that is 85 pips in depth and ultimately insufficient from a risk standpoint to justify taking this trade. As a result, a lower time frame will have to be employed in order to improve the ratio and find a viable trade trigger.

    Things look rosier on the hourly chart below, where a wedge-type pattern has formed. Price is now creeping steadily along the lower boundary of the wedge, which is a sign of decreased momentum. It may well simply break down here, although it is equally possible that a retest of the highs or even a temporary spike past the top of the wedge may occur.

    Guest Commentary: Rising Wedge on GBP/AUD Hourly Chart


    In all, the safest response is to hold off until at least a new high has been made, allowing for the potential occurrence of bearish reversal divergence in the process. Should such divergence not appear, pin bars and/or bearish engulfing candlestick patterns would also indicate viable short-entry opportunities, particularly if price made a last-minute momentum move.

    The hourly time frame should provide a risk zone most likely in the 35- to 50-pip range, which is small enough to justify taking this trade. Nonetheless, two or three attempts may be required to successfully hop on to this move. One last item firmly in this trade's favor, however, is the fact that the four-hour chart is currently displaying six consecutive bullish bars, and reversion to the mean theory suggests that GBPAUD is now overdue for some bearish movement.
    By Kaye Lee, private fund trader and head trader consultant, StraightTalkTrading.com


    More...

  9. #9
    member TechnoMeter's Avatar
    Join Date
    Apr 2013
    Posts
    1,636
    Blog Entries
    421

    GBP/JPY Technical Analysis

    Talking Points:

    • GBP/JPY Technical Strategy: Flat
    • Support: 171.91 (23.6% Fib exp.), 171.37 (38.2% Fib exp.)
    • Resistance:172.66 (triangle top)


    The British Pound may be readying to turn lower against the Japanese Yen after prices put in a Bearish Engulfing candlestick pattern below resistance at the top of a Triangle setup carved out since the beginning of the year. Near-term support is at 171.91, the 23.6% Fibonacci expansion, with a break below that aiming for the 38.2% level at 171.37. Triangle resistance is now at 172.66.
    Risk/reward considerations argue against taking a short position with prices trading in close proximity to relevant support. We will remain flat for the time being, waiting for a more attractive setup to present itself.


    --- Written by Ilya Spivak, Currency Strategist for DailyFX.com


    More...

  10. #10
    member TechnoMeter's Avatar
    Join Date
    Apr 2013
    Posts
    1,636
    Blog Entries
    421

    GBPNZD Technical Analysis

    A Nearby "Hot Spot" for GBP/NZD Longs

    Talking Points:

    • Aggressive Downtrend and Consolidation in GBP/NZD
    • 4 Concurrent Bullish Signals Flashing Right Now
    • How to Trade a New GBP/NZD Uptrend


    Today, we look to the daily chart of GBPNZD, where a bullish technical event has now shifted the dynamics on the chart to favor further upside price movement. The pattern on the below chart should be especially interesting for swing traders who like to catch medium- and longer-term market movements.

    One simple yet powerful thing to keep in mind about support and resistance is that the dominant levels on the weekly time frame generally act as major turning points in the market. As shown, GBPNZD tested a major weekly resistance level in February 2014, and it’s no surprise that the market sold off aggressively from this point and began a full-blown downtrend from there.

    Guest Commentary: Aggressive Downtrend in GBP/NZD


    The downtrend lasted for several weeks, with nearly every daily candle closing much lower than the day’s opening price. These “straight-line” trends can be very potent and produce explosive price movements. However, we all know the market doesn’t move in a straight line forever.

    After the strong downtrend momentum died off, GBPNZD fell into a consolidation phase, grinding sideways for a little over a month. A general rule of thumb for such consolidation patterns is that the longer the consolidation, the more potent the ensuing breakout. And, consistent with that rule of thumb, during last week’s trading, bullish momentum in GBPNZD built up to a critical level and we finally saw an initial breakout.

    As shown, GBPNZD breached the key resistance level that had been containing price for the month prior. This bullish rally ultimately continued and resulted in the formation of new recent highs.

    Essentially, the dynamics have now gone from bearish to bullish for GBPNZD, and technical signals are aligned and suggesting further upside movement ahead. Some of the key points that currently give a bullish bias include:

    • GBPNZD is now trading above the critical resistance level
    • A higher high has been formed
    • Price is trading on the bullish side of the mean value, as indicated by the 10- and 20-period exponential moving averages (EMAs)
    • The mean value is angled upwards, reflecting this new bullish momentum


    How to Trade a New GBP/NZD Uptrend

    In all, we’re looking for the potential formation of a sustained bullish trend in GBPNZD, and are waiting for the market to weaken and correct back downwards to re-test the previous resistance (now support) level. If this market has any chance of developing a clean new uptrend, this horizontal level will need to hold as support.

    Guest Commentary: Key Support Zone for Buying GBP/NZD


    The area we’re targeting for possible long-entry positions also coincides with the mean value (10 and 20 EMA), which behaves as dynamic support during bullish trends.

    The synchronicity of these uncorrelated variables creates a nice “hot spot” where bullish reversal set-ups may develop. Traders should wait for bullish candlestick reversal patterns including pin bars, engulfing candles, outside candles, or even proprietary, system-generated buy signals before initiating new long positions.

    When we switch over and look at price action on the weekly chart of GBPNZD, it’s easier to see the “bigger picture” and discern longer-term market direction. As shown below, the weekly chart suggests the pair is looking to retest the major weekly resistance level around the 2.0200 level, as range-bound conditions continue to prevail on the weekly time frame.

    Guest Commentary: Prevailing Weekly Range for GBP/NZD


    By Graham Blackmore of TheForexGuy.com


    More...

Page 1 of 17 1 2 3 11 ... LastLast

Tags for this Thread

Bookmarks

Posting Permissions

  • You may not post new threads
  • You may not post replies
  • You may not post attachments
  • You may not edit your posts
  •