
 LinkBack URL
 About LinkBacks


Talking Points:
- GBP/JPY Technical Strategy: Flat
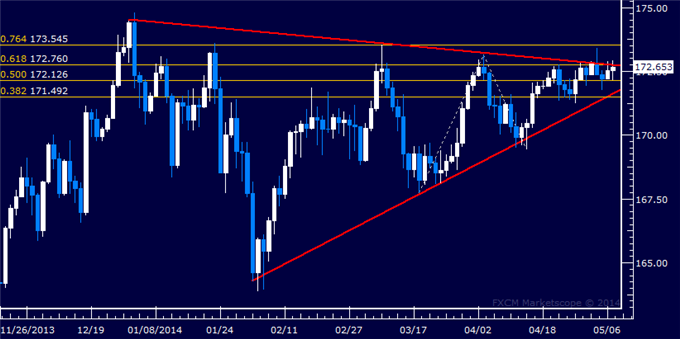
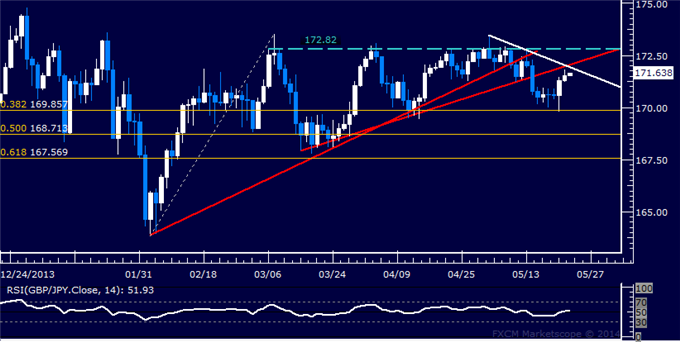
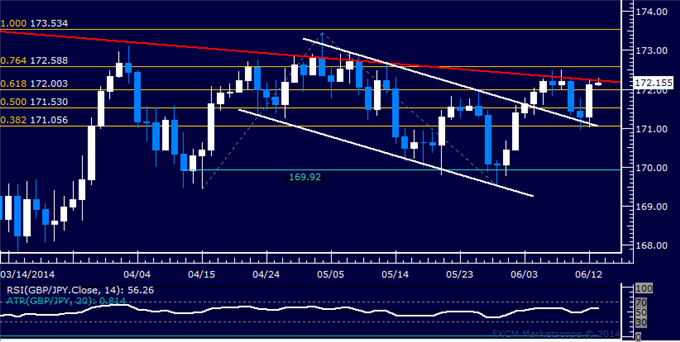
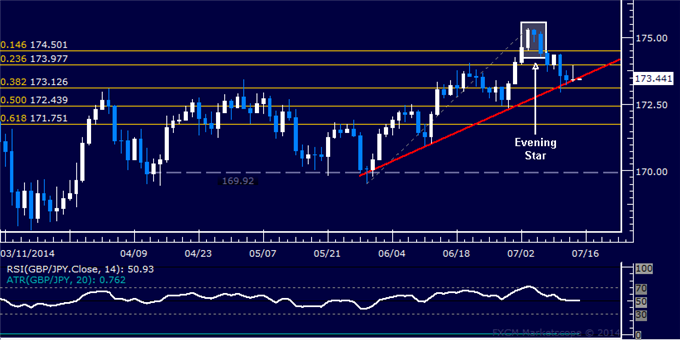
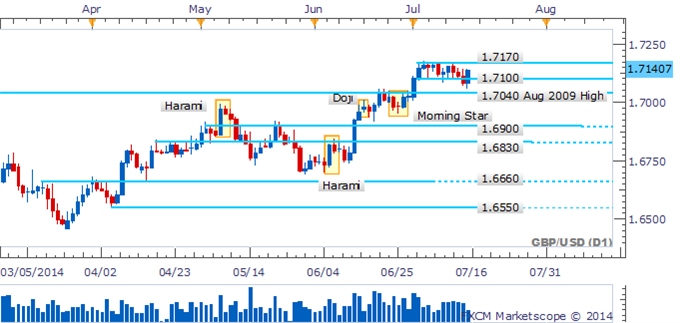
- Support: 172.13 (50% Fib exp.), 171.49-64 (38.2% Fib exp., Triangle floor)
- Resistance:172.76 (61.8% Fib exp., Triangle top), 173.55 (76.4% Fib exp.)
The British Pound continues to look for clear-cut direction cues against the Japanese Yen, with prices consolidating in a large Triangle chart formation. Near-term support is at 172.13, the 50% Fibonacci expansion, with a break below that targeting the intersection of the 38.2% level and the Triangle bottom in the 171.49-64 area. Alternatively, a daily close above the 172.76 – marked by the 61.8% Fib and the Triangle top – initially exposes the 76.4% expansion at 173.55.
On balance, a Triangle pattern typically implies trend continuation, which carries bullish implications in this case. Confirmation is absent without a clear-cut break above the formation’s upper boundary however. With that in mind, we will continue to stand aside for now.
--- Written by Ilya Spivak, Currency Strategist for DailyFX.com
More...


 Reply With Quote


 4
4 


Bookmarks