
 LinkBack URL
 About LinkBacks


Talking Points
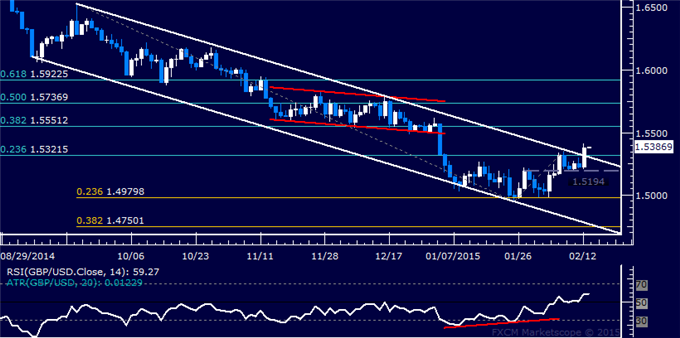
- Strategy: Flat, Short Pending On Close Below 1.5585
- Awaiting Guidance Near Key Technical Barrier
- Morning Star Taking Shape On H4 Chart
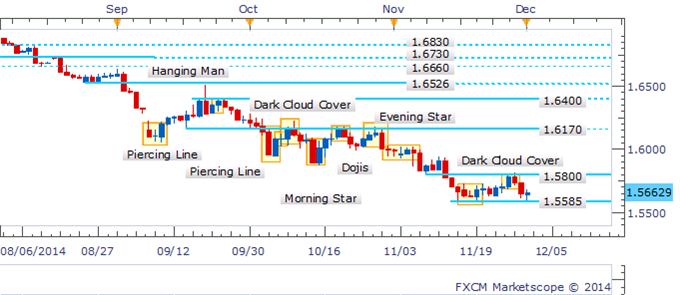
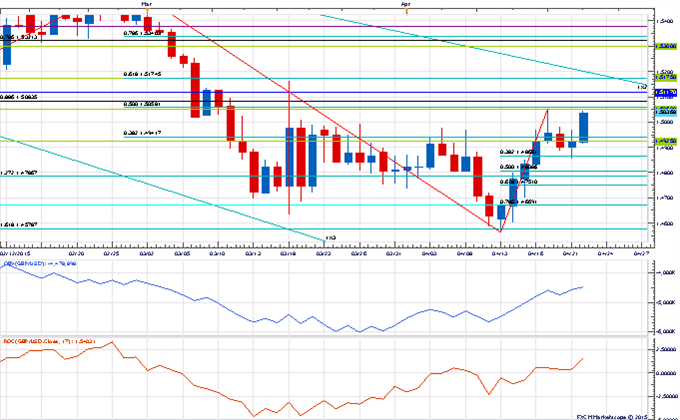
GBP/USD is once again pressing against its range bottom near 1.5585 as a Doji emerges on the daily. The pattern suggests reluctance from the bears to drag the pair lower. Yet it is not a key reversal pattern, which in turn casts some doubt over the potential for a bounce back to the 1.5800 ceiling.
Doji Emerging Near Range-Bottom
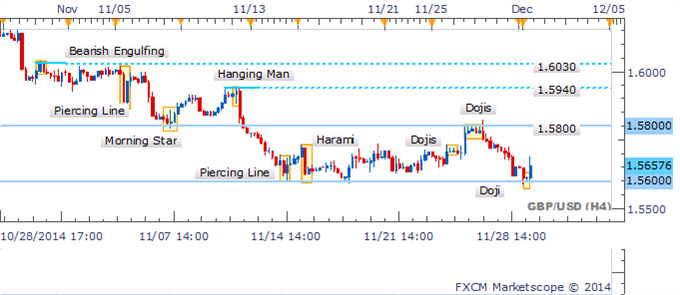
The four hour timeframe is beginning to paint a more constructive picture. The close of the current candle in its present position would mark a Morning Star formation. Such a bullish reversal signal would return the risks higher towards the 1.5800 mark.
Morning Star Taking Shape In Intraday Trade
By David de Ferranti, Currency Analyst, DailyFX
More...


 Reply With Quote


Bookmarks