
 LinkBack URL
 About LinkBacks


Talking Points:
- GBP/JPY Technical Strategy: Flat
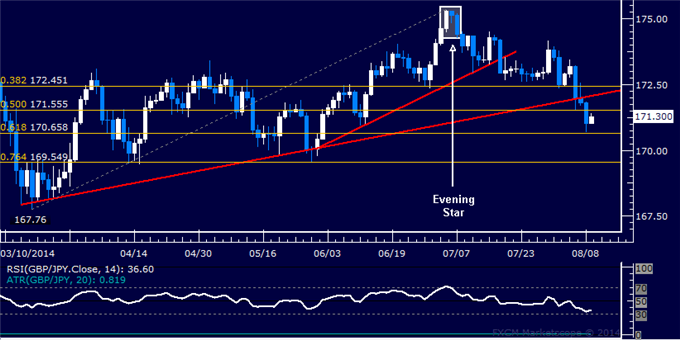
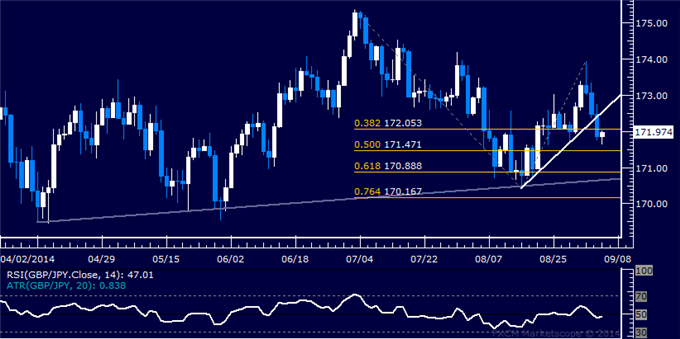
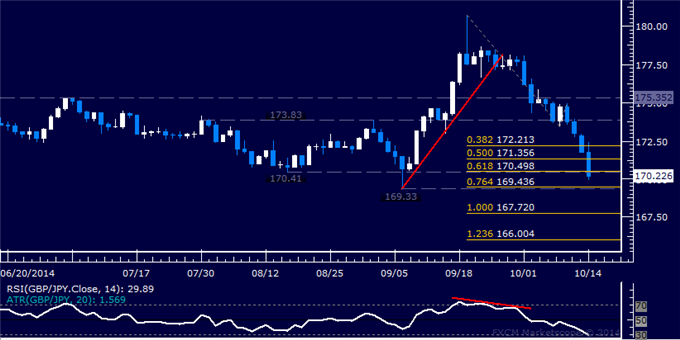
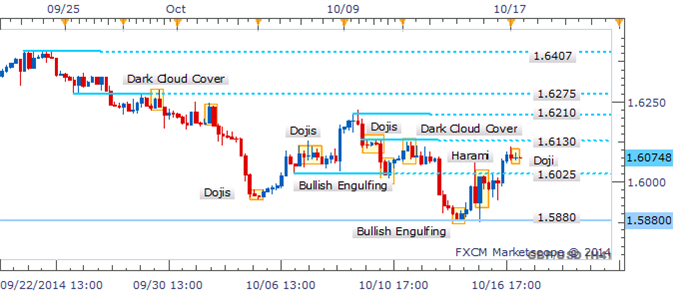
- Support: 170.66, 169.55, 167.76
- Resistance: 171.56, 172.08, 172.45
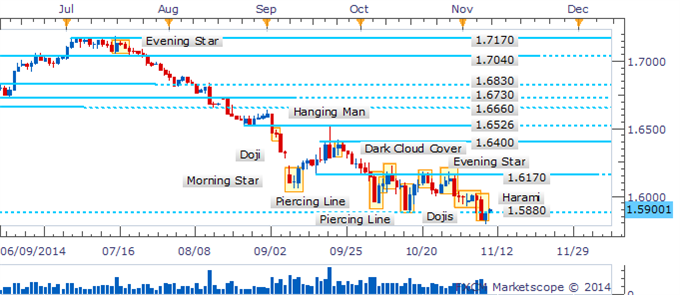
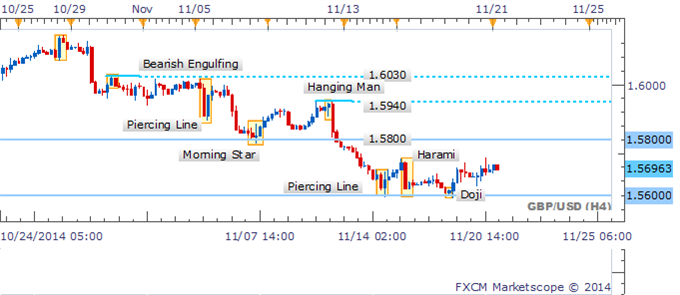
The British Pound declined as expected against the Japanese Yen after putting in a bearish Evening Star candlestick pattern. Near-term support is at 170.66, the 61.8% Fibonacci retracement, with a break below that on a daily closing exposing the 76.4% level at 169.55. Alternatively, a reversal above the 50% Fib at 171.56 targets rising trend line support-turned-resistance at 172.08.
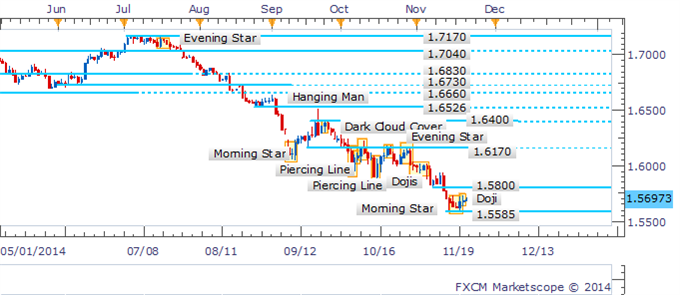
We will tactically opt to stand aside for now. While entering a short trade seems compelling, the weekly chart shows prices testing support in play since November 2013. Furthermore, our fundamental outlook leaves room for a GBP recovery this week. On balance, we will stand aside.
--- Written by Ilya Spivak, Currency Strategist for DailyFX.com
More...


 Reply With Quote


Bookmarks