Page 1 of 14 1 2 3 11 ... LastLast
Results 1 to 10 of 140
Like Tree1Likes

AUD Technical Analysis

This is a discussion on AUD Technical Analysis within the Forex Trading forums, part of the Trading Forum category; An AUD/CHF Short That’ll Test Your Mettle Talking Points: Accelerating Downtrend in AUD/CHF "Bounce-or-Break" Scenario on Daily Chart 3 Ways ...


Hybrid View

  1. #1
    member TechnoMeter's Avatar
    Join Date
    Apr 2013
    Posts
    1,636
    Blog Entries
    422

    AUD Technical Analysis

    An AUD/CHF Short That’ll Test Your Mettle

    Talking Points:

    • Accelerating Downtrend in AUD/CHF
    • "Bounce-or-Break" Scenario on Daily Chart
    • 3 Ways to Trade This Short Set-up


    AUDCHF is not a pair that often features in most traders' considerations, but it may well be setting up for a nice move soon.
    The weekly chart below shows a downtrend that has accelerated over the past year, as evidenced by the steeper trend line. Although there is almost certainly divergence regardless of which indicator is used, even a single weekly candlestick downwards could potentially yield 150 pips or more. Given how long this trend has been in force, it is certainly wiser to go with the downward flow rather than bet against it.

    Guest Commentary: Accelerating Weekly Downtrend in AUD/CHF


    The daily chart below shows an even more optimistic picture, as AUDCHF is currently testing resistance and there are approximately 300 pips between the current price and the previous low. As with all “bounce-or-break” scenarios involving trend lines, it is far wiser to assume that the trend is still intact, and that makes this an excellent short set-up.

    Guest Commentary: “Excellent” Short Set-up in AUD/CHF


    The four-hour chart is most forthcoming with regard to support and resistance. Previous horizontal levels from a consolidation zone have just come into effect for this trade and are likely to provide a potential turning point.

    Guest Commentary: Potential Turning Point for AUD/CHF


    The key resistance zone is defined as 0.8050-0.8141, but mildly disturbing about this zone is that it is 91 pips wide, which is close to a day's average true range for this pair. Thus, more conservative traders may actually prefer to take a trigger off the four-hour chart. The risk would be somewhat larger (most likely in the 30- to 40-pip range), but given the potential for 300 pips or more, this would hardly be a problem. This is actually the best way to trade this set-up.
    It is also possible to trade it on an hourly time frame, with only some modifications.

    Guest Commentary: Hourly Set-up in AUD/CHF


    The recent momentum that has caused price to barrel into the resistance zone is cause for concern. Thus, an additional level of resistance has been estimated using the Fibonacci expansion tool. This provides a smaller resistance area (0.8090-0.8134) within the larger zone, but given how close the top is to the larger zone, the final preferred risk zone is 0.8090-0.8141. This zone is only 51 pips in depth, which is acceptable on the risk side of the equation.

    It is worth noting that by targeting a smaller resistance zone, the trade may actually miss triggering by just a little before shooting down, but that is a trade-off that more conservative traders must accept. Aggressive traders, on the other hand, could still use the original blue box on the hourly chart, provided they are extremely defensive in their trade management.

    Trades on both time frames may be initiated using bearish reversal divergence, pin bars, and/or bearish engulfing candlesticks as triggers. Two or three attempts should be made to get onto the move.

    The interesting thing about this set-up is that there may actually be a case for more highly skilled traders to enter scalps off the white box on the 15-minute chart (not shown). Less-experienced traders should stay away from this approach, however, as it requires expert trade management.
    By Kaye Lee, private fund trader and head trader consultant, StraightTalkTrading.com


    More...
    CamaRon likes this.
    Trading blogs || My blog

  2. #2
    member TechnoMeter's Avatar
    Join Date
    Apr 2013
    Posts
    1,636
    Blog Entries
    422

    AUDCAD Technical Analysis

    Popular AUD/CAD Pattern That May Not Work This Time

    Talking Points:

    • Weak Uptrend on AUD/CAD Daily Chart
    • Trading Against a Head-and-Shoulders Pattern
    • Key Support Zone for Buying AUD/CAD


    Head-and-shoulders patterns tend to generate a lot of excitement among traders. However, there are a few factors that can cause these popular patterns to fail, especially if they are entered too quickly. AUDCAD is currently exhibiting one potential example of this situation.

    As shown below, the rising wedge pattern on the AUDCAD daily chart signals a rather weak uptrend in the bigger picture, but it has not yet shown any of the usual wedge pattern breakdown signals. The most telling signal would be a quick move beyond the upper wedge resistance before breaking back in again swiftly. Since it has done no such thing, this pattern can be traded using traditional support and resistance principles instead.

    Guest Commentary: Rising Wedge Pattern on AUD/CAD Daily Chart


    The head-and-shoulders pattern on the below AUDCAD four-hour chart will become obvious once the neckline denoted by the black horizontal line has been drawn. However, less-experienced traders might easily miss the fact that this pattern will have to punch through at least three levels of rising support in order to achieve its goal. In addition, this goes against the dominant trend on the daily chart.

    Guest Commentary: Head-and-Shoulders Pattern in AUD/CAD


    This is not impossible, of course. However, a far more likely short-term development would be a bounce off one of these rising lines of support, which is why today's trade is to the long side.

    The hourly chart below clearly provides a reasonable support zone for initiating new longs. The exact zone comes in at 0.9849-0.9882.

    Guest Commentary: Key Support Zone for Buying AUD/CAD


    This risk zone is a mere 33 pips deep, as compared to the 60-100 pips that even a conservative move to retest the recent highs would supply.

    Nonetheless, in order to achieve greater precision with this trade entry, the 15-minute time frame (chart not shown) is preferred. Viable triggers would include the usual suspects, including bullish reversal divergence, pin bars, and/or bullish engulfing patterns on the 15-minute chart.

    Dropping down to the lower time frame should provide even narrower risk, however, traders should be willing to take two or three tries to get in on this move. Although this is essentially an intraday trade, part of the position can be scaled out and the remainder left to ride what could be a worthwhile move amid acceptable risk.

    By Kaye Lee, private fund trader and head trader consultant, StraightTalkTrading.com


    More...

  3. #3
    Administrator newdigital's Avatar
    Join Date
    Feb 2013
    Posts
    10,474
    Blog Entries
    2913
    Follow newdigital On Twitter Add newdigital on Facebook Add newdigital on Google+ Add newdigital on MySpace
    Add newdigital on Linkedin
    AUD/CAD was on the primary bearish market condition with the bear market rally: the price was on the breakout for breaking resistance levels on the way to go to uptrend. For now - the p[rice is breaking 100 period SMA and it was stopped near 200 period SMA in the ranging between the primary bearish and the primary bullish trend of the chart.

    AUD Technical Analysis-audcad-w1-alpari-limited.png


    Resistance Support
    0.9870 0.9678
    N/A 0.9148


    If the price breaks 0.9870 key resistance level so the reversal from the primary bearish to the primary bullish market condition will be started.
    If not so the price will be ranging within the levels.
    Premium Trading Forum: subscription, public discussion and latest news
    Trading Forum wiki || MQL5 channel for the forum
    Trading blogs || My blog

  4. #4
    member mql5's Avatar
    Join Date
    May 2013
    Posts
    2,332
    Blog Entries
    1641

    Quick Technical Overview - Buy AUD against CAD: intra-day breakout with bullish reversal

    AUD/CAD: possible bullish breakout. Intra-day price is breaking Ichimoku cloud to above for the reversal of the price movement from the primary bearish to the primary bullish market condition with 0.9958 key reversal resistance level. Chinkou Span line is located near and below the price to be ready for the breakout, and Absolute Strength indicator is estimating the future trend as the ranging bullish.

    AUD Technical Analysis-audcad-h4-alpari-limited.png


    There are the following news events which will be affected on AUD/CAD price movement for the week:

    • 2016-03-22 20:00 GMT | [CAD - Annual Budget Release]
    • 2016-03-23 14:30 GMT | [USD - Crude Oil Inventories]
    • 2016-03-24 12:30 GMT | [USD - Core Durable Goods]

    AUD Technical Analysis-audcad-h4-alpari-limited-2.png


    Resistance
    Support
    0.9958 0.9893
    1.0001 0.9863
    Metatrader 5 / Metatrader 4 for MQL5 / MQL4 articles preview preview
    Trading blogs || My blog

  5. #5
    member mql5's Avatar
    Join Date
    May 2013
    Posts
    2,332
    Blog Entries
    1641

    AUD/CAD Technical Analysis 2016, 24.04 - 01.05: bearish reversal with breakdown

    Daily price is on bearish reversal with the breakdown which was started in the middle of the last week: the price is testing 0.9751 support level for the breakdown to be continuing. Chinkou Span line crossed the price to below for the bearish trend, and Absolute Strength indicator is estimating the bearish breakdown to be continuing in the near future.

    If D1 price will break 0.9751 support level on close bar so the bearish trend will be continuing.
    If D1 price will break 0.9961 resistance level on close bar so the price will be reversed back to the bullish market condition.
    If not so the price will be on ranging within the levels.

    AUD Technical Analysis-audcad-d1-alpari-limited.png


    • Recommendation for long: watch close D1 price to break
      0.9961
      for possible buy trade
    • Recommendation to go short: watch D1 price to break 0.9751 support level for possible sell trade
    • Trading Summary: bearish breakdown

    Resistance
    Support
    0.9961 0.9751
    1.0053 0.9596
    SUMMARY : bearish

    TREND : breakdown
    Metatrader 5 / Metatrader 4 for MQL5 / MQL4 articles preview preview
    Trading blogs || My blog

  6. #6
    member mql5's Avatar
    Join Date
    May 2013
    Posts
    2,332
    Blog Entries
    1641

    AUD/CAD Technical Analysis - waiting to break the levels

    Daily price is located below SMA with period 200 (200 SMA) for the primary bearish market condition: the price is on ranging within narrow s/r levels waiting for the direction.

    • If the price will break 0.9590 resistance level so the daily bullish reversal will be started.
    • If price will break 0.9322 support so the bearish trend will be continuing.
    • If not so the price will be ranging within the levels.

    Resistance Support
    0.9590 0.9322
    0.9871 N/A
    AUD Technical Analysis-audcad-d1-alpari-limited.png


    • Recommendation to go short: watch the price to break 0.9322 support level for possible sell trade
    • Recommendation to go long: watch the price to break 0.9590 resistance level for possible buy trade
    • Trading Summary: ranging bearish
    Metatrader 5 / Metatrader 4 for MQL5 / MQL4 articles preview preview
    Trading blogs || My blog

  7. #7
    member mql5's Avatar
    Join Date
    May 2013
    Posts
    2,332
    Blog Entries
    1641

    AUDCAD Technical Analysis 2016, July: possible weekly bullish reversal to be started

    Weekly price is on ranging condition located inside Ichimoku cloud within 0.9749 resistance level and 0.9323 support level. Absolute Strength indicator is estimating the bullish reversal to be started together with 0.9749 resistance level to be broken to above.

    AUD Technical Analysis-audcad-w1-metaquotes-software-corp.png


    If W1 price breaks 0.9749 resistance level on close bar so the bullish reversal will be started.
    If W1 price breaks 0.9323 support level on close bar so the bearish trend will be resumed.
    If not so the price will be on ranging within the levels.
    Metatrader 5 / Metatrader 4 for MQL5 / MQL4 articles preview preview
    Trading blogs || My blog

  8. #8
    member mql5's Avatar
    Join Date
    May 2013
    Posts
    2,332
    Blog Entries
    1641

    Technical Intra-Day Targets for AUD/CAD

    AUD Technical Analysis-audcad-h4-alpari-limited.png


    H4 price is located near and below 200 SMA for the ranging on the border between the primary bearish and the primary bullish market condition. If the price breaks 0.9889 resistance to above so the bullish reversal of the intra-day price movement will be started, otherwise - bearish ranging near bullish reversal area.
    Metatrader 5 / Metatrader 4 for MQL5 / MQL4 articles preview preview
    Trading blogs || My blog

  9. #9
    member mql5's Avatar
    Join Date
    May 2013
    Posts
    2,332
    Blog Entries
    1641

    AUD/CAD - daily correction with 1.00 psy support level for reversal

    The price is above 200-day SMA in the bullish area of the chart.

    AUD Technical Analysis-audcad-d1-alpari-international-limited.png


    The secondary correction was started in 21st of March 2017 by bouncing from 1.03 resistance level to below to the bearish reversal support level at 1.00.
    Metatrader 5 / Metatrader 4 for MQL5 / MQL4 articles preview preview
    Trading blogs || My blog

  10. #10
    member TechnoMeter's Avatar
    Join Date
    Apr 2013
    Posts
    1,636
    Blog Entries
    422

    Canadian Dollar Rate Forecast

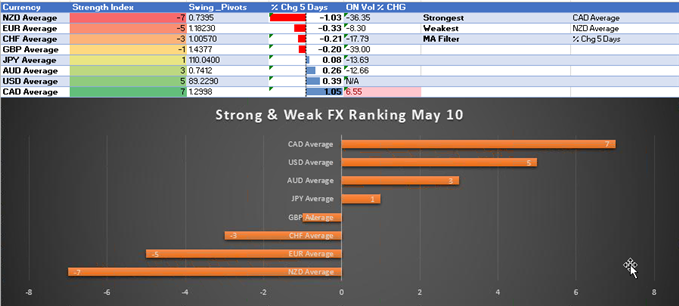
    A strong Candian Dollar is emerging on the back of elevated crude oil prices and a weakening US Dollar on a soft CPI print for April. Now, the focus will turn to the US/CA 2Yr yield differentials to see if the CAD can make up even more ground. The key risk to further CAD strength appears to be overconfidence on a successful outcome to NAFTA talks and potentially rich pricing in of a May rate hike.

    May 10 Strong/Weak G8 FX Dashboard


    The strong/weak table above that I also share on FX closing bell helps to visualize where there is broad strength in the FX market. Currently, the strongest currency is the Canadian dollar based on an equally weighted 5-day % change with the US Dollar as a close second. The weakest currency after the RBNZ and their new Governor Orr provided a message of patience is the New Zealand Dollar.

    Price had appeared wedged between clean support at C$1.2803 and resistance at C$1.29 per USD. However, a swift move higher to C$1.2999 that was reversed provides swing traders with a strong resistance point to build a CAD long bias from. However, the US Dollar remains strong, so if CAD strength persists, GBP/CAD or EUR/CAD may be better plays.

    We typically take a contrarian view to crowd sentiment, and the fact traders are net-short suggests USDCAD prices may continue to rise. Yet traders are less net-short than yesterday and compared with last week. Recent changes in sentiment warn that the current USDCAD price trend may soon reverse lower despite the fact traders remain net-short (emphasis mine.)

    more...
    Trading blogs || My blog

Page 1 of 14 1 2 3 11 ... LastLast

Tags for this Thread

Bookmarks

Posting Permissions

  • You may not post new threads
  • You may not post replies
  • You may not post attachments
  • You may not edit your posts
  •