
 1Likes
 LinkBack URL
 About LinkBacks


An AUD/CHF Short Thatll Test Your Mettle
Talking Points:
- Accelerating Downtrend in AUD/CHF
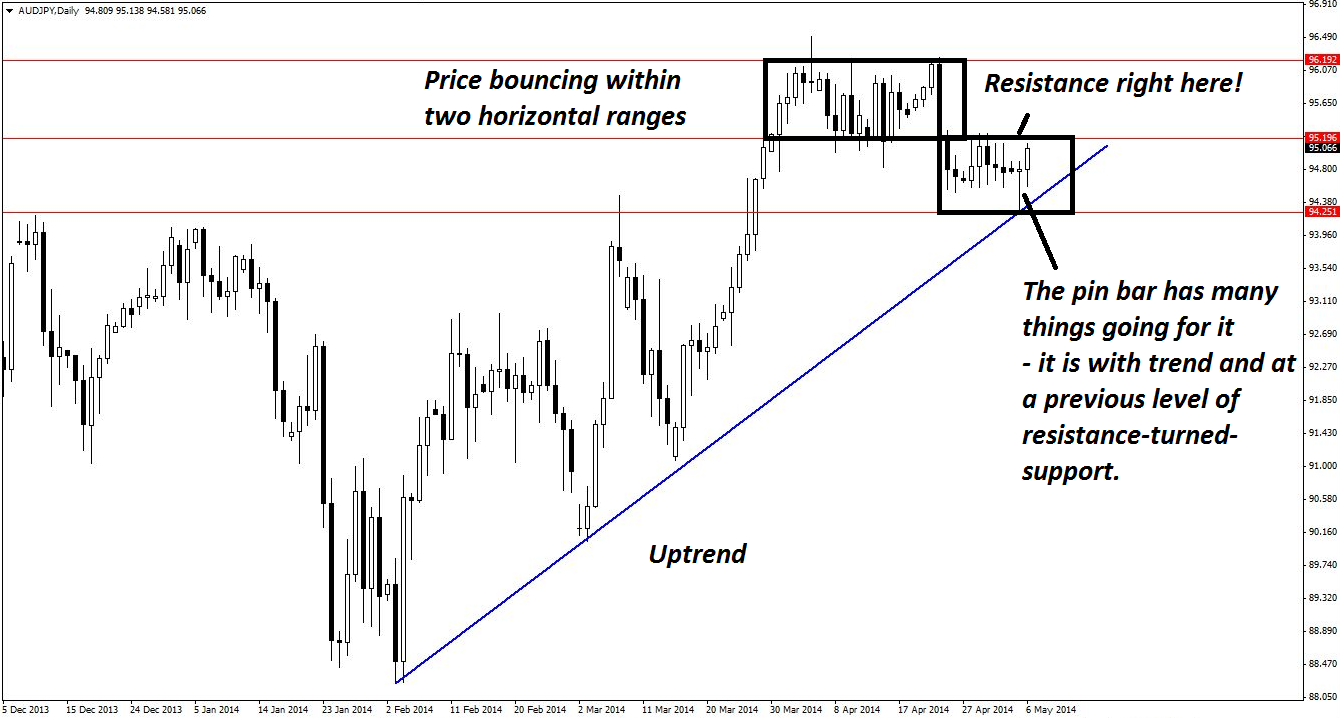
- "Bounce-or-Break" Scenario on Daily Chart
- 3 Ways to Trade This Short Set-up
AUDCHF is not a pair that often features in most traders' considerations, but it may well be setting up for a nice move soon.
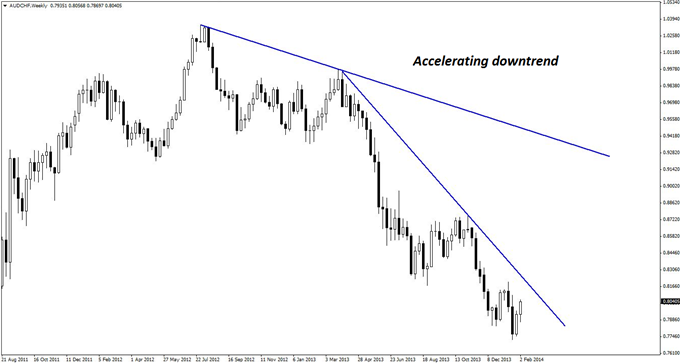
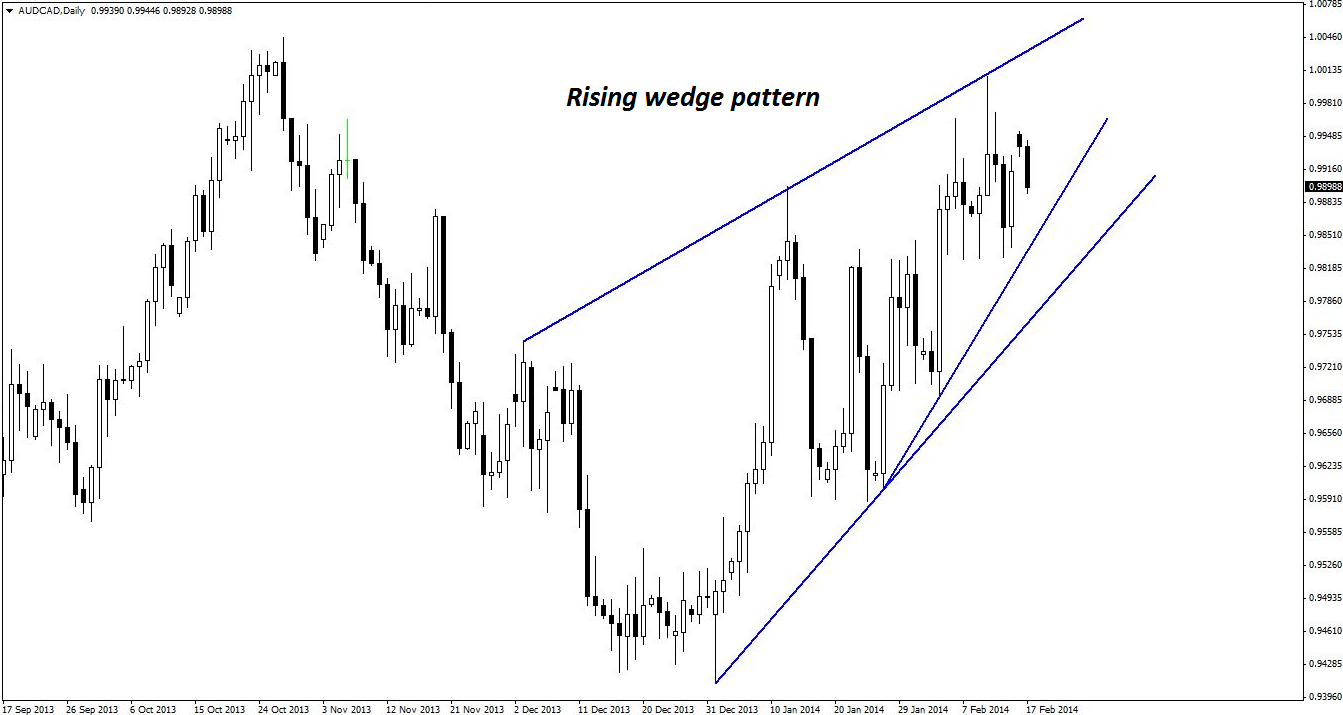
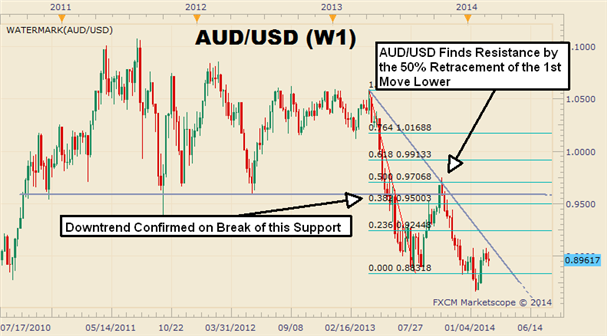
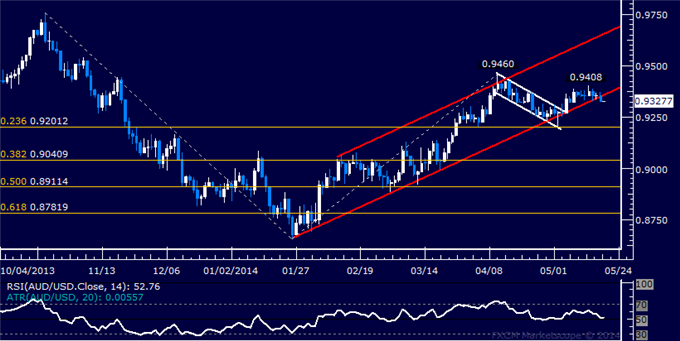
The weekly chart below shows a downtrend that has accelerated over the past year, as evidenced by the steeper trend line. Although there is almost certainly divergence regardless of which indicator is used, even a single weekly candlestick downwards could potentially yield 150 pips or more. Given how long this trend has been in force, it is certainly wiser to go with the downward flow rather than bet against it.
Guest Commentary: Accelerating Weekly Downtrend in AUD/CHF
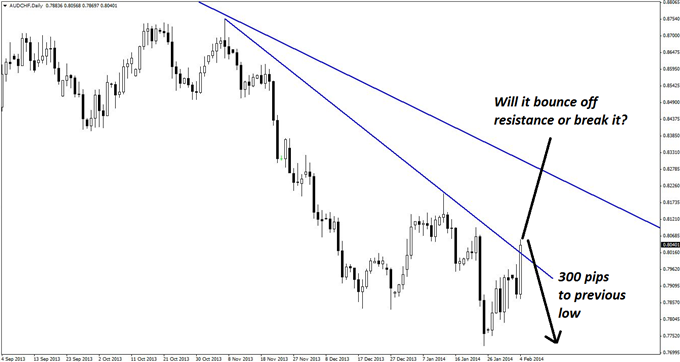
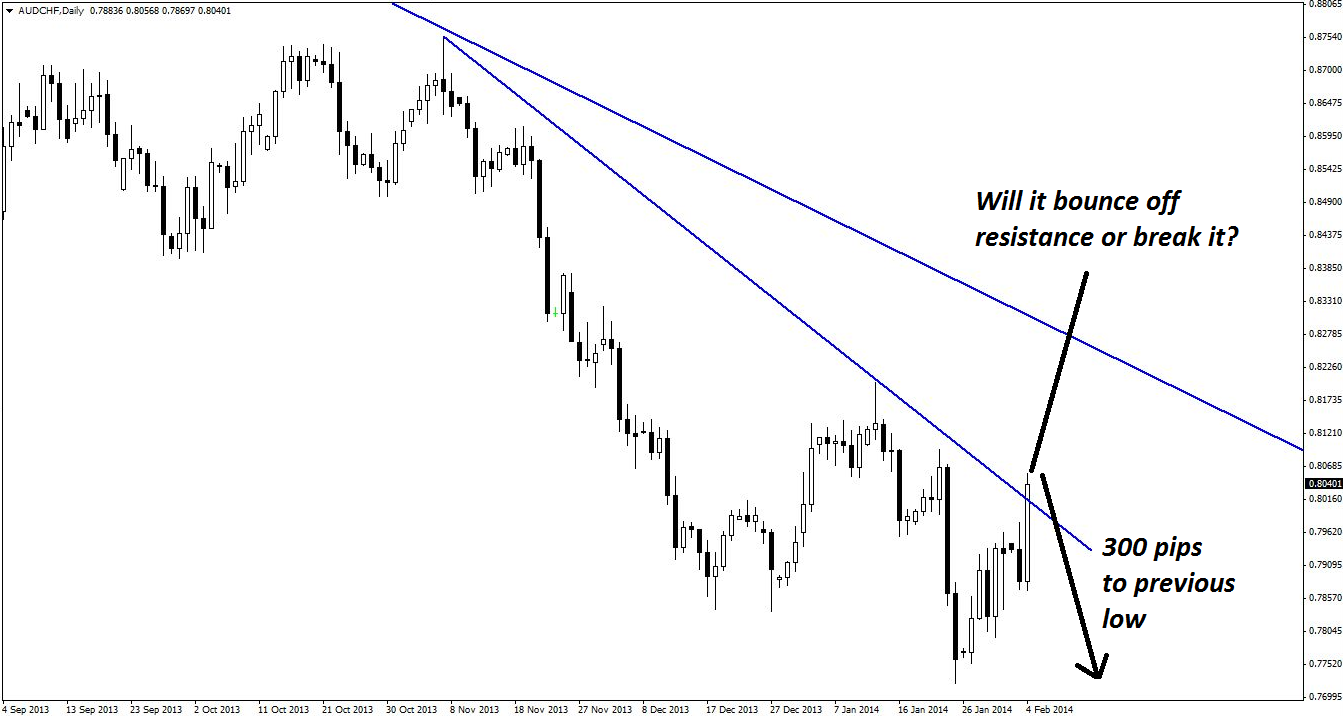
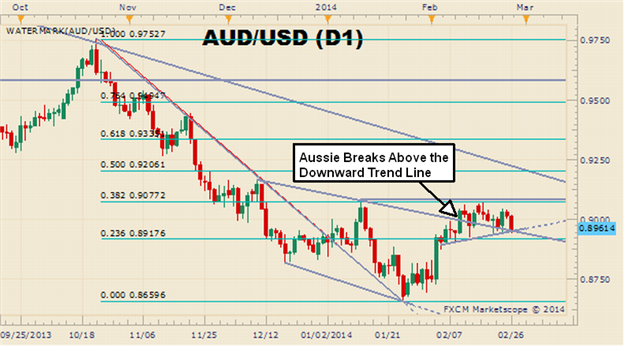
The daily chart below shows an even more optimistic picture, as AUDCHF is currently testing resistance and there are approximately 300 pips between the current price and the previous low. As with all bounce-or-break scenarios involving trend lines, it is far wiser to assume that the trend is still intact, and that makes this an excellent short set-up.
Guest Commentary: Excellent Short Set-up in AUD/CHF
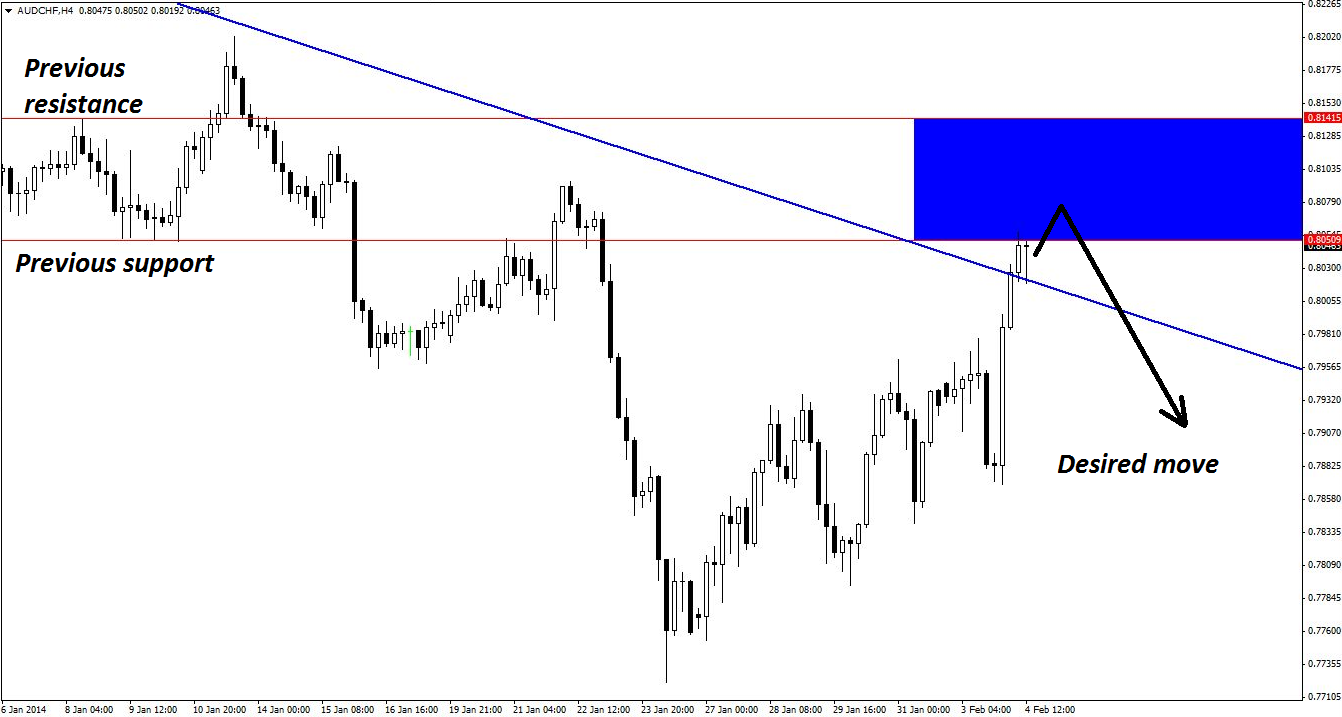
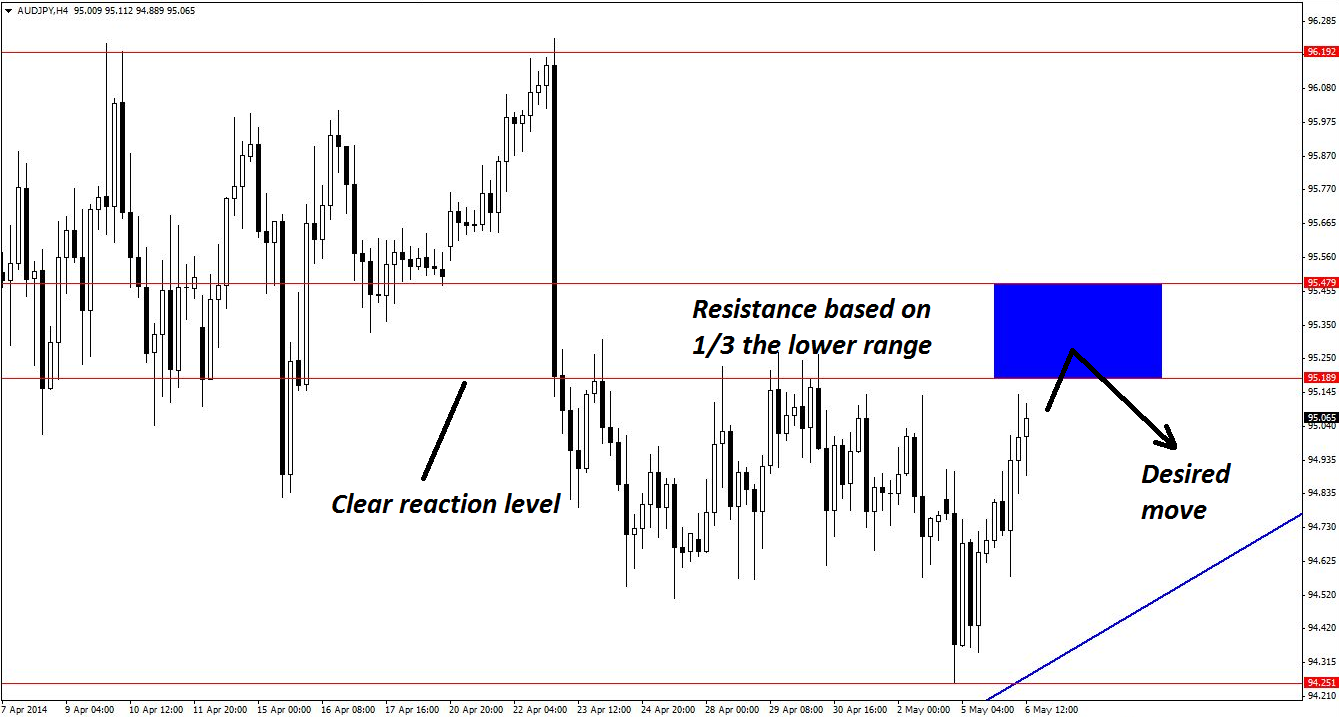
The four-hour chart is most forthcoming with regard to support and resistance. Previous horizontal levels from a consolidation zone have just come into effect for this trade and are likely to provide a potential turning point.
Guest Commentary: Potential Turning Point for AUD/CHF
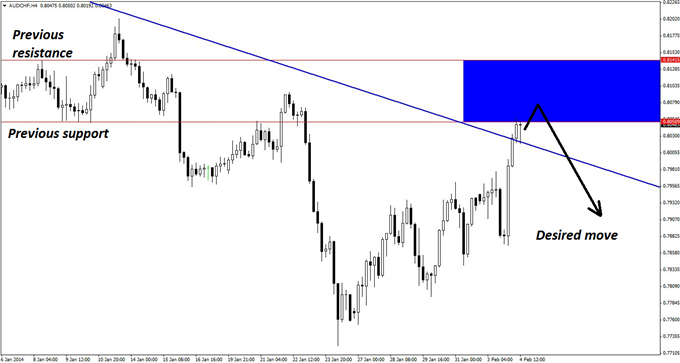
The key resistance zone is defined as 0.8050-0.8141, but mildly disturbing about this zone is that it is 91 pips wide, which is close to a day's average true range for this pair. Thus, more conservative traders may actually prefer to take a trigger off the four-hour chart. The risk would be somewhat larger (most likely in the 30- to 40-pip range), but given the potential for 300 pips or more, this would hardly be a problem. This is actually the best way to trade this set-up.
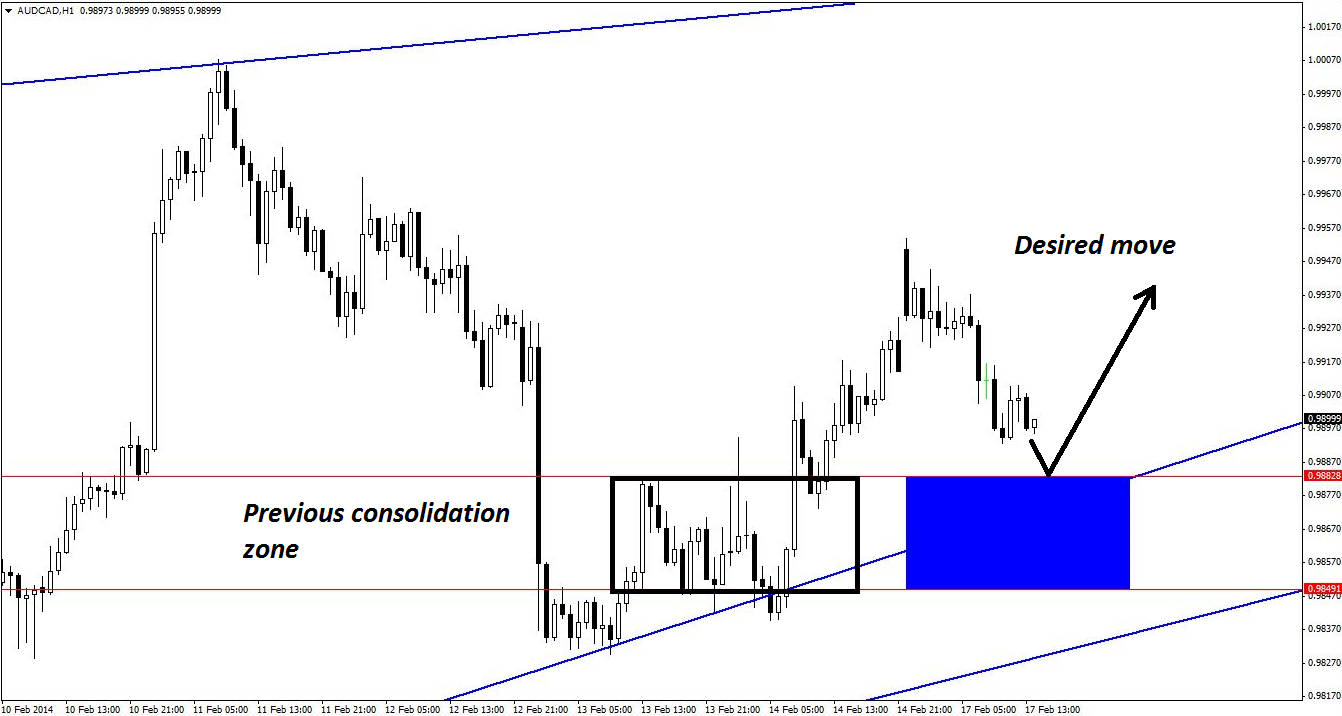
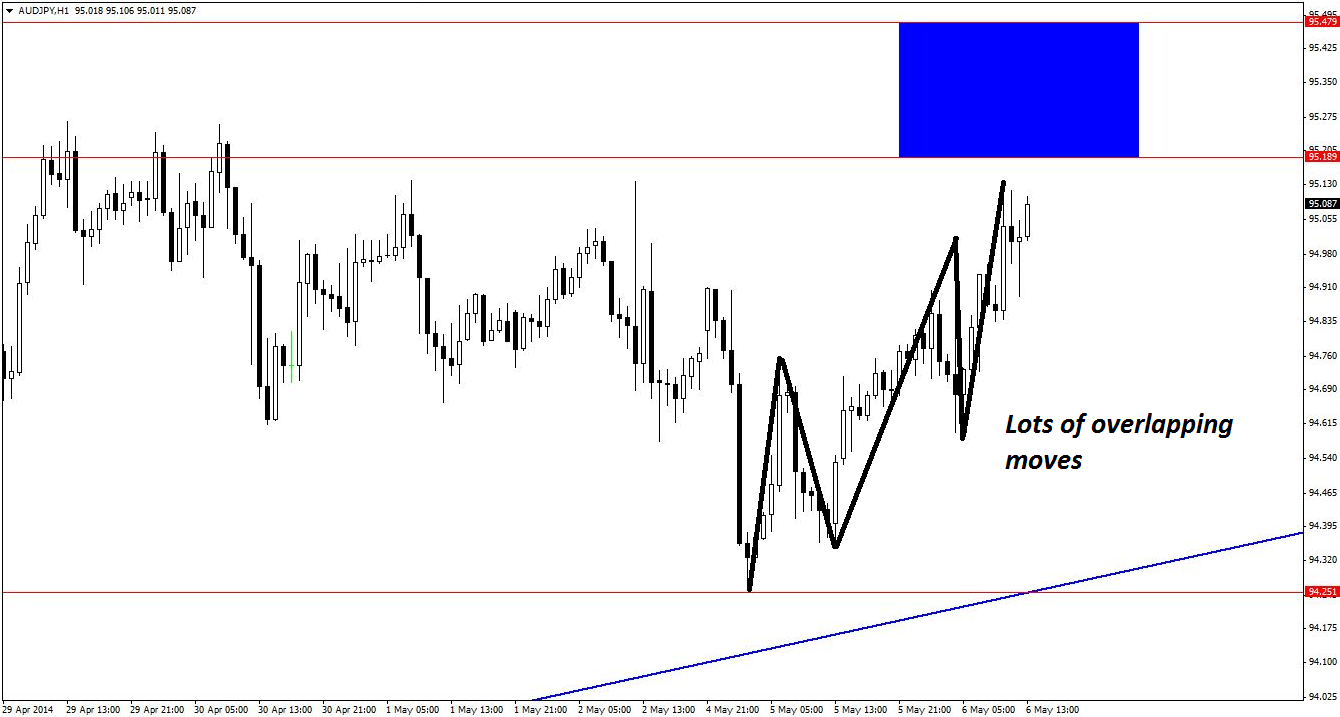
It is also possible to trade it on an hourly time frame, with only some modifications.
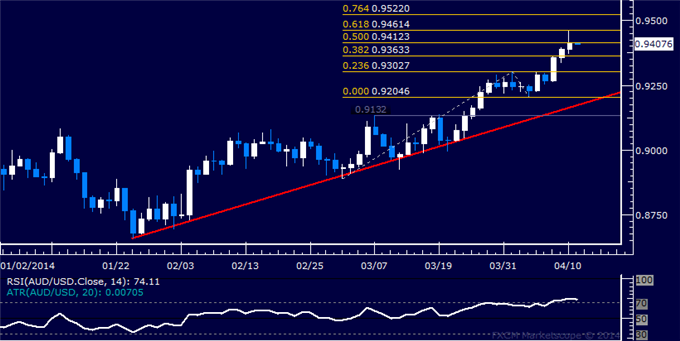
Guest Commentary: Hourly Set-up in AUD/CHF
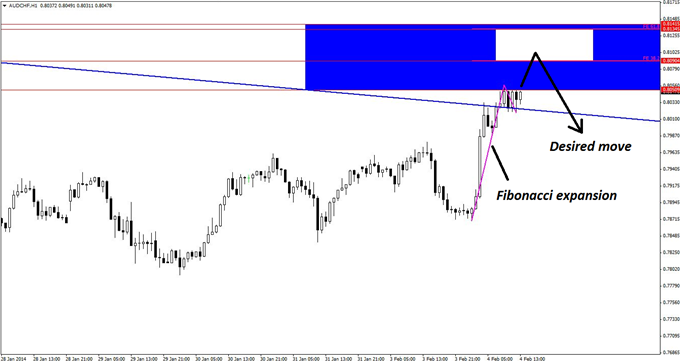
The recent momentum that has caused price to barrel into the resistance zone is cause for concern. Thus, an additional level of resistance has been estimated using the Fibonacci expansion tool. This provides a smaller resistance area (0.8090-0.8134) within the larger zone, but given how close the top is to the larger zone, the final preferred risk zone is 0.8090-0.8141. This zone is only 51 pips in depth, which is acceptable on the risk side of the equation.
It is worth noting that by targeting a smaller resistance zone, the trade may actually miss triggering by just a little before shooting down, but that is a trade-off that more conservative traders must accept. Aggressive traders, on the other hand, could still use the original blue box on the hourly chart, provided they are extremely defensive in their trade management.
Trades on both time frames may be initiated using bearish reversal divergence, pin bars, and/or bearish engulfing candlesticks as triggers. Two or three attempts should be made to get onto the move.
The interesting thing about this set-up is that there may actually be a case for more highly skilled traders to enter scalps off the white box on the 15-minute chart (not shown). Less-experienced traders should stay away from this approach, however, as it requires expert trade management.
By Kaye Lee, private fund trader and head trader consultant, StraightTalkTrading.com
More...


 Reply With Quote


 Although
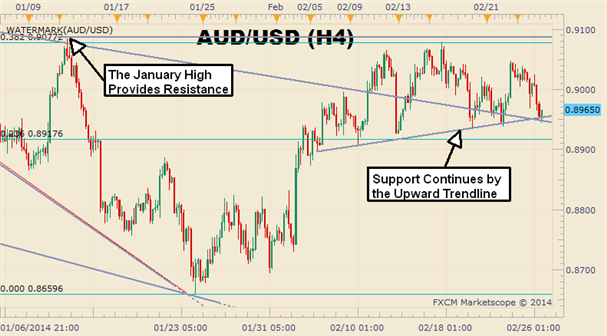


Bookmarks