
 1Likes
 LinkBack URL
 About LinkBacks


Talking Points
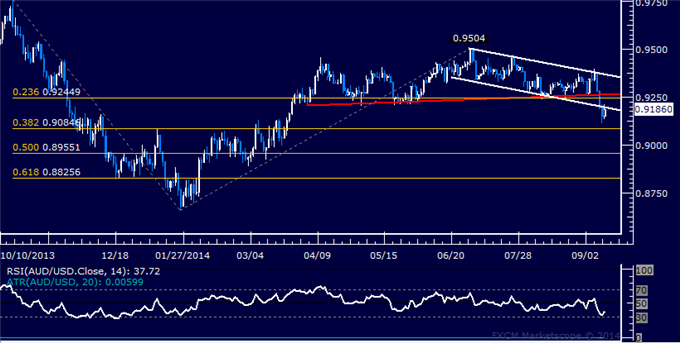
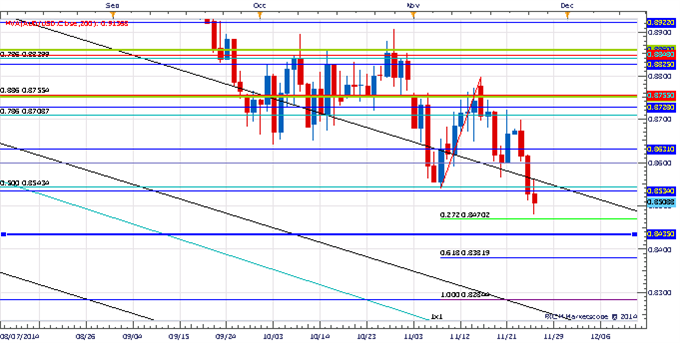
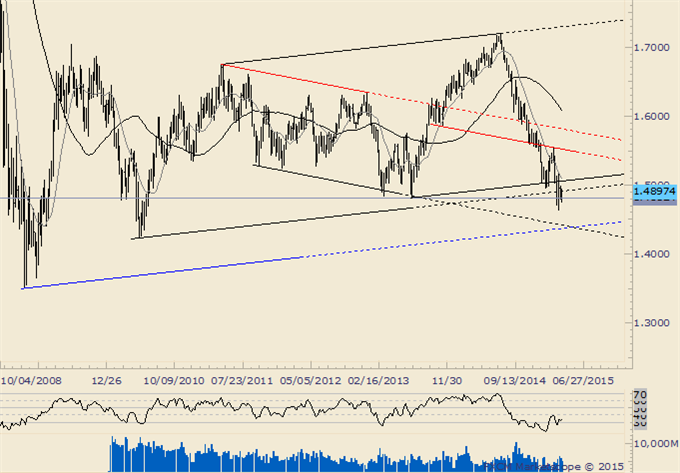
- AUD/USD Technical Strategy: Shorts Preferred
- Dark Cloud Cover Offered Warning Near Range-Top
- Harami Pattern May Find Limited Follow-Through
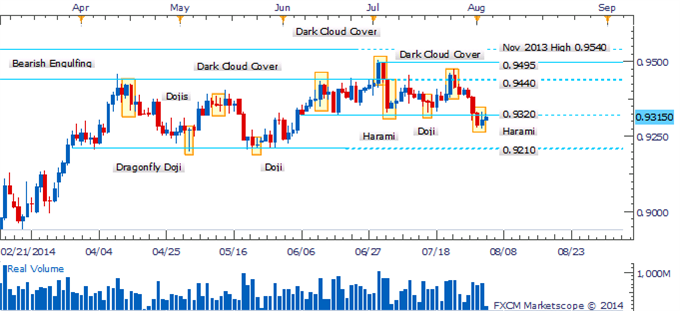
The Australian Dollar may struggle to recover further ground despite the emergence of a Harami pattern on the daily, given sellers remain nearby at 0.9320. A daily close above the critical resistance level would be required to confirm a bullish reversal, which would open the former range-top at 0.9440.
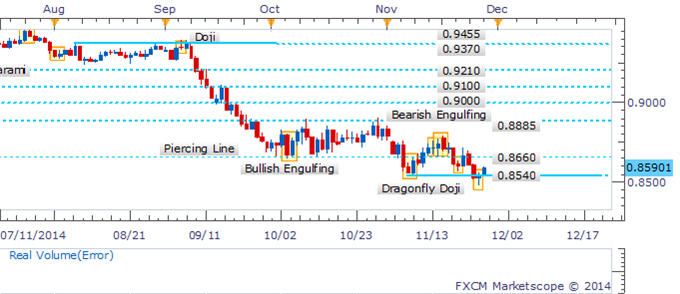
Harami May Find Limited Follow-Through
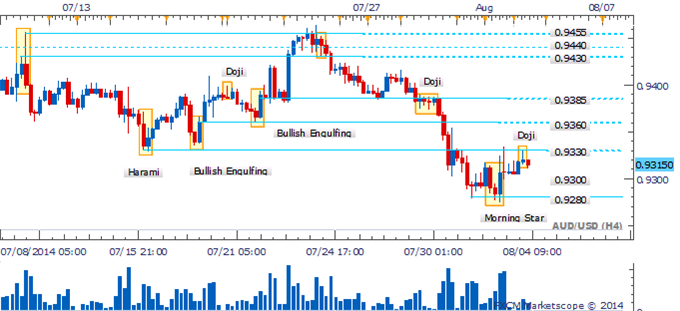
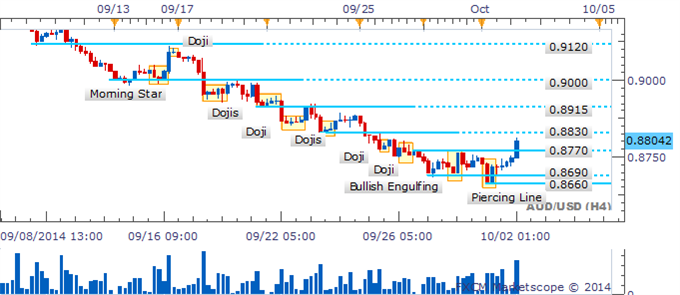
The four hour chart below reveals some hesitation by traders during the Asian session (denoted by a Doji candlestick near 0.9330). However, the pair has yet to see a bearish reversal pattern emerge, which would warn of a correction. This suggests the currency may consolidate over the session ahead.
Bulls Hesistate Near 0.9320/0.9330
By David de Ferranti, Currency Analyst, DailyFX
More...


 Reply With Quote


 4
4


Bookmarks