Page 106 of 166 FirstFirst ... 6 56 96 104 105 106 107 108 116 156 ... LastLast
Results 1,051 to 1,060 of 1654

Wave Analysis by InstaForex

This is a discussion on Wave Analysis by InstaForex within the Analytics and News forums, part of the Trading Forum category; Forex Analysis & Reviews: AUDNZD on bearish momentum! | 12 Nov 2021 Price is on a bearish momentum and abiding ...


  1. #1051
    Senior Member InstaForex Gertrude's Avatar
    Join Date
    Sep 2015
    Posts
    1,885
    Forex Analysis & Reviews: AUDNZD on bearish momentum! | 12 Nov 2021


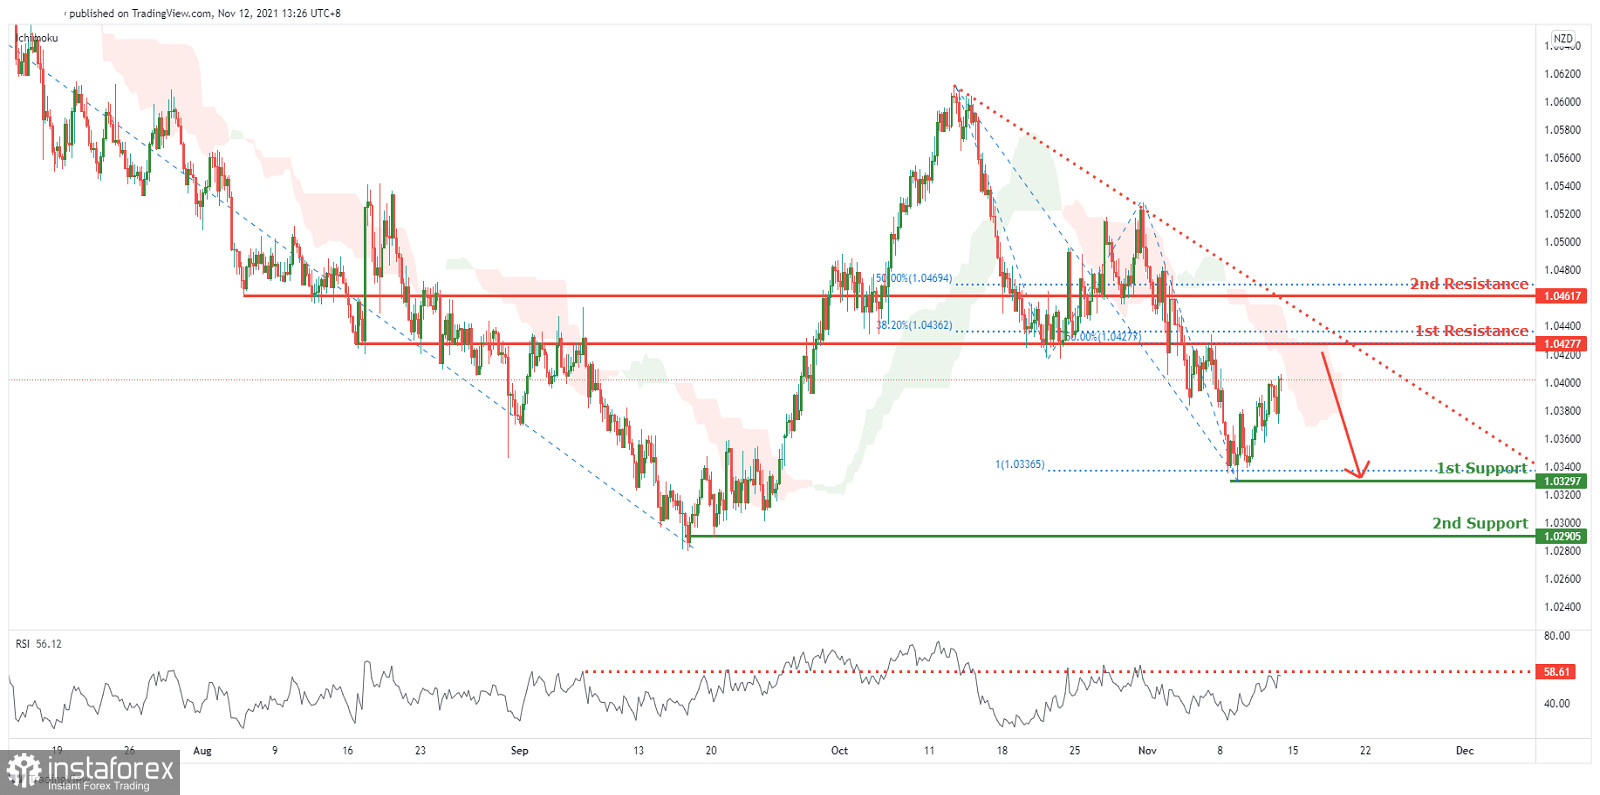
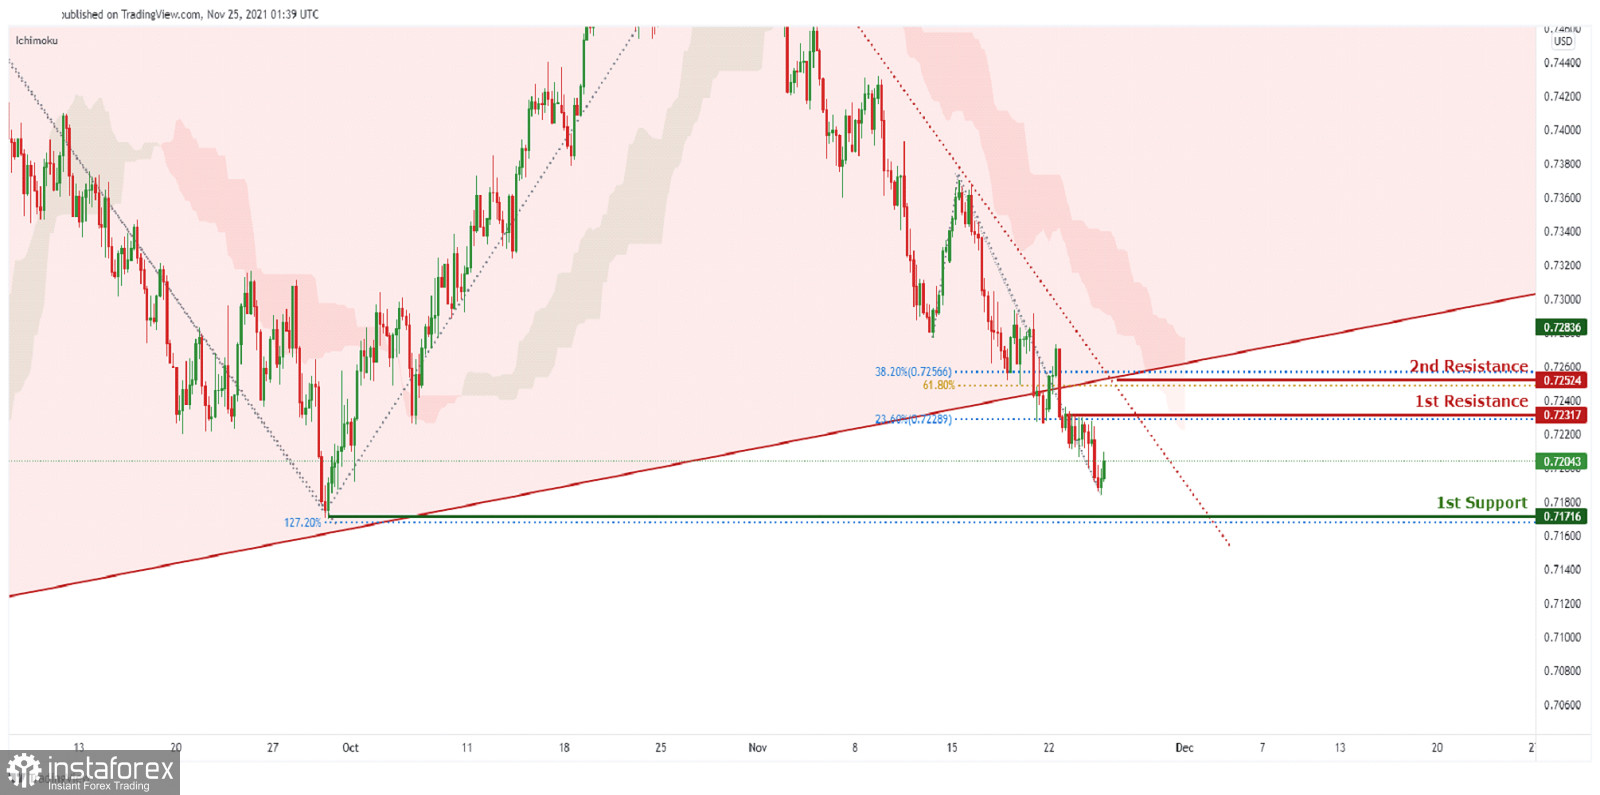
    Price is on a bearish momentum and abiding to our bearish trendline. We see potential for a bounce from our 1st resistance at 1.04277 in line with 50% Fibonacci retracement and 38.2% Fibonacci retracement and graphical overlap towards our 1st support at 1.03297 in line with 100% Fibonacci extension. Alternatively, our stop loss will be placed at 2nd resistance at 1.04617 in line with 50% Fibonacci retracement and graphical overlap. RSI is approaching levels where dips occurred previously and ichimoku is showing bearish momentum.

    Trading Recommendation
    Entry: 1.04277
    Reason for Entry:
    50% Fibonacci retracement and 38.2% Fibonacci retracement and graphical overlap.
    Take Profit: 1.03297
    Reason for Take Profit:
    100% Fibonacci extension.
    Stop Loss: 1.04617
    Reason for Stop Loss:
    50% Fibonacci retracement and graphical overlap.

    Analysis are provided byInstaForex.
    Best regards, PR Manager
    Learn more about InstaForex Company at http://instaforex.com

  2. #1052
    Member
    Join Date
    Sep 2015
    Posts
    94
    Trading plan for GBP/USD on November 15, 2021


    The GBP/USD pair's downward movement last Wednesday still leaves traces. Today, the pound has returned to its low of two weeks ago on November 5. The Weekly Control Zone 1/4 1.3446-1.3438 is set at the same mark.


    These two facts speak about the importance of this zone. If the price fails to consolidate above the level of 1.3446 today and an absorption pattern is formed, then sales will come to the fore again. The first downward target is last week's low. The main medium-term target will be the WCZ 1/2 1.3283-1.3266. This makes it possible to get a favorable risk-to-profit ratio.

    If today closes above the level of 1.3446, then the next target for selling the instrument will be the WCZ 1/2 1.3541-1.3524. They will find the most favorable prices for opening a short position there.


    *The market analysis posted here is meant to increase your awareness, but not to give instructions to make a trade.

  3. #1053
    Senior Member InstaForex Gertrude's Avatar
    Join Date
    Sep 2015
    Posts
    1,885
    Forex Analysis & Reviews: USDCHF bullish momentum! | 16 Nov 2021


    Price is on a bullish momentum and abiding to our bullish trendline. We see potential for a bounce from our 1st support at 0.92193 in line with 23.6% Fibonacci retracement and 61.8% Fibonacci extension and graphical overlap towards our 1st resistance at 0.92647 in line with 61.8% Fibonacci extension and graphical swing high. Alternatively, our stop loss will be placed at 2nd support at 0.91883 in line with bullish trendline and graphical overlap. Technical indicators are showing bullish momentum.

    Trading Recommendation
    Entry: 0.92193
    Reason for Entry:
    23.6% Fibonacci retracement and 61.8% Fibonacci extension and graphical overlap
    Take Profit: 0.92647
    Reason for Take Profit:
    61.8% Fibonacci extension and graphical swing high
    Stop Loss: 0.91883
    Reason for Stop Loss:
    Bullish trendline and graphical overlap

    Analysis are provided byInstaForex.
    Best regards, PR Manager
    Learn more about InstaForex Company at http://instaforex.com

  4. #1054
    Senior Member InstaForex Gertrude's Avatar
    Join Date
    Sep 2015
    Posts
    1,885
    Forex Analysis & Reviews: Technical analysis for EUR/USD pair on November 17, 2021

    The EUR/USD pair's downward impulse, which began this spring, is breaking records. A similar decline was observed in 2018 when the weakening was 10%.

    At present, the decline is already 8.5% from this year's high, which indicates either the huge strength of market sellers or the huge desire of the central bank to see the Euro cheaper. In any case, this should be used in order to look for opportunities to sell this pair. This should not be done at the current levels, but any growth should be considered as a correction and look for patterns to sell the instrument.


    It is worth noting that the pair has gone beyond the average zone for the second week in a row. This indicates that volatility is growing and it will be extremely problematic to deploy such a downward impulse. Therefore, the best solution would be to join sellers at more favorable prices.

    Analysis are provided byInstaForex.
    Best regards, PR Manager
    Learn more about InstaForex Company at http://instaforex.com

  5. #1055
    Senior Member InstaForex Gertrude's Avatar
    Join Date
    Sep 2015
    Posts
    1,885
    Forex Analysis & Reviews: GBPJPY potential for bounce! | 18th Nov 2021


    Price is in a cup pattern and has recently broken out of our ascending trendline. We see potential for a bounce from our 1st support at 153.625 in line with 50% Fibonacci retracement, 23.6% Fibonacci retracement and graphical overlap towards our 1st resistance at 154.356 in line with 50% Fibonacci retracement and graphical overlap. Alternatively, our stop loss will be placed at 2nd support at 153.332 in line with 61.8% Fibonacci retracement and graphical overlap. Technical indicators are showing bullish momentum.

    Trading Recommendation
    Entry: 153.625
    Reason for Entry:
    50% Fibonacci retracement, 23.6% Fibonacci retracement and graphical overlap
    Take Profit: 154.356
    Reason for Take Profit:
    50% Fibonacci retracement and graphical overlap
    Stop Loss: 153.332
    Reason for Stop Loss:
    61.8% Fibonacci retracement and graphical overlap

    Analysis are provided byInstaForex.
    Best regards, PR Manager
    Learn more about InstaForex Company at http://instaforex.com

  6. #1056
    Senior Member InstaForex Gertrude's Avatar
    Join Date
    Sep 2015
    Posts
    1,885
    Forex Analysis & Reviews: AUDUSD potential short term bullish bounce | 19th Nov 2021


    On the H4, we can see that price abiding to the ascending channel on the daily and descending trendline on the H4. We can expect price to make a bounce from 1st Support in line with 78.6% Fibonacci projection, 78.6% Fibonacci retracement and ascending channel support towards the 1st Resistance in line with 61.8% Fibonacci projection and 50% Fibonacci retracement. Our bullish bias is further supported by stochastic indicator where the %K line is at the support level awaiting for a bounce.

    Trading Recommendation
    Entry: 0.72530
    Reason for Entry: 78.6% Fibonacci projection, 78.6% Fibonacci retracement and ascending channel support
    Take Profit: 0.73316
    Reason for Take Profit: 78.6% Fibonacci projection and 23.6% Fibonacci retracement
    Stop Loss: 0.72256
    Reason for Stop Loss:
    100% Fibonacci projection

    Analysis are provided byInstaForex.
    Best regards, PR Manager
    Learn more about InstaForex Company at http://instaforex.com

  7. #1057
    Senior Member InstaForex Gertrude's Avatar
    Join Date
    Sep 2015
    Posts
    1,885
    Forex Analysis & Reviews: USDCAD Bearish Reversal | 22nd Nov 2021


    On the H4, with price reversing off the resistance on the RSI indicator and the a graphical level, we have a bearish bias that price will dip to 1st support at 1.25853 in line with the graphical overlap support and possibly to 2nd support at 1.27074 in line with the graphical overlap support from 1st resistance at 1.26472 in line with the horizontal overlap resistance and 23.6% Fibonacci retracement level. Alternatively, we may see price break 1st resistance structure and head for 2nd resistance at 1.25466 in line with the 50% Fibonacci projection retracement level and horizontal swing high resistance.

    Trading Recommendation
    Entry: 1.26472
    Reason for Entry:
    Horizontal overlap resistance and 23.6% Fibonacci retracement level
    Take Profit: 1.25853
    Reason for Take Profit:
    Graphical overlap support
    Stop Loss: 1.25466
    Reason for Stop Loss:
    50% Fibonacci projection retracement level and horizontal swing high resistance

    Analysis are provided byInstaForex.
    Best regards, PR Manager
    Learn more about InstaForex Company at http://instaforex.com

  8. #1058
    Senior Member InstaForex Gertrude's Avatar
    Join Date
    Sep 2015
    Posts
    1,885
    Forex Analysis & Reviews: Gold reaches 2nd target after bearish signal.

    Gold price has reached the $1,800 area which was our second target after our bearish signal last Friday. As expected by our analysis, Gold started the week under pressure because of the bearish signal we got last Friday.


    Red rectangle- resistance
    Blue rectangle - support

    Gold price is now trading at the 61.8% Fibonacci retracement of the entire rise from $1,758. Our first target was the 38% retracement around $1,830 and our next target was the 61.8% level. Short-term trend remains bearish after the bearish signal on Friday. At 61.8% retracement level we usually see trend reversals. That is why the decline has stopped around this Fibonacci level. Bears need to be cautious as we could see a higher low being formed and price to reverse to the upside. For now no such signal has been given. Price could during the day make a new lower low so bulls need to be very patient and cautious. Next support is at the 78.6% retracement level. Breaking below that level will increase dramatically the chances of falling below $1,758 over the coming days. For now this is not the most probable scenario.

    Analysis are provided byInstaForex.
    Best regards, PR Manager
    Learn more about InstaForex Company at http://instaforex.com

  9. #1059
    Senior Member InstaForex Gertrude's Avatar
    Join Date
    Sep 2015
    Posts
    1,885
    Forex Analysis & Reviews: Trading plan for GBP/USD on November 24, 2021

    The GBP/USD pair has been forming a flat range for the last ten days. Yesterday's update of the monthly low led again to the emergence of demand.

    If today's closing of the day turns out to be higher than yesterday's opening of the day, then the "absorption" pattern on the daily chart will form. This will open the way to buy the instrument. The upward target will be the Weekly Control Zone 1/2 1.3531-1.3514, which coincides with a significant weekly extreme.

    At the moment, the priority is still to trade within the framework of the flat. It should be noted that finding the price at the lower end of the range indicates the opportunity to buy profitably when the corresponding pattern appears.


    Today's daily candle should be similar to the candle of November 12. If this happens, then purchases will come to the fore tomorrow. To continue the pair's decline, it will be necessary to close today below yesterday's low. This will indicate the appearance of new orders to buy the pound at more favorable prices.

    Analysis are provided byInstaForex.
    Best regards, PR Manager
    Learn more about InstaForex Company at http://instaforex.com

  10. #1060
    Senior Member InstaForex Gertrude's Avatar
    Join Date
    Sep 2015
    Posts
    1,885
    Forex Analysis & Reviews: AUDUSD bearish continuation | 25th Nov 2021


    Today's daily candle should be similar to the candle of November 12. If this happens, then purchases will come to the fore tomorrow. To continue the pair's decline, it will be necessary to close today below yesterday's low. This will indicate the appearance of new orders to buy the pound at more favorable prices.

    On the H4, we can see that price broke out of the ascending channel on the daily and abiding to the descending trendline on the H4. We can expect the price to drop from 1st Resistance in line with 23.6% Fibonacci retracement towards the 1st Support in line with 127.2% Fibonacci projection. Our bearish bias is further supported by the Ichimoku cloud indicator where price is holding below it and it is forming a strong resistance level.

    Trading Recommendation
    Entry: 0.72317
    Reason for Entry:
    23.6% Fibonacci retracement
    Take Profit: 0.71716
    Reason for Take Profit:
    127.2% Fibonacci Projection
    Stop Loss: 0.72524
    Reason for Stop Loss:
    61.8% Fibonacci projection and 38.2% Fibonacci retracement

    Analysis are provided byInstaForex.
    Best regards, PR Manager
    Learn more about InstaForex Company at http://instaforex.com

Page 106 of 166 FirstFirst ... 6 56 96 104 105 106 107 108 116 156 ... LastLast

Tags for this Thread

Bookmarks

Posting Permissions

  • You may not post new threads
  • You may not post replies
  • You may not post attachments
  • You may not edit your posts
  •