Page 56 of 180 FirstFirst ... 6 46 54 55 56 57 58 66 106 156 ... LastLast
Results 551 to 560 of 1795

Wave Analysis by InstaForex

This is a discussion on Wave Analysis by InstaForex within the Analytics and News forums, part of the Trading Forum category; Developing USD/CAD pair and trading idea During the previous recommendation on Friday,it is advised to develop the pair at least ...


  1. #551
    Senior Member InstaForex Gertrude's Avatar
    Join Date
    Sep 2015
    Posts
    1,885
    Developing USD/CAD pair and trading idea

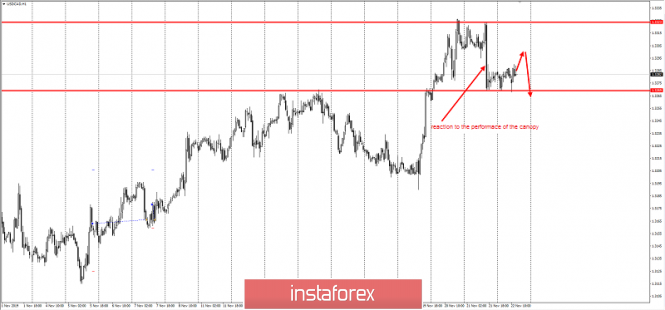
    During the previous recommendation on Friday,it is advised to develop the pair at least on a false breakdown of the level of 1.3269. Actually, this is exactly the outcome we are observing - on the news, this level was falsely broken, and thus, the recommendation completely justified itself. The plan was this:


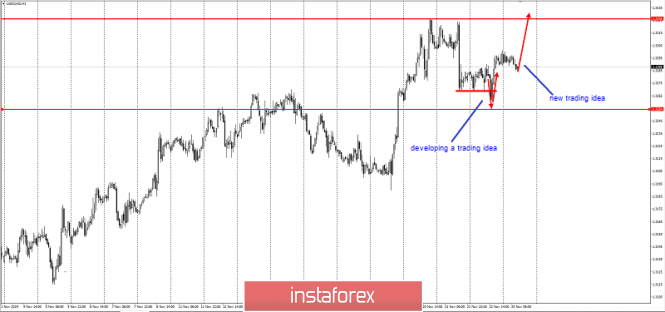
    Thus far, the intrigue of the instrument continues. False news breakdown of this level provides a good opportunity for the development of further medium-term upward trend. Since the end of October, there has been a prolonged upward trend on for this instrument, and the probability of its continuation is still high. For this reason, there is another recommendation for the same instrument today. I believe that the development will continue to a minimum to the level of 1.3326. Therefore, you can try to buy with a goal of updating it, limiting the risks at the price of 1.3254, since it makes no sense to keep purchases below the news last Friday. Updating Friday's minimum - the bullish scenario will be completely canceled.


    Wishing you all success in trading and huge profits!

    Analysis are provided byInstaForex.
    Best regards, PR Manager
    Learn more about InstaForex Company at http://instaforex.com

  2. #552
    Senior Member InstaForex Gertrude's Avatar
    Join Date
    Sep 2015
    Posts
    1,885
    Developing USD/CAD pair and trading idea

    During the previous recommendation on Friday,it is advised to develop the pair at least on a false breakdown of the level of 1.3269. Actually, this is exactly the outcome we are observing - on the news, this level was falsely broken, and thus, the recommendation completely justified itself. The plan was this:


    Thus far, the intrigue of the instrument continues. False news breakdown of this level provides a good opportunity for the development of further medium-term upward trend. Since the end of October, there has been a prolonged upward trend on for this instrument, and the probability of its continuation is still high. For this reason, there is another recommendation for the same instrument today. I believe that the development will continue to a minimum to the level of 1.3326. Therefore, you can try to buy with a goal of updating it, limiting the risks at the price of 1.3254, since it makes no sense to keep purchases below the news last Friday. Updating Friday's minimum - the bullish scenario will be completely canceled.


    Wishing you all success in trading and huge profits!

    Analysis are provided byInstaForex.
    Best regards, PR Manager
    Learn more about InstaForex Company at http://instaforex.com

  3. #553
    Senior Member InstaForex Gertrude's Avatar
    Join Date
    Sep 2015
    Posts
    1,885
    Take profit on AUD/USD pair

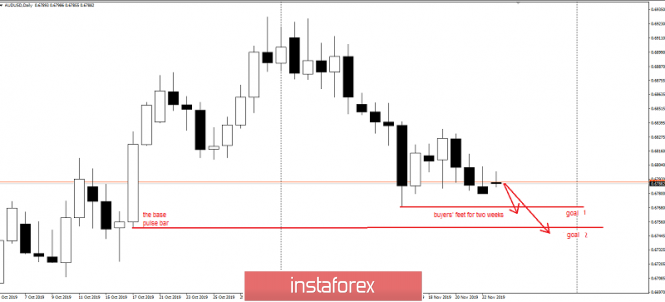
    Good evening, dear traders! Congratulations to those who took advantage of our trading idea for the AUD/USD pair, which was provided last November 25.

    Let me remind you that the idea was to develop the lower daily area in a downward trend:


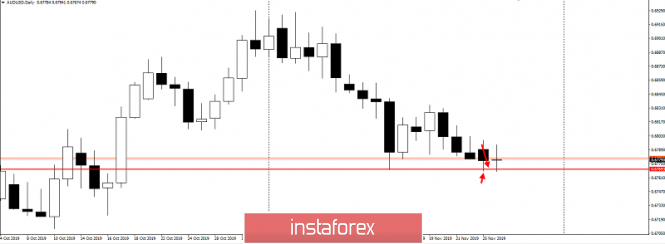
    As you can see, the first goal is taken:


    The collapse did not follow, so I recommend taking profits.

    Good luck in trading and see you tomorrow morning!

    Analysis are provided byInstaForex.
    Best regards, PR Manager
    Learn more about InstaForex Company at http://instaforex.com

  4. #554
    Senior Member InstaForex Gertrude's Avatar
    Join Date
    Sep 2015
    Posts
    1,885
    Forecast for EUR/USD on November 28, 2019

    EUR/USD
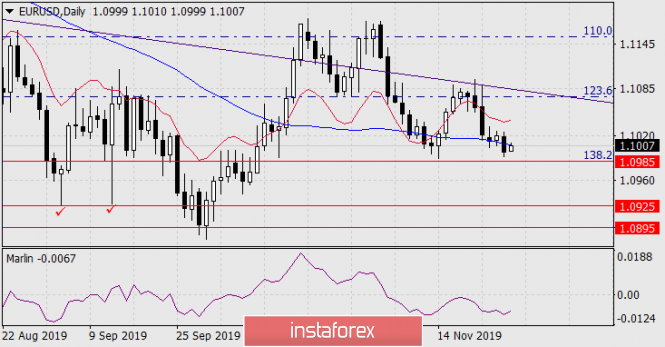
    On Wednesday, US statistics continued to delight investors and markets swayed towards the dollar. The euro lost 22 points. GDP for the third quarter amounted to 2.1% against the expectation of 1.9%, the volume of orders for durable goods increased by 0.6% in October against the forecast of -0.5%,


    On the daily chart, the price went below the MACD indicator line. If today closes with a black candle, then the price will consolidate below it with the prospect of a medium-term decline. The immediate goal of this movement at 1.0925 is the lowest level of September 3 and 12. In the four-week period, the price of 1.0720/30 can be reached - the lower line of the blue price channel (visible on a very tight chart). The Marlin oscillator lies in the horizon in the negative trend zone, volatility is likely to be low in the thin market today.


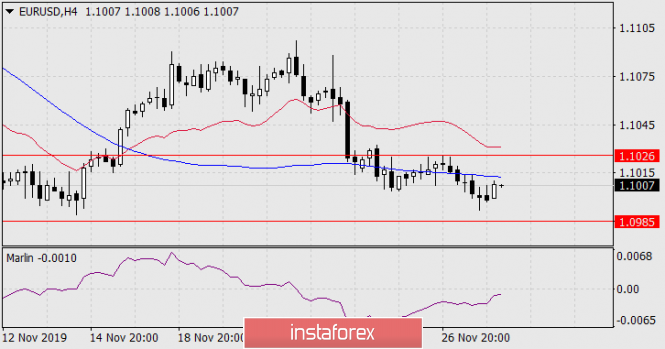
    On a four-hour chart, the price has consolidated under the blue line of MACD. The range between the levels of 1.0985-1.1026 is likely to be today (perhaps even tomorrow) a consolidation zone.

    Analysis are provided byInstaForex.
    Best regards, PR Manager
    Learn more about InstaForex Company at http://instaforex.com

  5. #555
    Senior Member InstaForex Gertrude's Avatar
    Join Date
    Sep 2015
    Posts
    1,885
    Why didn't the oil go upwards? Volume analysis for oil

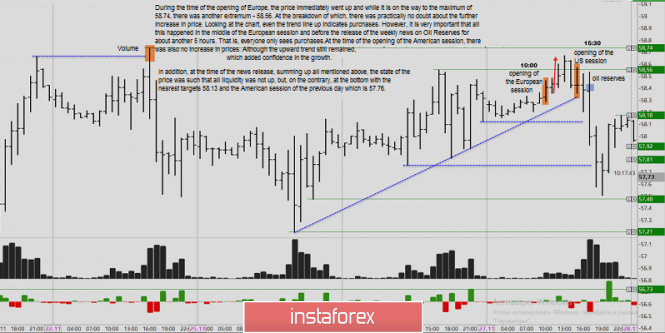
    Good evening, dear traders! Yesterday, we gave a trading idea for the growth of oil but paid attention to the evening news on oil reserves in the United States. Let's analyze this situation on volumes.

    During the time of the opening of Europe, the price immediately went up and while it is on the way to the maximum of 58.74, there was another extremum - 58.56. At the breakdown of which, there was practically no doubt about the further increase in price. Looking at the chart, even the trend line up indicates purchases. However, It is very important that all this happened in the middle of the European session and before the release of the weekly news on Oil Reserves for about another 5 hours. That is, everyone only sees purchases.

    At the time of the opening of the American session, there was also no increase in prices. Although the upward trend still remained, which added confidence in the growth.

    In addition, at the time of the news release, summing up all mentioned above, the state of the price was such that all liquidity was not up, but, on the contrary, at the bottom with the nearest targets 58.13 and the American session of the previous day which is 57.76.


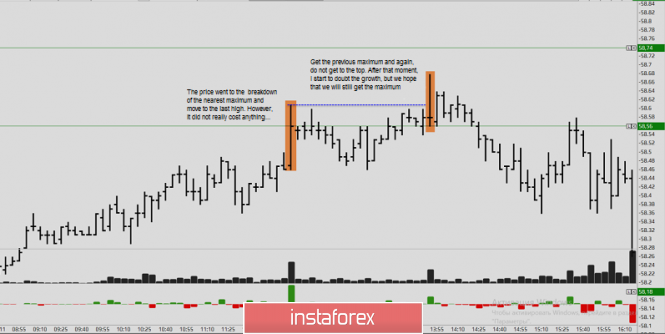
    Oil's approach to the maximum in Europe:


    Thus, the Europeans simply didn't have the courage to collect stocks before the reserves. Nevertheless, the stocks themselves came out large, which led to the sales of black gold.

    This analysis is based on the US oil futures.

    Analysis are provided byInstaForex.
    Best regards, PR Manager
    Learn more about InstaForex Company at http://instaforex.com

  6. #556
    Member
    Join Date
    Sep 2015
    Posts
    94
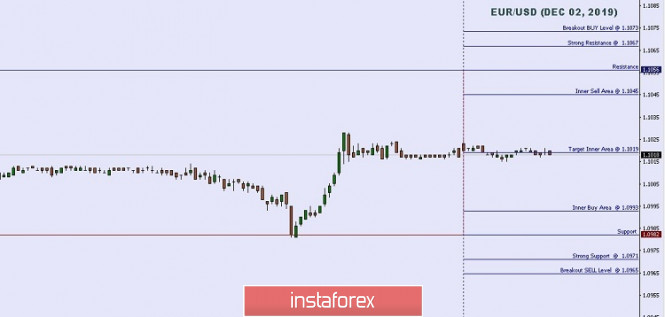
    Important intraday Level For EUR/USD, December 02,2019


    When the European market opens, such economic data as Final Manufacturing PMI, German Final Manufacturing PMI, Italian Manufacturing PMI, French Final Manufacturing PMI, and Spanish Manufacturing PMI will be unveiled. The US will publish such eocnomic reports as ISM Manufacturing Prices, Construction Spending m/m, ISM Manufacturing PMI, and Final Manufacturing PMI.So, amid the reports, EUR/USD will move in a low to medium volatility during this day.

    TODAY'S TECHNICAL LEVEL:

    Breakout BUY Level: 1.1073.

    Strong Resistance: 1.1067.

    Original Resistance: 1.1056.

    Inner Sell Area: 1.1045.

    Target Inner Area: 1.1019.

    Inner Buy Area: 1.0993.

    Original Support: 1.0982.

    Strong Support: 1.0971.

    Breakout SELL Level: 1.0965.


    (Disclaimer) *The market analysis posted here is meant to increase your awareness, but not to give instructions to make a trade.

  7. #557
    Senior Member InstaForex Gertrude's Avatar
    Join Date
    Sep 2015
    Posts
    1,885
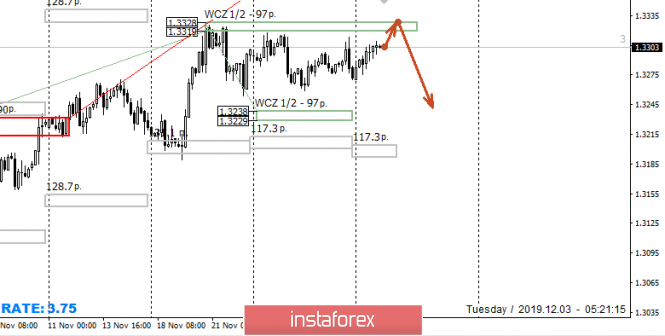
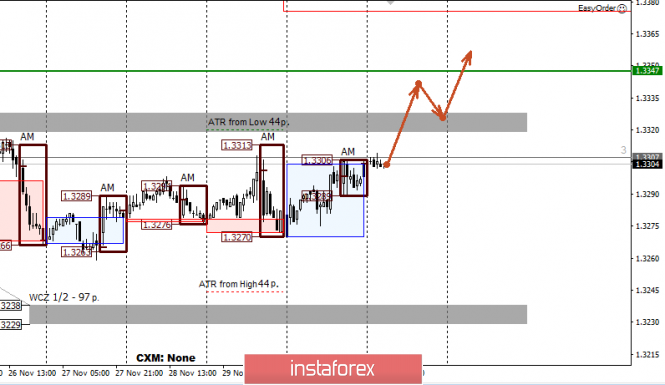
    Control zones for USD/CAD on 12/03/19

    During the second week, the pair is trading within the accumulation zone. This makes it possible to consider weekly extremes for finding entry points. The upper boundary is the maximum of the last week, which coincides with the Weekly Control Zone 1/2 1.3328-1.3319. Now, testing this zone will be decisive for the entire upward movement of the last month.


    Working within the framework of the flat implies partial consolidation of transactions during tests of significant extremes.

    An alternative model will be developed if the closure of today's trading occurs above the Weekly Control Zone 1/2. This will open the way for further growth. The nearest goal, in turn, will be the maximum of October. The test of which will increase the probability of a large offer.


    Daily CZ - daily control zone. The zone formed by important data from the futures market that changes several times a year.

    Weekly CZ - weekly control zone. The zone formed by the important marks of the futures market, which change several times a year.

    Monthly CZ - monthly control zone. The zone that reflects the average volatility over the past year.

    Analysis are provided byInstaForex.
    Best regards, PR Manager
    Learn more about InstaForex Company at http://instaforex.com

  8. #558
    Senior Member InstaForex Gertrude's Avatar
    Join Date
    Sep 2015
    Posts
    1,885
    Oil kings can do everything?

    Oil is slowly recovering from a major sell-off on the last day of autumn. Taking advantage of the thin market after Thanksgiving, speculators decided to get rid of their long positions ahead of the December OPEC+ meeting. The simplest thing that the cartel and Russia can do is to prolong the agreement to reduce production by several months after March 2020. However, how will the market react to this? Isn't it better to avoid a massive sell-off before the results of the meeting are known?

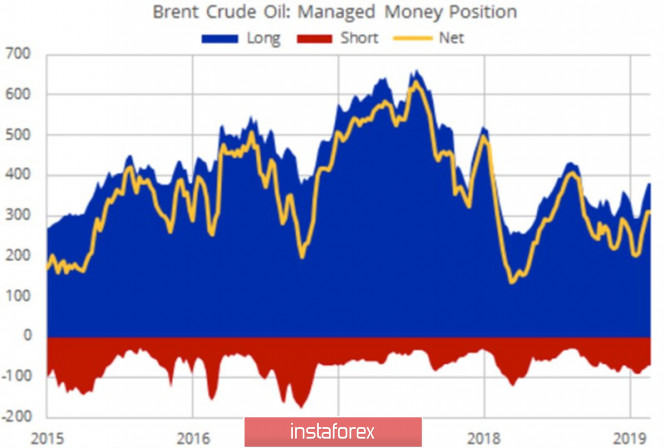
    If speculators sold oil at the November 29 auction, before that, on the contrary, they were actively building up long positions. By the end of the week, November 26, WTI net-longs increased by 15%, gross longs increased by 12%, while shorts fell by 14%. Approximately the same numbers could be seen on Brent.

    Brent Speculative Dynamics


    It is peculiar that black gold was not moving in unison with US stocks at the turn of autumn and winter. The latter were marked by a serious collapse after the White House introduced duties on imports of steel and aluminum from Brazil and Argentina, while oil grew in response to rumors of Saudi Arabia's desire to expand production cuts from 1.2 million bpd to 1.6 million bpd, at least until June 2020. Riyadh needs to carry out an initial public offering of shares in the state-owned company Aramco, the scale of which is estimated at approximately $25 billion. If Brent is listed below $60 per barrel, it is unlikely that buyers will grab paper of the oil company like hotcakes.

    However, according to Goldman Sachs, even if OPEC+ expands its obligations by 400 thousand bpd by the end of June 2020, this is unlikely to lead to a serious increase in prices. The bank predicts that North Sea-grade quotes will dangle around $60 per barrel for most of next year.

    Oil support is provided by the first growth above the critical level of 50 in business activity in China's manufacturing sector since April. China is the largest consumer of black gold in the world, and an increase in demand of 64 thousand bpd in the third quarter is good news for Brent bulls and WTI. Moreover, the IEA predicts that the figure will reach a record high of 13.6 million bpd in 2020. I have no doubt that this will be so if the trade war between Washington and Beijing does not become history. Otherwise, weak global demand will continue to put downward pressure on black gold prices.

    At the same time, the growth of shale production in the United States significantly affects the market balance. In September, the United States closed a full month as a net exporter of black gold for the first time since 1940. Its deliveries abroad exceeded imports by 89 thousand bpd. It is Interesting that the last time the value of net imports exceeded 12 million was ten years ago.

    Technically, without leaving Brent quotes beyond the downward trading channel, the implementation of the Double Bottom pattern can be forgotten. On the contrary, a breakthrough of support at $56 per barrel, which corresponds to the lower boundary of the triangle, the risks of a downward trend recovery will increase.

    Analysis are provided byInstaForex.
    Best regards, PR Manager
    Learn more about InstaForex Company at http://instaforex.com

  9. #559
    Senior Member InstaForex Gertrude's Avatar
    Join Date
    Sep 2015
    Posts
    1,885
    Oil kings can do everything?

    Oil is slowly recovering from a major sell-off on the last day of autumn. Taking advantage of the thin market after Thanksgiving, speculators decided to get rid of their long positions ahead of the December OPEC+ meeting. The simplest thing that the cartel and Russia can do is to prolong the agreement to reduce production by several months after March 2020. However, how will the market react to this? Isn't it better to avoid a massive sell-off before the results of the meeting are known?

    If speculators sold oil at the November 29 auction, before that, on the contrary, they were actively building up long positions. By the end of the week, November 26, WTI net-longs increased by 15%, gross longs increased by 12%, while shorts fell by 14%. Approximately the same numbers could be seen on Brent.

    Brent Speculative Dynamics


    It is peculiar that black gold was not moving in unison with US stocks at the turn of autumn and winter. The latter were marked by a serious collapse after the White House introduced duties on imports of steel and aluminum from Brazil and Argentina, while oil grew in response to rumors of Saudi Arabia's desire to expand production cuts from 1.2 million bpd to 1.6 million bpd, at least until June 2020. Riyadh needs to carry out an initial public offering of shares in the state-owned company Aramco, the scale of which is estimated at approximately $25 billion. If Brent is listed below $60 per barrel, it is unlikely that buyers will grab paper of the oil company like hotcakes.

    However, according to Goldman Sachs, even if OPEC+ expands its obligations by 400 thousand bpd by the end of June 2020, this is unlikely to lead to a serious increase in prices. The bank predicts that North Sea-grade quotes will dangle around $60 per barrel for most of next year.

    Oil support is provided by the first growth above the critical level of 50 in business activity in China's manufacturing sector since April. China is the largest consumer of black gold in the world, and an increase in demand of 64 thousand bpd in the third quarter is good news for Brent bulls and WTI. Moreover, the IEA predicts that the figure will reach a record high of 13.6 million bpd in 2020. I have no doubt that this will be so if the trade war between Washington and Beijing does not become history. Otherwise, weak global demand will continue to put downward pressure on black gold prices.

    At the same time, the growth of shale production in the United States significantly affects the market balance. In September, the United States closed a full month as a net exporter of black gold for the first time since 1940. Its deliveries abroad exceeded imports by 89 thousand bpd. It is Interesting that the last time the value of net imports exceeded 12 million was ten years ago.

    Technically, without leaving Brent quotes beyond the downward trading channel, the implementation of the Double Bottom pattern can be forgotten. On the contrary, a breakthrough of support at $56 per barrel, which corresponds to the lower boundary of the triangle, the risks of a downward trend recovery will increase.

    Analysis are provided byInstaForex.
    Best regards, PR Manager
    Learn more about InstaForex Company at http://instaforex.com

  10. #560
    Senior Member InstaForex Gertrude's Avatar
    Join Date
    Sep 2015
    Posts
    1,885
    Forecast for USD/JPY on December 5, 2019

    USD/JPY

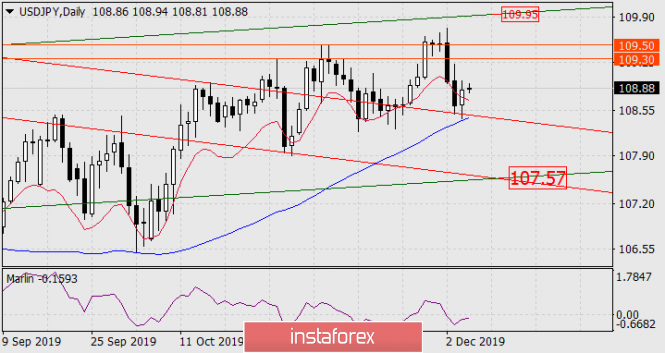
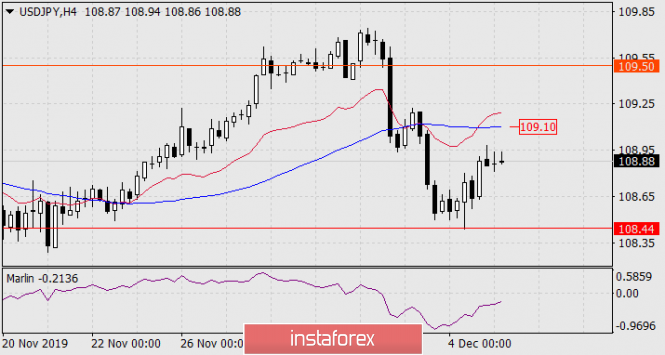
    The information received yesterday from the headquarters of the US and Chinese negotiators on trade encouraged the markets - representatives of the parties allowed the conclusion of the first phase of the deal until December 15, before the date of the introduction of tariffs on Chinese goods. The US S&P 500 index gained 0.63%, Nikkei 225 is currently up 0.70% and China A50 grew 0.36%. The price turned from the achieved first bearish goal - from the enclosed line of the price channel, a little short of the MACD line. The signal line of the Marlin oscillator is still in the negative trend zone, growth could continue, but still within the correction.


    The correction can continue to the range of 109.30/50 (highs of October 30 and November 7), going over the range will mean the correction will go into a trend growth, the target will be the line of the green price channel in the region of 109.95. Leaving prices at yesterday's low opens the next bearish target at 107.57 - the intersection of the lines of the red and green price channels.


    *The market analysis posted here is meant to increase your awareness, but not to give instructions to make a trade.

    Analysis are provided byInstaForex.
    Best regards, PR Manager
    Learn more about InstaForex Company at http://instaforex.com

Page 56 of 180 FirstFirst ... 6 46 54 55 56 57 58 66 106 156 ... LastLast

Tags for this Thread

Bookmarks

Posting Permissions

  • You may not post new threads
  • You may not post replies
  • You may not post attachments
  • You may not edit your posts
  •