
 3Likes
 LinkBack URL
 About LinkBacks


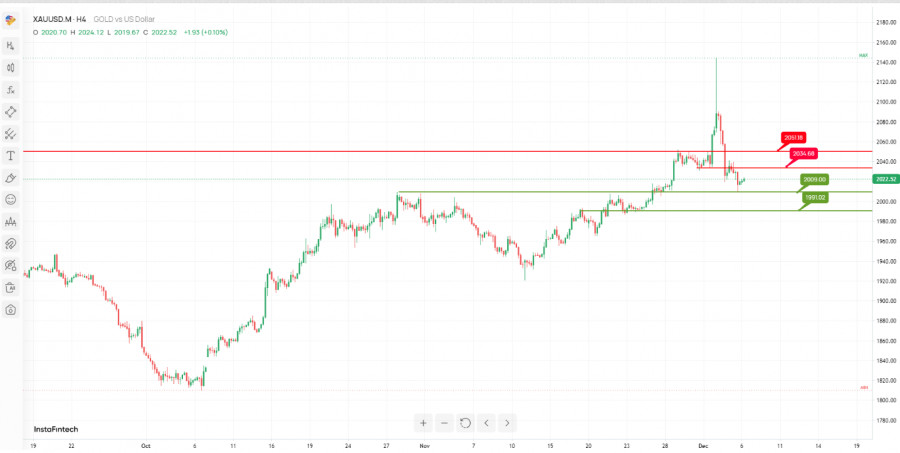
XAU/USD H4 I Bullish Bounce?
The XAU/USD chart suggests the potential for a bullish bounce, with significant support and resistance levels at play.
Support Levels:
At 2009.00, the 1st support is characterized as "An Overlap support." This level signifies a potential area where buying interest may emerge, potentially facilitating a bounce. Similarly, the 2nd support at 1991.00 is also identified as "An Overlap support," reinforcing its potential significance in providing support to the price.
Resistance Levels:
On the resistance side, the 1st resistance level at 2034.68 is labeled as "An Overlap resistance." This level represents a notable barrier to further upward price movement and warrants attention from traders. Additionally, the 2nd resistance at 2051.18 is characterized by "Pullback resistance," further emphasizing its role as a significant resistance zone.
Analysis are provided by InstaForex.
Read More


 Reply With Quote


Bookmarks