
 3Likes
 LinkBack URL
 About LinkBacks


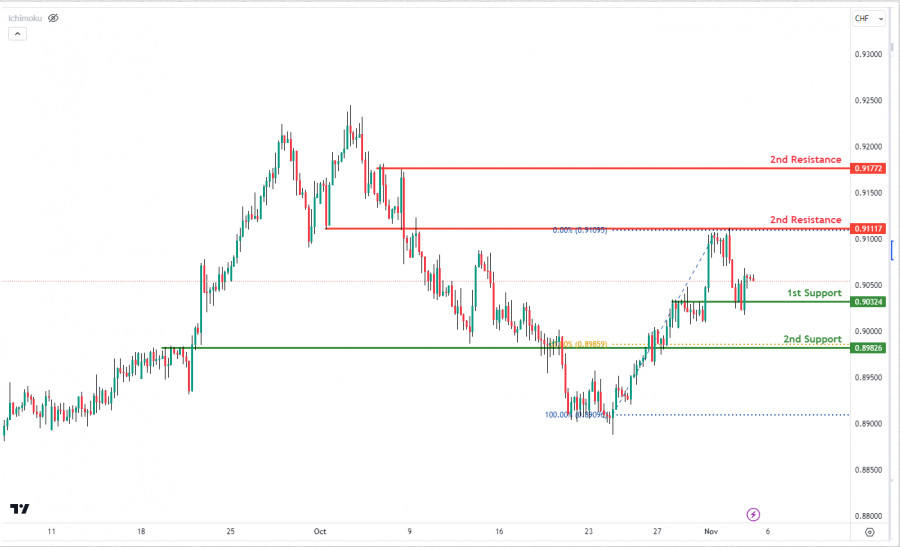
USDCHF H4 I Falling to Support level?
The USD/CHF chart shows bearish momentum with potential movement towards the 1st support at 0.9032, a pullback support strengthened by the 61.80% Fibonacci Retracement. The 2nd support at 0.8982, considered an overlap support, adds to its significance as a potential buying area.
On the resistance side, the 1st resistance at 0.9111, an overlap resistance, might attract selling interest. The 2nd resistance at 0.9177, a multi-swing high resistance, could strongly impede upward movement. Traders should closely watch these levels, given the overall bearish chart bias.
Analysis are provided by InstaForex.
Read More


 Reply With Quote


Bookmarks