Page 154 of 166 FirstFirst ... 54 104 144 152 153 154 155 156 164 ... LastLast
Results 1,531 to 1,540 of 1654

Wave Analysis by InstaForex

This is a discussion on Wave Analysis by InstaForex within the Analytics and News forums, part of the Trading Forum category; Forecast for EUR/USD on October 19, 2023 EUR/USD Yesterday, the euro lacked the courage to initiate consolidation ahead of the ...


  1. #1531
    Senior Member InstaForex Gertrude's Avatar
    Join Date
    Sep 2015
    Posts
    1,885
    Forecast for EUR/USD on October 19, 2023

    EUR/USD
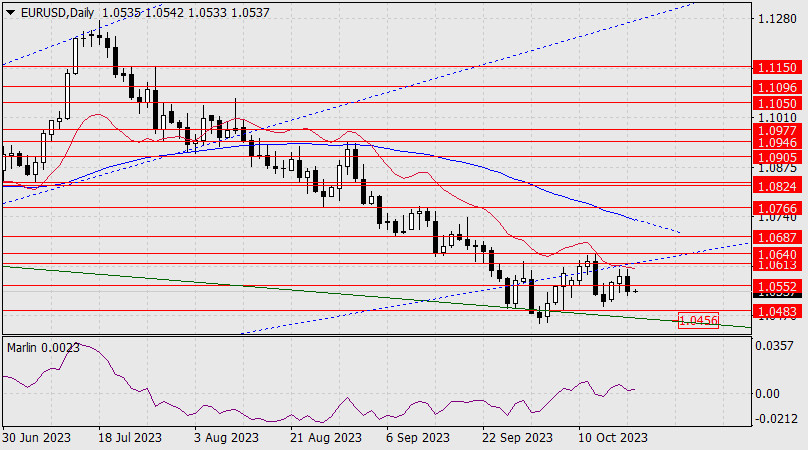
    Yesterday, the euro lacked the courage to initiate consolidation ahead of the strong resistance level at 1.0613. The price retreated from the daily balance indicator line and dropped below the support level at 1.0552. However, the Marlin oscillator managed to stay in the positive territory. Therefore, consolidation to attack the Fibonacci ray at 1.0613 may form above 1.0552.


    The reason for this could be today's US data; weekly jobless claims are expected to increase from 209,000 to 212,000, and existing home sales for September could decrease from 4.04 million to 3.89 million.

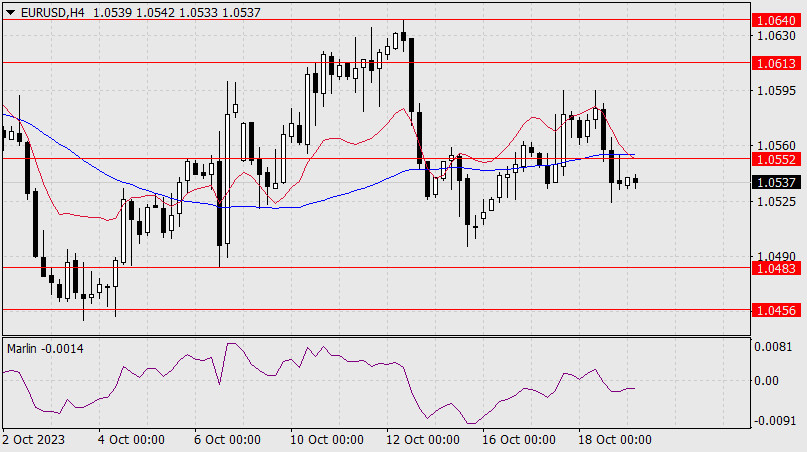
    On the 4-hour chart, the price is now below the level of 1.0552 and below the balance and MACD indicator lines. The Marlin oscillator has entered the downtrend territory.


    The situation appears bearish, but the general trend may lift the quote above the MACD line, where strategic consolidation will take place. If the price stays below yesterday's low at 1.0524, it could push the euro towards the support level at 1.0483. Below this we can find the price channel line at 1.0456.

    Analysis are provided by InstaForex.

    Read More
    Best regards, PR Manager
    Learn more about InstaForex Company at http://instaforex.com

  2. #1532
    Senior Member InstaForex Gertrude's Avatar
    Join Date
    Sep 2015
    Posts
    1,885
    Forecast for AUD/USD on October 20, 2023

    AUD/USD

    The Australian dollar continues to consolidate within the 0.6295-0.6388 range, and this consolidation is increasing the bearish potential every day as the Marlin oscillator's signal line tilts downward in a triangle.


    Consolidating below the level of 0.6295 means that the next target will be 0.6171. To initiate an upward movement, the price should rise above the MACD line around 0.6426. The first target will be 0.6514, followed by 0.6612.


    A downtrend on the 4-hour chart, and there's a low chance of a reversal. The first sign of a reversal would be the price surpassing the previous day's high of 0.6359, which would automatically lead to breaching the MACD line. We await further developments.

    Analysis are provided by InstaForex.

    Read More
    Best regards, PR Manager
    Learn more about InstaForex Company at http://instaforex.com

  3. #1533
    Senior Member InstaForex Gertrude's Avatar
    Join Date
    Sep 2015
    Posts
    1,885
    Analysis of Gold for October 23, 2023 - Rejection of the support zone


    Technical analysis:

    Gold has been trading upside this morning and I found rejection of the support zone at $1.961 and there is the chance for the higher prices.

    As long as the support zone around $1.957 can hold, higher prices might be in the play and the test of $1.997. The short-term trend is still to the upside.

    In case of the downside breakout of the support at $1.1957, there is the chance for the downside movement towards lower reference at $1.937

    Analysis are provided by InstaForex.

    Read More
    Best regards, PR Manager
    Learn more about InstaForex Company at http://instaforex.com

  4. #1534
    Senior Member InstaForex Gertrude's Avatar
    Join Date
    Sep 2015
    Posts
    1,885
    XAUUSD H4 I Reacting off Resistance?


    The XAU/USD chart currently shows bearish momentum, suggesting potential further decline towards the 1st support at 1947.23, which aligns with an overlap support. The 2nd support at 1931.57 adds to this bearish outlook as a pullback support.

    On the resistance side, the 1st resistance at 1984.47 has historically acted as a strong barrier to upward movement, and the 2nd resistance at 2003.60 could provide additional resistance. An intermediate support level at 1963.24 might offer a temporary pause in the bearish trend

    Analysis are provided by InstaForex.

    Read More
    Best regards, PR Manager
    Learn more about InstaForex Company at http://instaforex.com

  5. #1535
    Senior Member InstaForex Gertrude's Avatar
    Join Date
    Sep 2015
    Posts
    1,885
    GBPUSD H4 | Bearish Continuation Expected?


    The GBP/USD chart currently shows bearish momentum with potential for a bearish continuation towards the 1st support at 1.2106, which aligns with a multi-swing low support. The 2nd support at 1.2049, also a multi-swing low support, adds to its significance as it coincides with the 127.20% Fibonacci Extension level. On the resistance side, the 1st resistance at 1.2270 is characterized as an overlap resistance, while the 2nd resistance at 1.2340 is marked as a swing high resistance.

    Analysis are provided by InstaForex.

    Read More
    Best regards, PR Manager
    Learn more about InstaForex Company at http://instaforex.com

  6. #1536
    Senior Member InstaForex Gertrude's Avatar
    Join Date
    Sep 2015
    Posts
    1,885
    USDCAD H4 I Heading into resistance?


    The USD/CAD chart currently displays bullish overall momentum, with the potential scenario of a bullish continuation towards the 1st resistance level.

    The 1st resistance level at 1.3848 is identified as a swing-high resistance that aligns with the 127.20% Fibonacci extension level. Higher up, the 2nd resistance level at 1.3919 is marked as a resistance level that aligns with the 161.80% Fibonacci extension level.

    To the downside, the 1st support level at 1.3786 is identified as a pullback support. Further below, the 2nd support level at 1.3736 is noted as an overlap support, potentially acting as a strong support zone.

    Analysis are provided by InstaForex.

    Read More
    Best regards, PR Manager
    Learn more about InstaForex Company at http://instaforex.com

  7. #1537
    Senior Member InstaForex Gertrude's Avatar
    Join Date
    Sep 2015
    Posts
    1,885
    Elliott wave analysis of EUR/USD for October 27, 2023


    After a minor correction from 1.0695, EUR/USD is ready for the next push higher towards at least 1.0805 and most likely above here too. In the long term, we are looking for EUR/USD to move towards 1.2085 as the next major upside target as wave 3 gathers strength.

    Support remains seen near 1.0521 for the next push above 1.0695.

    Analysis are provided by InstaForex.

    Read More
    Best regards, PR Manager
    Learn more about InstaForex Company at http://instaforex.com

  8. #1538
    Senior Member InstaForex Gertrude's Avatar
    Join Date
    Sep 2015
    Posts
    1,885
    USDJPY Day I Reacting off resistance level?


    USD/JPY displays bearish momentum, potentially heading towards the 1st support at 144.94, which aligns with overlap support. On the resistance front, the 1st resistance at 150.30, marked as a multi-swing high resistance, may hinder further upward movement. A 2nd resistance at 152.72, coinciding with the 100% Fibonacci Projection, adds to its potential as a significant resistance zone.

    Analysis are provided by InstaForex.

    Read More
    Best regards, PR Manager
    Learn more about InstaForex Company at http://instaforex.com

  9. #1539
    Senior Member InstaForex Gertrude's Avatar
    Join Date
    Sep 2015
    Posts
    1,885
    Forecast for GBP/USD on November 1, 2023

    GBP/USD Yesterday, the British pound tried to move towards the target range of 1.2271/87 but stopped by the balance line on the daily chart, just as it was on October 24th. Afterwards, the price returned below the descending price channel line. The signal line of the Marlin oscillator came close to the border of the bearish territory.


    In case the Federal Reserve shows a softer stance, the price may reach some bullish targets (1.2271/87, 1.2400). However, the current situation lowers the chances of growth, which warns the speculative nature of the moment. If the price settles below 1.2070, it will likely fall towards 1.1880.


    On the 4-hour chart, the price has settled below the balance and MACD indicator lines after a false bullish breakout. The Marlin oscillator has also returned to the bearish territory. As a result of the FOMC meeting, the pound may weaken.

    Analysis are provided by InstaForex.

    Read More
    Best regards, PR Manager
    Learn more about InstaForex Company at http://instaforex.com

  10. #1540
    Senior Member InstaForex Gertrude's Avatar
    Join Date
    Sep 2015
    Posts
    1,885
    XAUUSD H4 | Neutral Momentum?


    The XAU/USD chart currently shows a neutral overall momentum, indicating a lack of a strong directional trend. In this scenario, the price is expected to fluctuate between the 1st support at 1974.67 (overlap support) and the 1st resistance at 1992.18 (overlap resistance). These levels are significant, with the support potentially attracting buyers at 1974.67 and the resistance posing a hurdle for further price gains. The 2nd support at 1962.70 (overlap support) and the 2nd resistance at 2006.11 (multi-swing high resistance) further reinforce these potential support and resistance zones.

    Analysis are provided by InstaForex.

    Read More
    Best regards, PR Manager
    Learn more about InstaForex Company at http://instaforex.com

Page 154 of 166 FirstFirst ... 54 104 144 152 153 154 155 156 164 ... LastLast

Tags for this Thread

Bookmarks

Posting Permissions

  • You may not post new threads
  • You may not post replies
  • You may not post attachments
  • You may not edit your posts
  •