
 1Likes
 LinkBack URL
 About LinkBacks


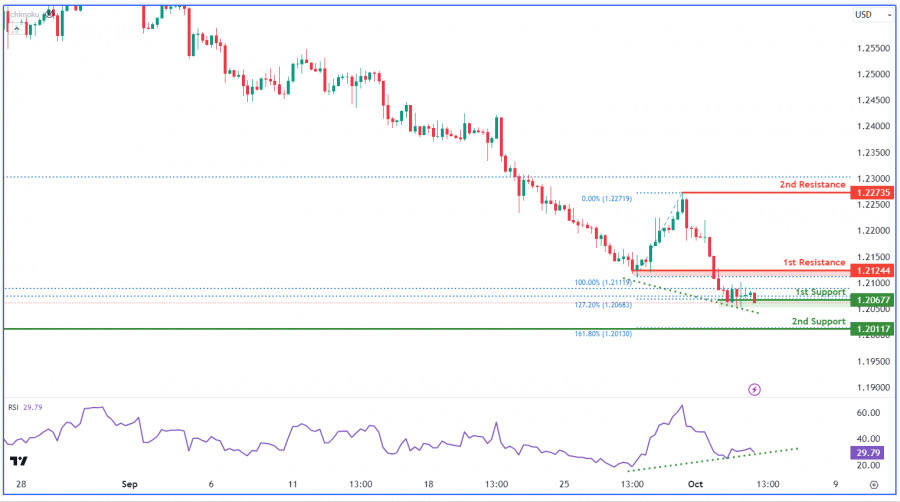
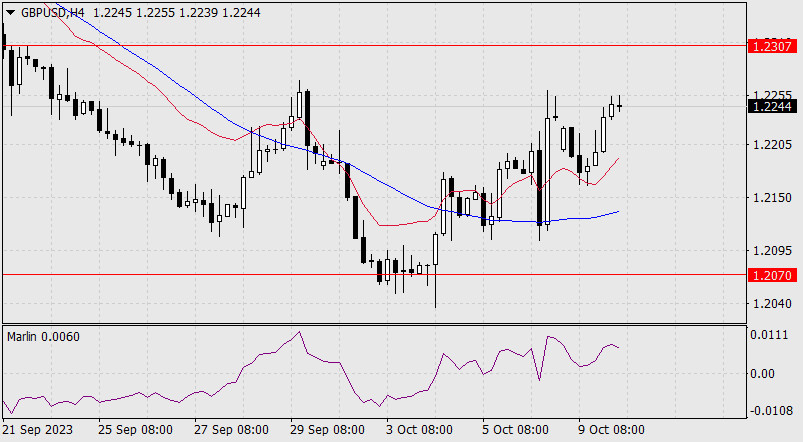
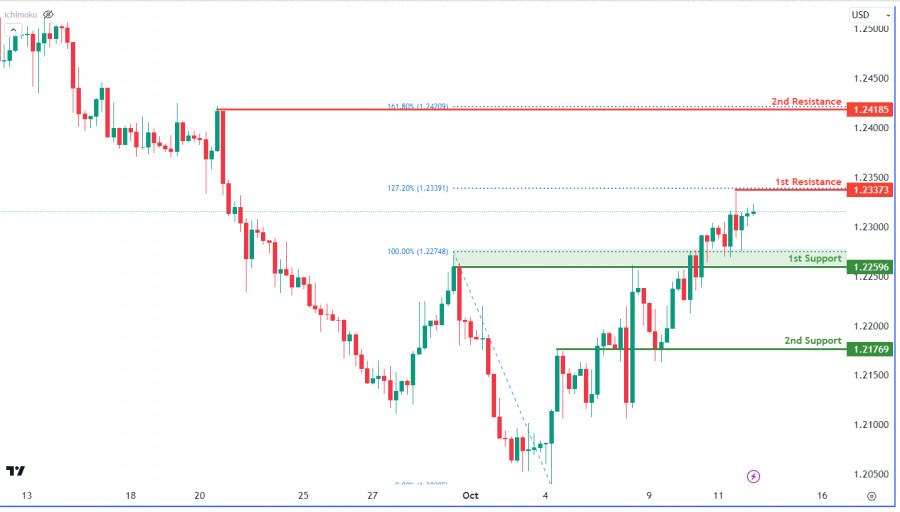
GBPUSD H4 | Bullish Divergence?
The GBP/USD chart shows bullish momentum, with the possibility of a bullish bounce from the first support at 1.2067, backed by the 127.20% Fibonacci Extension, indicating a reversal point. The second support at 1.2011, aligning with the 161.80% Fibonacci Extension, adds to its importance as a potential support level.
On the resistance side, the first resistance at 1.2124 is noted as an overlap resistance, potentially hindering bullish movements. The second resistance at 1.2273 is labeled as a swing high resistance
Analysis are provided by InstaForex.
Read More


 Reply With Quote


Bookmarks