Page 151 of 180 FirstFirst ... 51 101 141 149 150 151 152 153 161 ... LastLast
Results 1,501 to 1,510 of 1795

Wave Analysis by InstaForex

This is a discussion on Wave Analysis by InstaForex within the Analytics and News forums, part of the Trading Forum category; Forecast for GBP/USD on September 1, 2023 GBP/USD As a result of yesterday, the pound fell by 46 points, returning ...


  1. #1501
    Senior Member InstaForex Gertrude's Avatar
    Join Date
    Sep 2015
    Posts
    1,885
    Forecast for GBP/USD on September 1, 2023

    GBP/USD
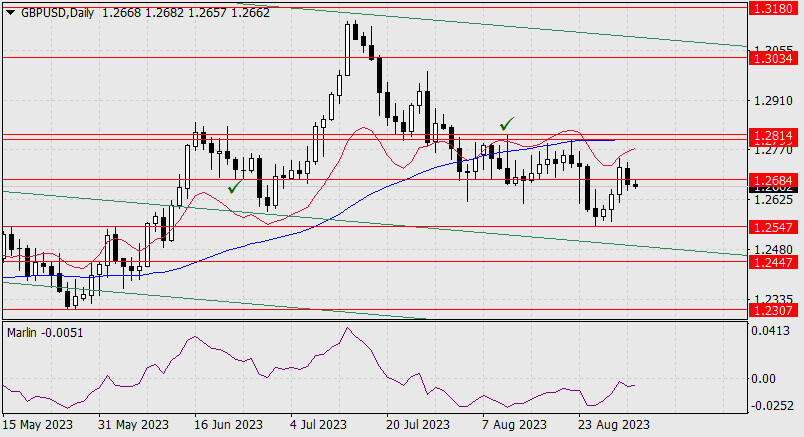
    As a result of yesterday, the pound fell by 46 points, returning below the 1.2684 level. The signal line of the Marlin oscillator on the daily chart isn't in a hurry to move downwards; on the contrary, it indicates an intent to rise above the zero line.


    If the pound realizes this intention, then the pair could rise in the target range of 1.2799-1.2814. Traders across markets are eagerly awaiting today's US employment data for August. If they turn out to be strong, the pound might head towards 1.2547.


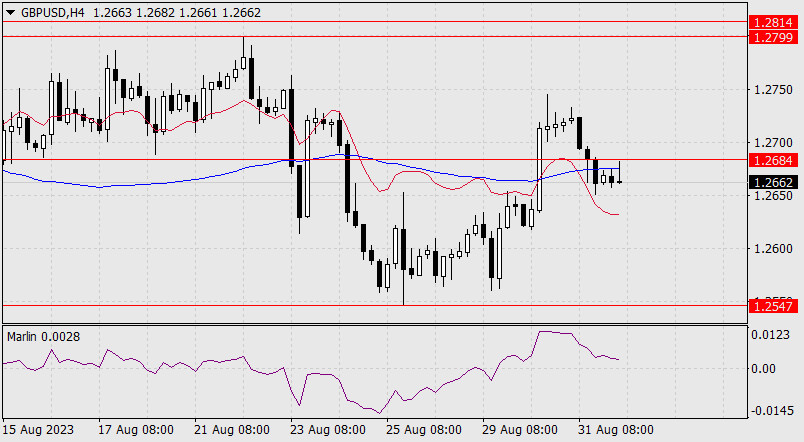
    On the four-hour chart, the price consolidated below the MACD indicator line, with the Marlin oscillator in a waiting position in the uptrend territory. While waiting for the US data, the price might rise above 1.2684, which would significantly improve the bulls' positions.

    Analysis are provided by InstaForex.

    Read More
    Best regards, PR Manager
    Learn more about InstaForex Company at http://instaforex.com

  2. #1502
    Senior Member InstaForex Gertrude's Avatar
    Join Date
    Sep 2015
    Posts
    1,885
    Forecast for EUR/USD on September 4, 2023

    EUR/USD
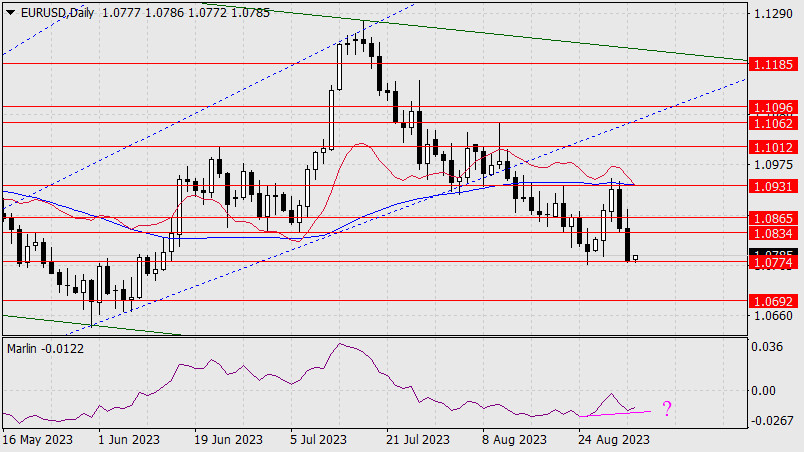
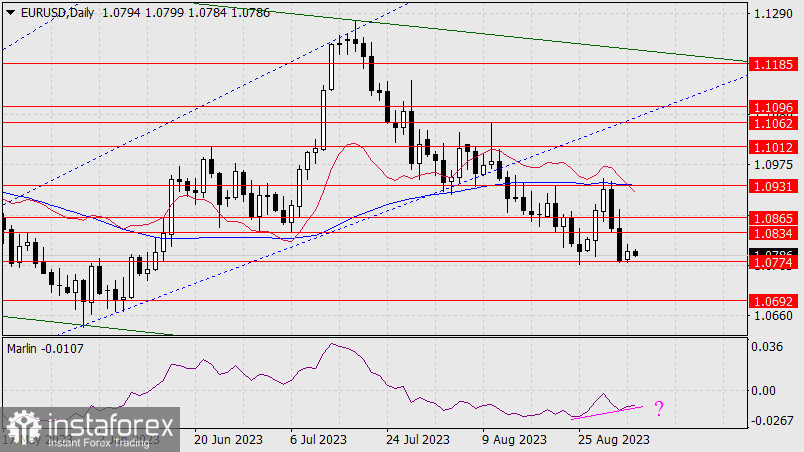
    The short-term battle of speculators with the release of US employment data ended in favor of the dollar bulls. The dollar index rose by 0.58%, US government bond yields increased (from 4.25% to 4.30% for 5-year bonds), and stock markets closed mixed. The euro lost 66 pips, reaching the target support at 1.0774. Is this a signal or condition for a medium-term decline? At the very least, we need to wait for the price to settle below 1.0774. Next, we need to confirm a confident reversal of the S&P 500. In other words, the initial conditions can only emerge tomorrow. If this doesn't happen, the euro may rise again, attempting to surpass 1.0931 (MACD line).


    We currently have a downtrend on the daily chart, so the nearest target is the level of 1.0692. Overcoming this target could result in the pair aiming for the 1.0483-1.0552 range, which includes the descending price channel line and the Fibonacci retracement level.

    There is also potential for a bullish scenario, indicated by the emerging convergence between price and the Marlin oscillator.

    If the pound realizes this intention, then the pair could rise in the target range of 1.2799-1.2814. Traders across markets are eagerly awaiting today's US employment data for August. If they turn out to be strong, the pound might head towards 1.2547.


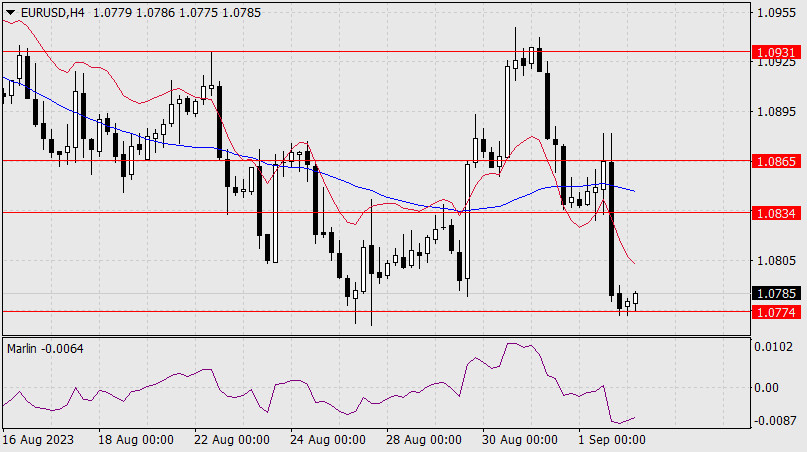
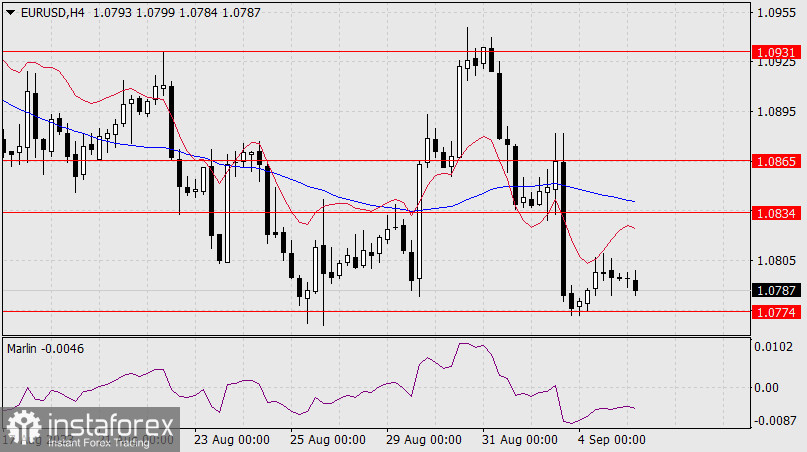
    On the four-hour chart, the price has paused at the target support of 1.0774. Consolidating below this level will allow the price to reach the target at 1.0692, but the euro can only reach this level if the stock market remains weak.

    Analysis are provided by InstaForex.

    Read More
    Best regards, PR Manager
    Learn more about InstaForex Company at http://instaforex.com

  3. #1503
    Senior Member InstaForex Gertrude's Avatar
    Join Date
    Sep 2015
    Posts
    1,885
    Forex Analysis & Reviews: Forecast for EUR/USD on September 5, 2023

    EUR/USD Yesterday, the euro gained 19 pips despite a relatively muted day. From a technical perspective, the situation has not changed. A close below 1.0774 would pave the way for the bears to reach 1.0692. However, there is a nuance here – it could break the support or a false consolidation to create a distinct convergence with the oscillator rather than leaving it weak as we see it now. On the other hand, it could gradually rise towards the nearest resistance level at 1.0834, then 1.0865, and ultimately 1.0931.


    On the 4-hour chart, we have a neutral situation because the price is moving sideways within the 1.0774-1.0834 range. The Marlin oscillator is also moving sideways, and the price is below both indicator lines, and there is no clear direction.


    There are no clues on the external side. In the euro area, the composite PMI index for August is expected to fall from 48.6 to 47.0. In the United States, factory orders for July are expected to drop by 2.5%. We await further developments.

    Analysis are provided by InstaForex.

    Read More
    Best regards, PR Manager
    Learn more about InstaForex Company at http://instaforex.com

  4. #1504
    Senior Member InstaForex Gertrude's Avatar
    Join Date
    Sep 2015
    Posts
    1,885
    Forecast for GBP/USD on September 7, 2023

    GBP/USD
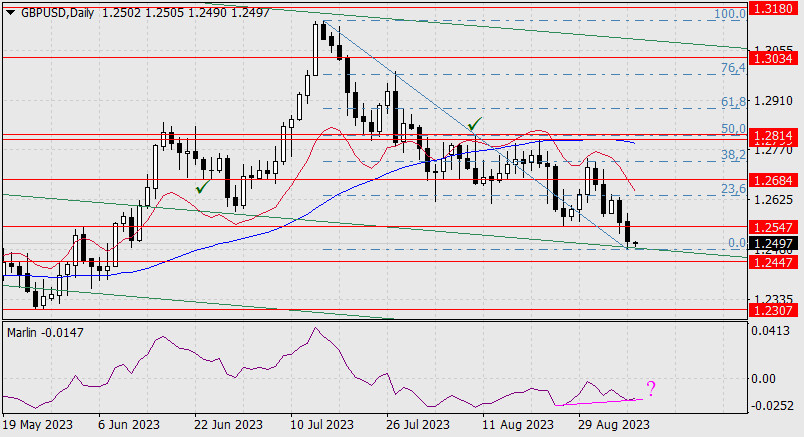
    The pound has reached an important support level from the embedded line of the global descending price channel. The brewing convergence with the Marlin oscillator on the daily chart warns of a price reversal which indicates a deep correction, possibly towards the range of 1.2799-1.2814, i.e. to the MACD indicator line.


    According to the Fibonacci retracement, such a correction would be 50.0%. If the price reaches the support at 1.2447 and turns around, the Fibonacci levels will also be corrective in nature, marking the lows of August 3 and 14 at 23.6%. Once we confirm that the price has settled below 1.2447, we can then consider 1.2307 as a target.


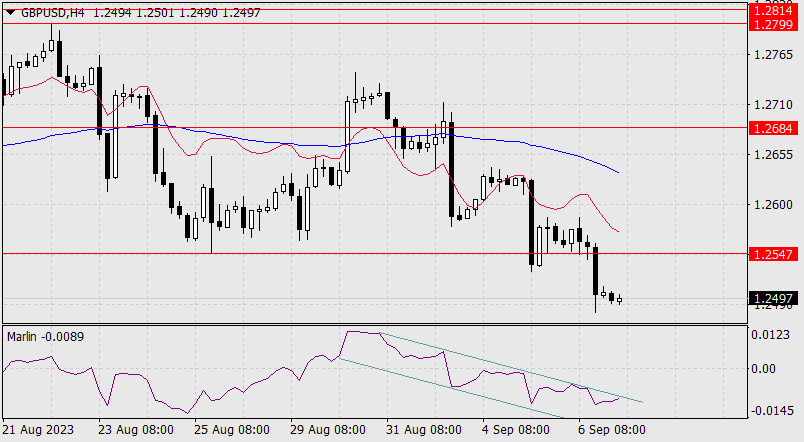
    On the 4-hour chart, the price is rhythmically declining below the indicator lines, and the Marlin oscillator is developing in a descending channel but already shows an intention to leave this area by moving upwards. Yesterday's decline was caused by Bank of England Governor Andrew Bailey's speech in Parliament, where he mentioned reaching the peak of interest rates. However, markets still expect the last rate hike in early 2024, and such sentiment won't hinder corrective growth.

    Analysis are provided by InstaForex.

    Read More
    Best regards, PR Manager
    Learn more about InstaForex Company at http://instaforex.com

  5. #1505
    Senior Member InstaForex Gertrude's Avatar
    Join Date
    Sep 2015
    Posts
    1,885
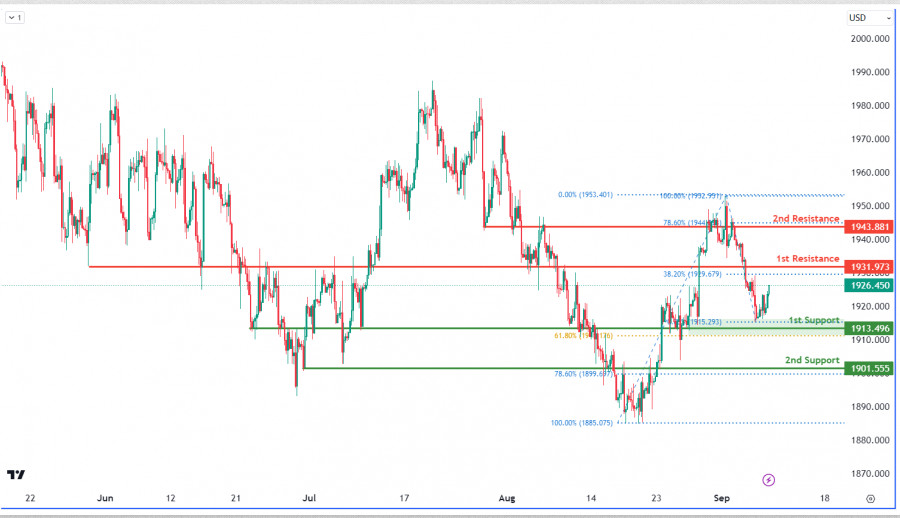
    XAUUSD H4 | Reacting off 1st Resistance?


    The XAU/USD chart currently has a bullish momentum, indicating a potential upward trend. There's a likelihood of continued bullish movement towards the first resistance. The first support at 1913.49 is significant, aligning with the 61.80% Fibonacci Retracement. The second support at 1901.55 is also noteworthy, aligning with the 78.60% Fibonacci Retracement. On the resistance side, the first resistance at 1931.97 aligns with the 38.20% Fibonacci Retracement, and the second resistance at 1943.88 aligns with the 78.60% Fibonacci Retracement.

    Analysis are provided by InstaForex.

    Read More
    Best regards, PR Manager
    Learn more about InstaForex Company at http://instaforex.com

  6. #1506
    Senior Member InstaForex Gertrude's Avatar
    Join Date
    Sep 2015
    Posts
    1,885
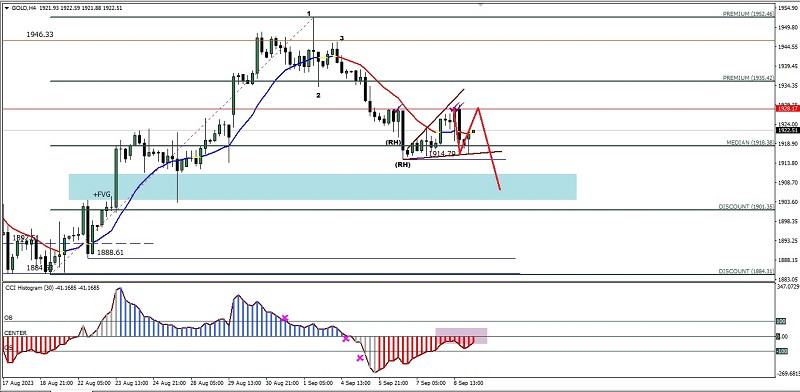
    Technical Analysis of Intraday Price Movement of Gold Commodity Asset, Monday, September 11 2023


    With the penetration of the three important levels of the CCI indicator on the 4 hour timeframe, the Gold commodity asset indicates that Sellers are dominating this commodity asset, even though there is currently an upward correction to test the Equal High level of 1928.17, but as long as it does not penetrate above the 1935.42 level, Gold still has the potential to continue. The decline is especially supported by the emergence of the Bearish Continuation Ascending Broadening Wedge pattern, so Gold has the potential to go down and try to penetrate below the 1914.79 level and if this level is successfully penetrated, the level of the Daily Bullish Fair Value Gap area in the range of 1903.38-1911.29 will be the next target to be aimed at.

    Analysis are provided by InstaForex.

    Read More
    Best regards, PR Manager
    Learn more about InstaForex Company at http://instaforex.com

  7. #1507
    Senior Member InstaForex Gertrude's Avatar
    Join Date
    Sep 2015
    Posts
    1,885
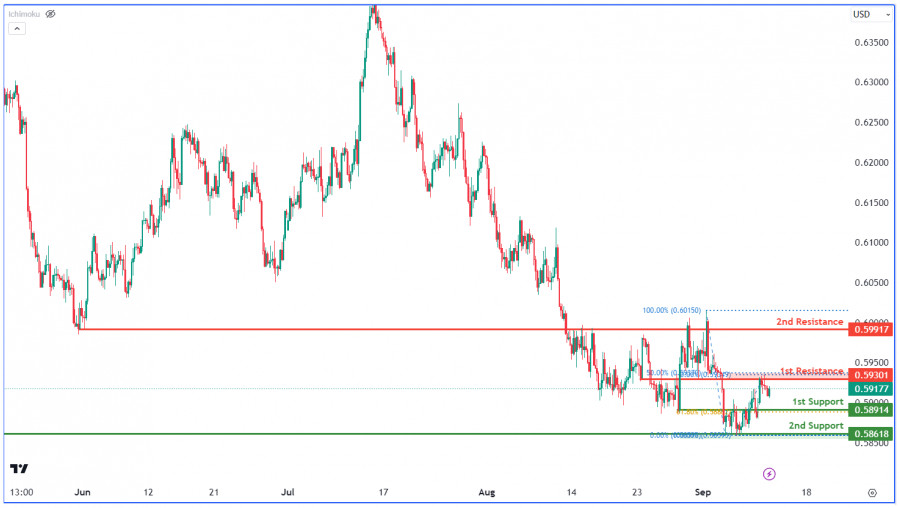
    NZDUSD H4 | Falling to 1st support?


    The NZD/USD chart currently shows a bullish trend with potential for further upward movement. The 1st resistance at 0.5930, coinciding with the 50.00% Fibonacci retracement, is a key level that may impede bullish progress. Similarly, the 2nd resistance at 0.5992 is also significant for potential resistance.

    On the downside, the 1st support at 0.5891 aligns with the 61.80% Fibonacci retracement and serves as a strong support level. The 2nd support at 0.5862, identified as a pullback support, adds to the support zone.

    Analysis are provided by InstaForex.

    Read More
    Best regards, PR Manager
    Learn more about InstaForex Company at http://instaforex.com

  8. #1508
    Senior Member InstaForex Gertrude's Avatar
    Join Date
    Sep 2015
    Posts
    1,885
    JAPAN PRODUCER PRICES RISE 0.3% ON MONTH IN AUGUST


    Producer prices in Japan were up 0.3 percent on month in August, the Bank of Japan said on Wednesday.

    That beat forecasts for an increase of 0.1 percent, which would have been unchanged from the July reading.

    On a yearly basis, producer prices climbed 3.2 percent - in line with expectations and down from the downwardly revised 3.4 percent increase in the previous month (originally 3.6 percent).

    Export prices were up 0.5 percent on month and down 0.8 percent on year, the bank said, while import prices slumped 0.9 percent on month and 15.9 percent on year.

    News are provided by
    InstaForex
    .


    Read More
    Best regards, PR Manager
    Learn more about InstaForex Company at http://instaforex.com

  9. #1509
    Senior Member InstaForex Gertrude's Avatar
    Join Date
    Sep 2015
    Posts
    1,885
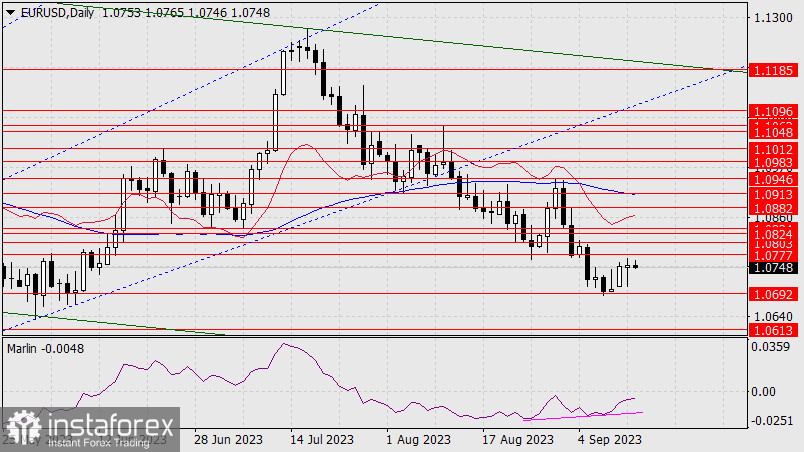
    Forex Analysis & Reviews: Forecast for EUR/USD on September 13, 2023

    EUR/USD:
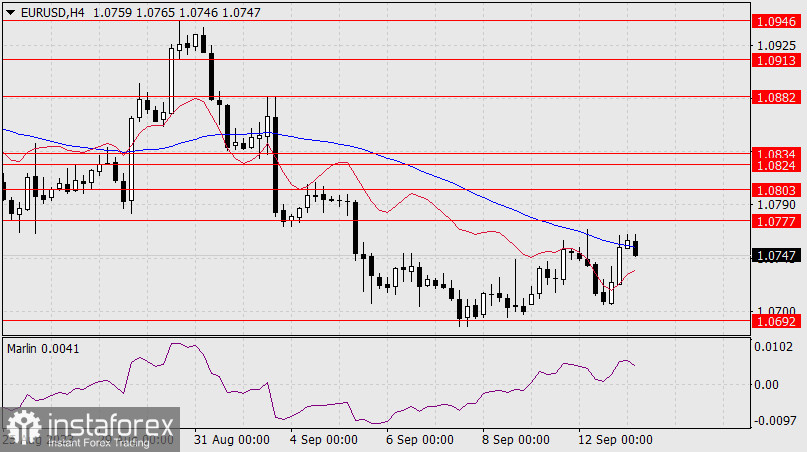
    Yesterday, the volatile day ended in favor of the bulls. Despite the numerous target levels on the daily chart, which is due to the corrective nature of the growth, the main target is defined by the MACD line around 1.0913. Overcoming the nearest resistance at 1.0777 will open the second target at 1.0803, the low from August 23rd.


    Today, the main driving force could be the US inflation data for August. The forecast for the core CPI is 4.3% YoY, compared to 4.7% YoY the previous month, and the forecast for the CPI suggests an increase from 3.2% YoY to 3.6% YoY. If we assume that the data will come out in line with economists' calculations, investors will pay more attention to the decrease in the core CPI, as the Federal Reserve relies more on it. As a result, expectations of a rate hike will decrease, and the euro will rise.


    Analysis are provided by InstaForex.

    Read More
    Best regards, PR Manager
    Learn more about InstaForex Company at http://instaforex.com

  10. #1510
    Senior Member InstaForex Gertrude's Avatar
    Join Date
    Sep 2015
    Posts
    1,885
    Forex Analysis & Reviews: Forecast for EUR/USD on September 14, 2023

    EUR/USD
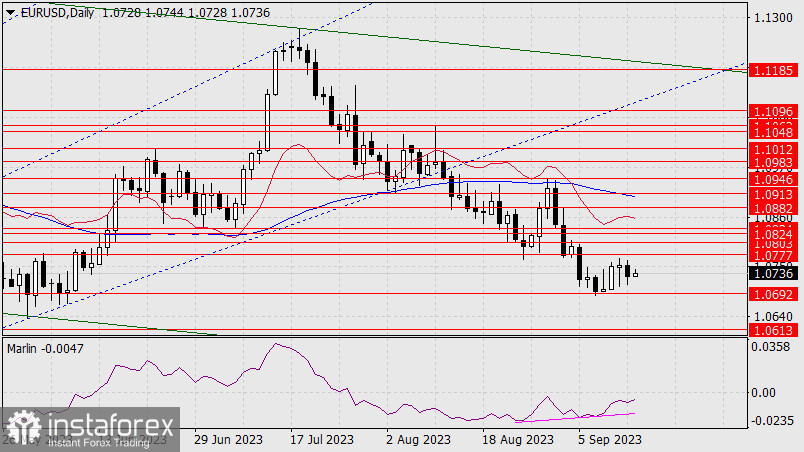
    Yesterday's US CPI data came in around forecast levels. The August Core CPI dropped from 4.7% YoY to 4.3% YoY, while the CPI rose from 3.2% YoY to 3.7% YoY (forecast 3.6% YoY). Considering that industrial production in the eurozone plummeted by 1.1% in July and decreased by 2.2% YoY (forecast -0.3%), the euro's decline could have been greater than the 24 pips that we saw yesterday.


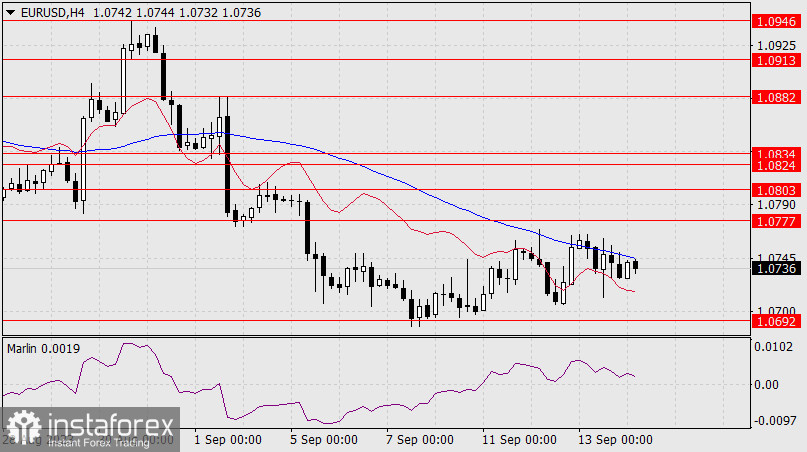
    Trading volumes were substantial, indicating that there was market activity, and traders preferred to hold their positions ahead of today's European Central Bank meeting, as the probability of a rate hike stands at 68%. If investors showed an intention not to sell the euro based on US inflation data, they may buy it following the ECB meeting. The bullish target is the 1.0824/32 range. Technical convergence in action. A price above this range will open up the target of 1.0882. The MACD line is approaching this level.


    On the 4-hour chart, the price is between the balance and MACD indicator lines. The Marlin oscillator is currently holding an uptrend. A waiting mode is likely until the ECB announces its rate decision.

    Analysis are provided by InstaForex.

    Read More
    Best regards, PR Manager
    Learn more about InstaForex Company at http://instaforex.com

Page 151 of 180 FirstFirst ... 51 101 141 149 150 151 152 153 161 ... LastLast

Tags for this Thread

Bookmarks

Posting Permissions

  • You may not post new threads
  • You may not post replies
  • You may not post attachments
  • You may not edit your posts
  •