Page 152 of 178 FirstFirst ... 52 102 142 150 151 152 153 154 162 ... LastLast
Results 1,511 to 1,520 of 1779

Wave Analysis by InstaForex

This is a discussion on Wave Analysis by InstaForex within the Analytics and News forums, part of the Trading Forum category; GBPUSD H4 | Bearish Continuation Expected? The GBP/USD chart currently shows a bearish momentum due to trading below the bearish ...


  1. #1511
    Senior Member InstaForex Gertrude's Avatar
    Join Date
    Sep 2015
    Posts
    1,885
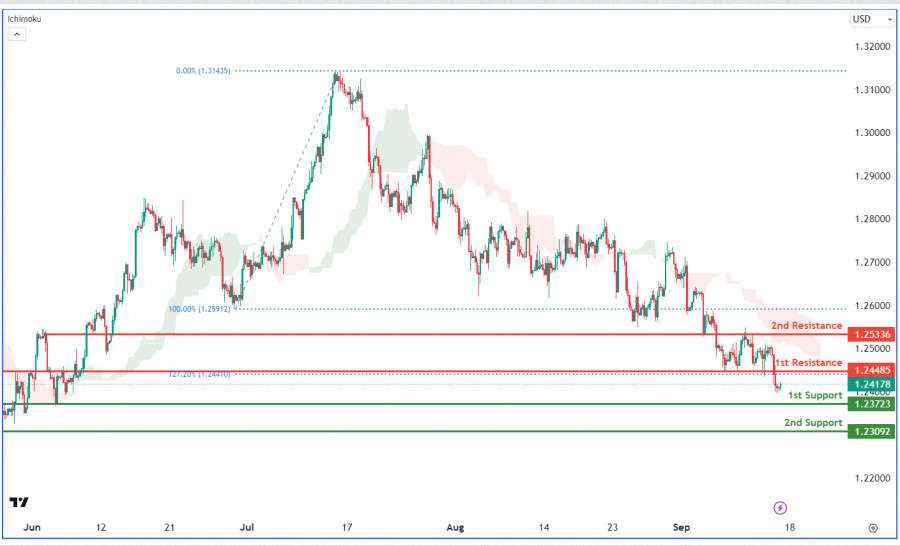
    GBPUSD H4 | Bearish Continuation Expected?


    The GBP/USD chart currently shows a bearish momentum due to trading below the bearish Ichimoku cloud. This could lead to a continued bearish movement towards the significant 1st support level at 1.2372, which is marked as an overlap support. Additionally, the 2nd support at 1.2309 is recognized as a swing low support.

    On the resistance side, the 1st resistance level at 1.2448 is a pullback resistance, possibly hindering upward movement. The 2nd resistance at 1.2533 is an overlap resistance, suggesting its potential as a point of reversal or resistance.

    Analysis are provided by InstaForex.

    Read More
    Best regards, PR Manager
    Learn more about InstaForex Company at http://instaforex.com

  2. #1512
    Senior Member InstaForex Gertrude's Avatar
    Join Date
    Sep 2015
    Posts
    1,885
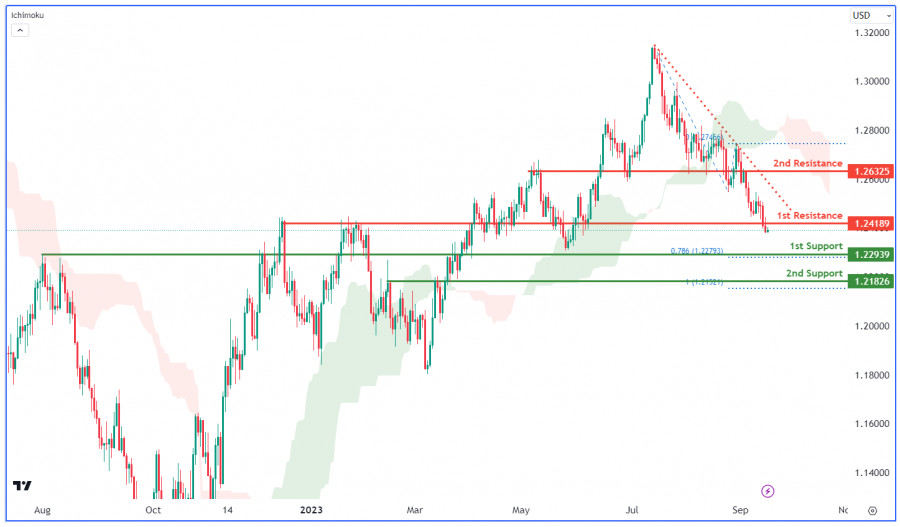
    GBPUSD Day | Bearish Continuation Expected?


    The GBP/USD chart displays a dominant bearish trend, emphasized by its position below the bearish Ichimoku cloud and a descending trend line. Key supports stand at 1.2293, backed by the 78.60% Fibonacci Projection, and 1.2182, aligned with the 100% Fibonacci Projection. Resistances are identified at 1.2418 and 1.2632, with the latter being an overlap resistance. The overall outlook remains bearish.

    Analysis are provided by InstaForex.

    Read More
    Best regards, PR Manager
    Learn more about InstaForex Company at http://instaforex.com

  3. #1513
    Senior Member InstaForex Gertrude's Avatar
    Join Date
    Sep 2015
    Posts
    1,885
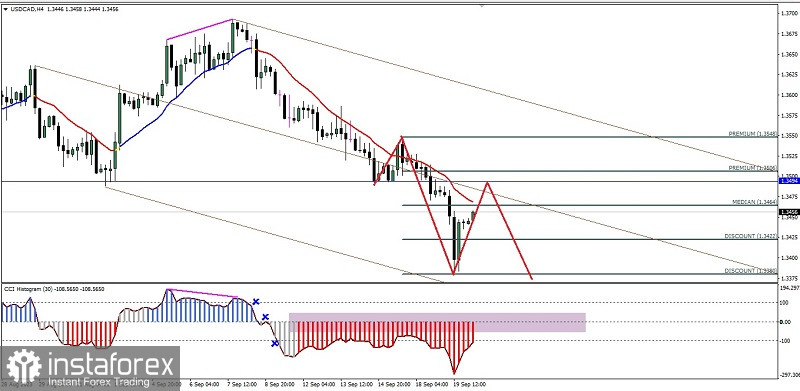
    Forex Analysis & Reviews: Technical Analysis of Intraday Price Movement of USD/CAD Commodity Currency Pairs, Wednesday, September 20 2023


    From the 4-hour chart of The Lonnie, it can be clearly seen that Sellers are very dominant, this can be seen from the price movement which moves regularly and harmoniously in the Pitchfork channel which dips downwards and the price movement is below the WMA (20) with a downward sloping slope as well as the CCI indicator has succeeded breaking below the three main levels (100, 0, & -100), but currently it appears that USD/CAD is being corrected upwards to test the SBR (support Become Resistance) level at the level 1.3494. As long as this upward correction does not breaks and close above the level 1.3550, then USD/CAD has the potential to continue its decline back to level 1.3422 as the main target and level 1.3380 as the second target if momentum and volatility support it.

    Analysis are provided by InstaForex.

    Read More
    Best regards, PR Manager
    Learn more about InstaForex Company at http://instaforex.com

  4. #1514
    Senior Member InstaForex Gertrude's Avatar
    Join Date
    Sep 2015
    Posts
    1,885
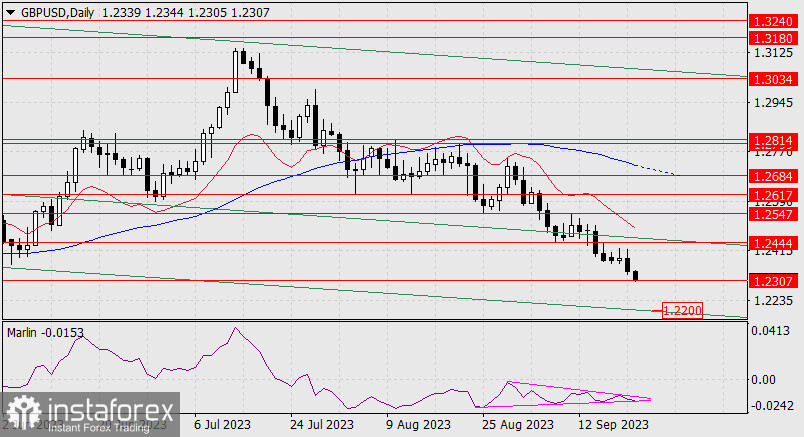
    Forex Analysis & Reviews: Forecast for GBP/USD on September 21, 2023

    GBP/USD
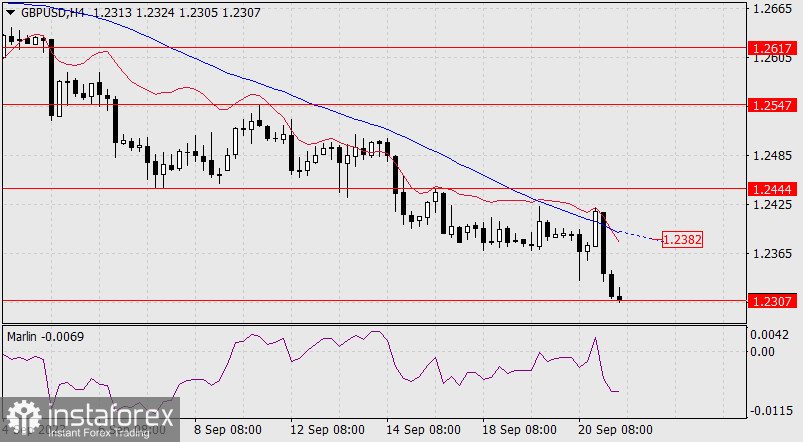
    This morning, the British pound reached the target support level of 1.2307. It took 5 days for it to move from the previous level of 1.2444. During this time, the Marlin oscillator's signal line has compressed even further into a wedge and is ready to break out of it today. If it breaks below, the first target will be the embedded price channel line at 1.2200. Then the second target will be 1.2070, which is nearly in line with the May 2020 low.


    Today, the Bank of England may raise the rate from 5.25% to 5.50% (market expectations), so Marlin could break above the wedge. If we witness a solid momentum and the price consolidates above 1.2444, it will continue to rise to the next target at 1.2547. This would mark a return to the bullish scenario towards the MACD line at 1.2684.


    Analysis are provided by InstaForex.

    Read More
    Best regards, PR Manager
    Learn more about InstaForex Company at http://instaforex.com

  5. #1515
    Member
    Join Date
    Sep 2015
    Posts
    94
    Forecast for GBP/USD on September 22, 2023

    GBP/USD:
    Yesterday, the British pound fell short of reaching the support line of the price channel. On the daily chart, the Marlin oscillator's signal line is breaking out of the wedge and moving downwards, so the price could test the support around the 1.2200 level. However, we do not expect a deep fall, as the oscillator's wedge has been fully formed, reaching its peak, and is gradually transforming into a horizontal trend.


    A reversal towards the bullish line of the price channel could likely occur from the price channel line at 1.2200, as it aims to rise toward the target level of 1.2444. The Bank of England's decision to leave the interest rate at 5.25%, instead of the expected increase to 5.50%, did not have a significant impact on the British pound. The expected rise has been postponed for now.


    On the 4-hour chart, the price is falling below both indicator lines, and Marlin is gradually moving deeper into the downtrend. The first sign of a bullish correction would be the price closing above 1.2307. After that, the price will need to overcome the MACD line at 1.2354, which would then open the path to the target at 1.2444.

    *The market analysis posted here is meant to increase your awareness, but not to give instructions to make a trade.


    Analysis are provided by InstaForex.

    Read More

  6. #1516
    Senior Member InstaForex Gertrude's Avatar
    Join Date
    Sep 2015
    Posts
    1,885
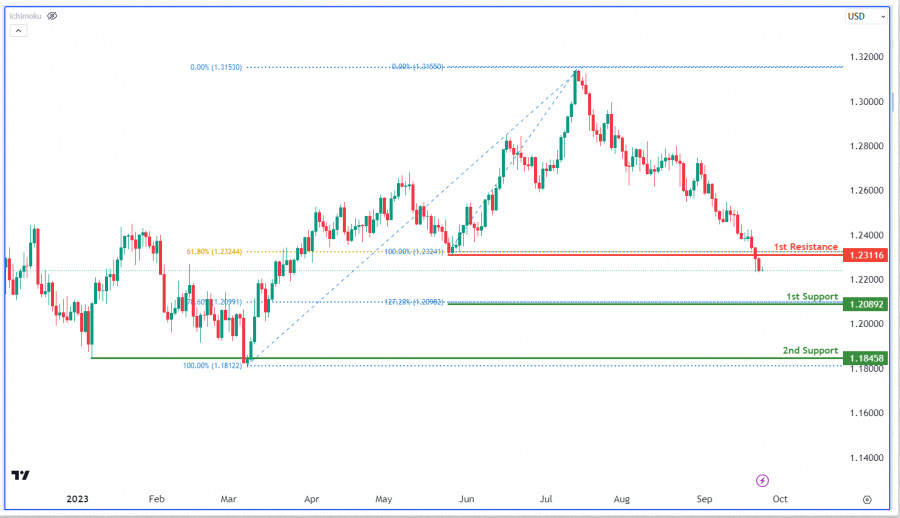
    GBPUSD Day | Bouncing off support?


    The GBP/USD chart shows a bearish trend, with focus on the 1st support at 1.2089, significant due to the convergence of the 127.20% Fibonacci Extension and the 78.60% Fibonacci Retracement. The 2nd support is at 1.1845, a historical swing low. On the resistance side, the 1st resistance is at 1.2311, a pullback resistance aligned with the 61.80% Fibonacci Retracement, serving as a potential barrier.

    Analysis are provided by InstaForex.

    Read More
    Best regards, PR Manager
    Learn more about InstaForex Company at http://instaforex.com

  7. #1517
    Senior Member InstaForex Gertrude's Avatar
    Join Date
    Sep 2015
    Posts
    1,885
    Forecast for EUR/USD on September 26, 2023

    EUR/USD
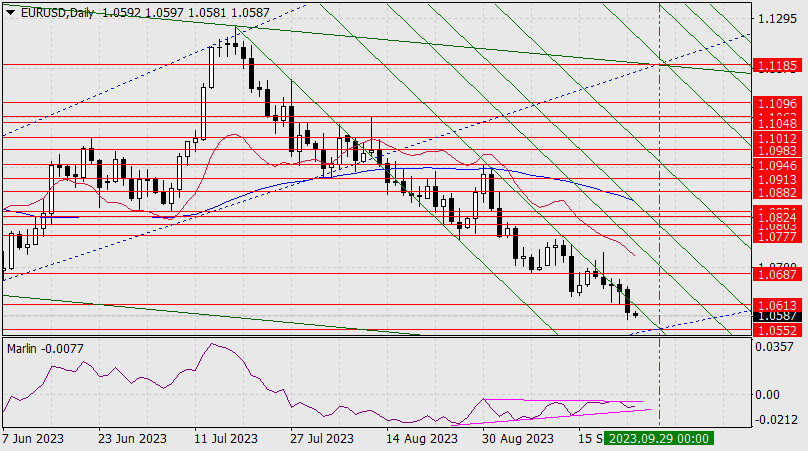
    Once again, the euro is following an alternative scenario. Yesterday, the day closed with a black candle below the support at 1.0613 and below the Fibonacci channel line. The price is heading towards the target at 1.0552. The euro has a saw-toothed structure of decline, typical of corrective movements, and this correction, since July 18th, is clearly prolonged. The likely reason for this is the ongoing decline in the stock market. Now, a crisis correlation (the decline of both the stock market and the dollar) is possible in the event of a U.S. budget collapse - in the event of an emergency reduction in budget expenditures. U.S. lawmakers have a deadline until October 1st.


    The signal line of the Marlin oscillator on the daily chart has returned to the wedge, slightly modifying it but maintaining the priority of breaking above it. We probably shouldn't expect strong movement until we reach Monday, October 2. If the budget issue in the United States is resolved by a certain deadline, we may see an appetite for risk - growth in the stock market and the euro. Thus, the single currency still has a bullish bias. Only a clearly interpreted and protracted crisis will shift the priority (our target is 0.9338).


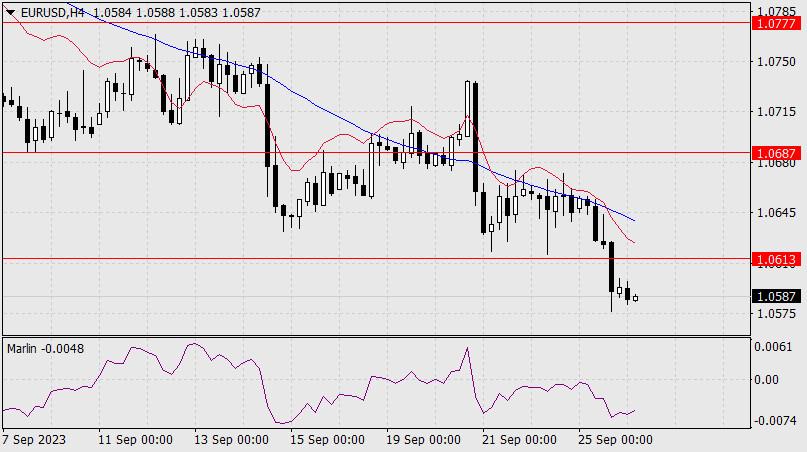
    On the 4-hour chart, the price is decreasing after a series of unsuccessful attempts to overcome the MACD line and the balance line. Marlin has expended all its strength for growth, and it will be difficult for it to recover now. We will likely see a sideways trend until Monday.

    Analysis are provided by InstaForex.

    Read More
    Best regards, PR Manager
    Learn more about InstaForex Company at http://instaforex.com

  8. #1518
    Senior Member InstaForex Gertrude's Avatar
    Join Date
    Sep 2015
    Posts
    1,885
    What are the chances of another Bank of England rate hike in November?

    In order to understand how the Bank of England is going to act at the remaining two meetings in 2023, we need to consider its potential for raising interest rates. The first and most crucial indicator that the central bank (and the markets) has been relying on for some time is inflation. However, as of September, inflation remains extremely high, well above the target level. One might assume that the BoE will continue to hike rates, but in September, it took a pause. A pause can only mean two things: either the BoE is preparing to end the tightening process, or it has already completed it.


    BoE Governor Andrew Bailey and some other members of the BoE's Monetary Policy Committee have mentioned that they expect inflation to drop to 5% by the end of the year. A 5% inflation rate is still very high, 2.5 times above the target. If the BoE is already prepared to conclude its tightening, it may not achieve the target. Furthermore, there's no guarantee that inflation won't start accelerating again. For instance, US inflation has been rising for the past two months. All I want to convey with these arguments is that it's still too early to assume that inflation can return to 2% at the current interest rate level.

    Based on that, I believe that the BoE has exhausted its potential for rate hikes, and this is the main reason for the pause in September. Now, the central bank will only raise rates if inflation starts to accelerate significantly. And in that case, the 2% target may be forgotten for several years even with a peak rate, but we could still see 1-2 more emergency rate hikes.

    I also want to note that the BoE (like the European Central Bank) is counting on holding rates at the peak level for an extended period to bring inflation back to 2%. This was mentioned after last week's meeting. The Monetary Policy Committee expects inflation to slow down further, but Bailey says cutting rates would be "very premature". Four out of nine committee members voted for a rate hike at the previous meeting. In addition, the Monetary Policy Committee said its balance sheet of government debt will shrink by £100 billion.

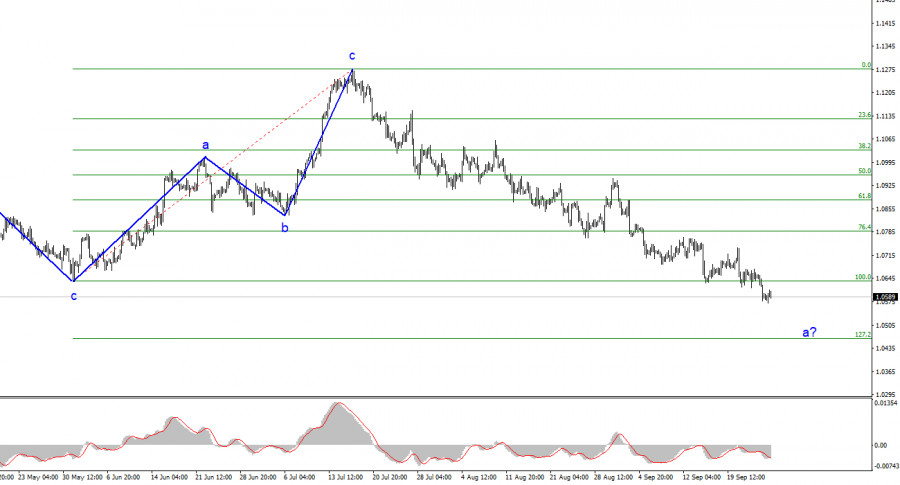
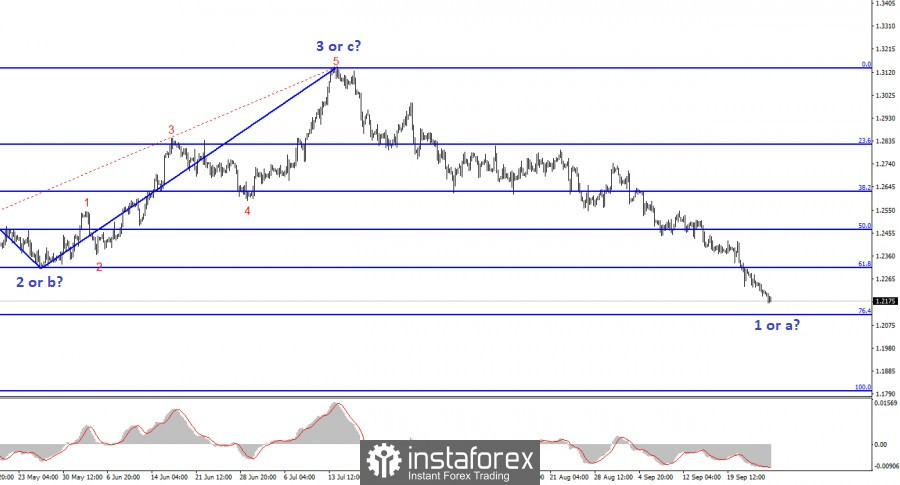
    Based on the analysis conducted, I came to the conclusion that a downward wave pattern is being formed. I still believe that targets in the 1.0500-1.0600 range for the downtrend are quite feasible, especially since they are quite near. Therefore, I will continue to sell the instrument. Since the downward wave did not end near the 1.0637 level, we can expect the pair to fall to the 1.05 level and slightly below. However, the second corrective wave will start sooner or later.


    The wave pattern of the GBP/USD instrument suggests a decline within the downtrend. At most, the British pound can expect the formation of wave 2 or b in the near future. However, even with a corrective wave, there are still significant challenges. At this time, I would remain cautious about selling, as there may be a corrective upward wave forming in the near future, but for now we have not seen any signals for this wave yet.

    Analysis are provided by InstaForex.

    Read More
    Best regards, PR Manager
    Learn more about InstaForex Company at http://instaforex.com

  9. #1519
    Senior Member InstaForex Gertrude's Avatar
    Join Date
    Sep 2015
    Posts
    1,885
    USDCAD Day | Rising toward resistance level?


    The USD/CAD chart shows bullish momentum with a potential move towards the first resistance. There's an important first support at 1.3372, serving as an overlap support. On the resistance side, the first resistance at 1.3673 is also an overlap resistance, and the second resistance at 1.3876 is a swing high resistance.

    Analysis are provided by InstaForex.

    Read More
    Best regards, PR Manager
    Learn more about InstaForex Company at http://instaforex.com

  10. #1520
    Senior Member InstaForex Gertrude's Avatar
    Join Date
    Sep 2015
    Posts
    1,885
    GBPUSD H4 | Bouncing off support?


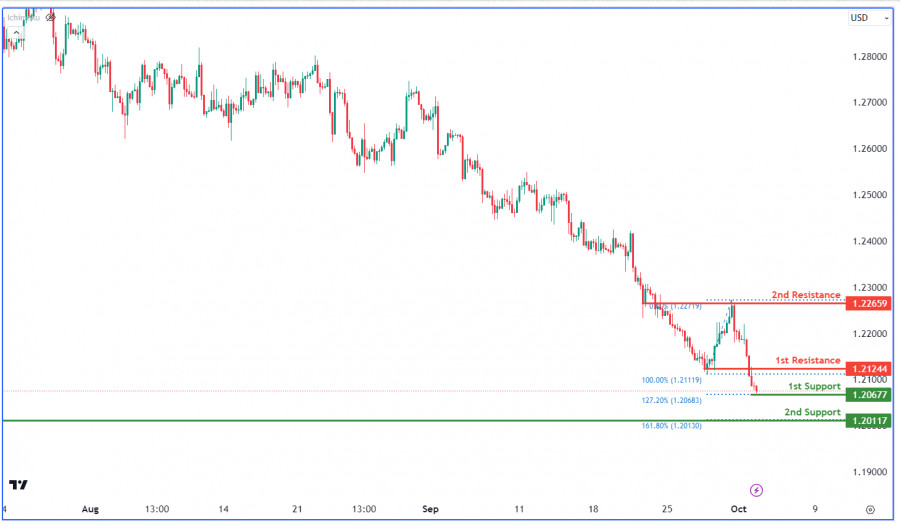
    The GBP/USD chart is currently bearish, primarily due to its position below the bearish Ichimoku cloud. There's a potential scenario of a bullish bounce off the 1st support at 1.2067, supported by the 127.20% Fibonacci Extension, and the 2nd support at 1.2011, a swing low support with the 161.80% Fibonacci Extension.

    On the resistance side, the 1st resistance at 1.2124 is an overlap resistance that may impede bullish movements. Additionally, the 2nd resistance at 1.2265 is also categorized as an overlap resistance.

    Analysis are provided by InstaForex.

    Read More
    Best regards, PR Manager
    Learn more about InstaForex Company at http://instaforex.com

Page 152 of 178 FirstFirst ... 52 102 142 150 151 152 153 154 162 ... LastLast

Tags for this Thread

Bookmarks

Posting Permissions

  • You may not post new threads
  • You may not post replies
  • You may not post attachments
  • You may not edit your posts
  •