Page 52 of 164 FirstFirst ... 2 42 50 51 52 53 54 62 102 152 ... LastLast
Results 511 to 520 of 1634

Wave Analysis by InstaForex

This is a discussion on Wave Analysis by InstaForex within the Analytics and News forums, part of the Trading Forum category; Technical analysis of ETH/USD for 02/10/2019 Crypto Industry News: Testnet network Ethereum under the name Istanbul (which operates under the ...


  1. #511
    Senior Member InstaForex Gertrude's Avatar
    Join Date
    Sep 2015
    Posts
    1,885
    Technical analysis of ETH/USD for 02/10/2019


    Crypto Industry News:
    Testnet network Ethereum under the name Istanbul (which operates under the Ropsten testnet) was launched on September 30. Considering the existing problems related to the dates of the planned hard forks, this can be considered a great success. The whole was able to run even two days before the earlier announced date, which fell on October 2.

    Unfortunately, after the activation of Ropsten an unplanned fork occurred. So now two chains are working.

    The issue of the community centered around the Vitalik Buterin platform was explained by the community manager at the Ethereum Hudson Jameson Foundation. In his tweet from yesterday, he described what happened. Today, some miners are still mining the old version of Ropsten. Another copy of its new, updated version. The programmer, however, calms down. The problem is to be solved. Information should not worry investors: they are testnets, so that such errors come out during their duration.

    Jameson also explains what exactly happened. The genesis of the problem is the nature of blockchains based on the proof-of-work algorithm, including Ethereum. The miners in them must independently update the software to be able to dig as part of a new chain. This time some of them did not and the result was an unplanned division.

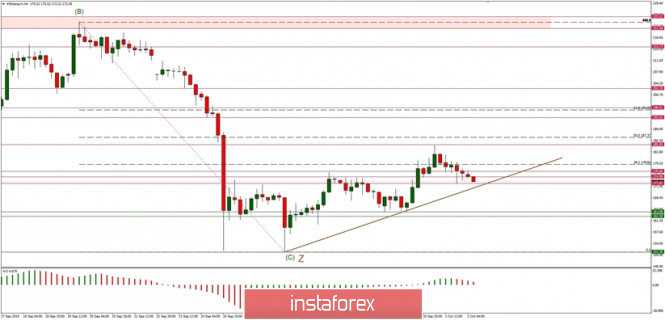
    Technical Market Overview:
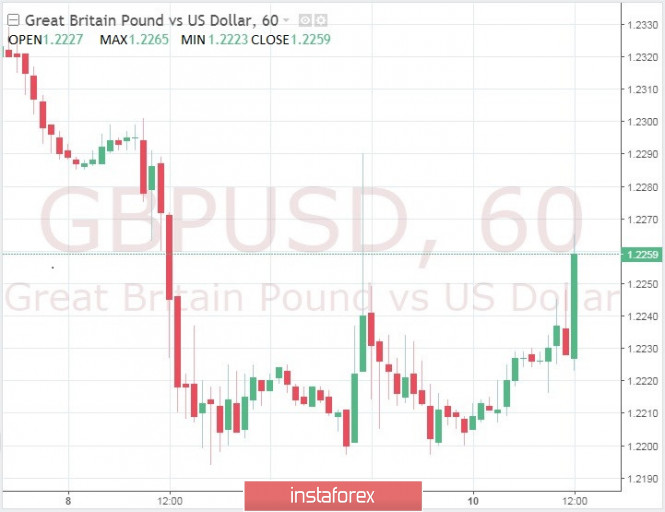
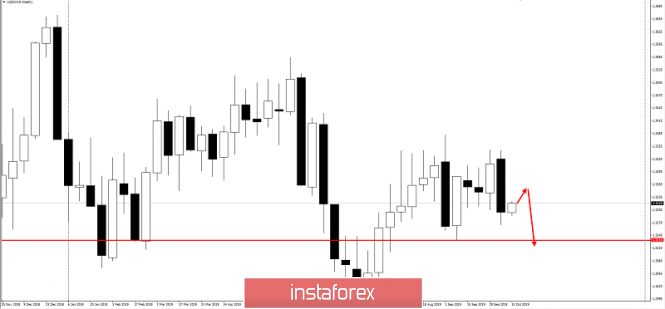
    The ETH/USD pair has made a new local high at the level of $185.05, but so far couldn't make it to the 50% of Fibonacci retracement located at the level of $187.37. The supply zone located between the levels of $172.82 - $176.66 has been clearly broken, the momentum is now increasing significantly, so there is a chance for the bulls to hit the level of 50% of even the 61% shortly if the trendline dynamic support around the level of $172.82 will provide the bounce. In the case of a trendline violation, the nearest technical support is located at the level of $163.98.

    Weekly Pivot Points:
    WR3 - $256.80
    WR2 - $233.68
    WR1 - $197.61
    Weekly Pivot - $174.45
    WS1 - $137.03
    WS2 - $112.52
    WS3 - $77.73

    Trading Recommendations:
    The best strategy in the current market conditions is to trade with the larger timeframe trend, which is still up. All the shorter timeframe moves are still being treated as a counter-trend correction inside of the uptrend. When the wave 2 corrective cycles are completed, the market might will ready for another impulsive wave up of a higher degree and uptrend continuation

    Analysis are provided byInstaForex.
    Best regards, PR Manager
    Learn more about InstaForex Company at http://instaforex.com

  2. #512
    Senior Member InstaForex Gertrude's Avatar
    Join Date
    Sep 2015
    Posts
    1,885
    Trading Idea for NZD/CAD

    As you know, cross-rates are an excellent tool for hedging positions in "majors", such as the most popular of them - the EUR/USD pair.

    I recommend for each position in major - to have a position in the "right" cross, and you will appreciate this tactic of distributing profits between instruments.

    Let's pay attention to the very oversold NZD/CAD cross-instrument, which has passed 10,000 p for 5 figures almost without a pullback since March 2019. However, several people know that this cross has an average rollback passage of exactly 10 points. And right now, after updating the minimum of 2015, it makes sense to buy it with a potential of at least 3,000 p at 5 figures.


    It is easier to do this by collecting a grid of orders in longs on pullback movements. In fact, you will work out a false breakdown on an annual scale, or rather - for 4 years. This does not happen every day. Therefore, it is necessary to take advantage of this unique opportunity.

    Analysis are provided byInstaForex.
    Best regards, PR Manager
    Learn more about InstaForex Company at http://instaforex.com

  3. #513
    Senior Member InstaForex Gertrude's Avatar
    Join Date
    Sep 2015
    Posts
    1,885
    Elliott wave analysis of GBP/JPY for October 4 - 2019


    GBP/JPY is now hovering just above the ideal corrective target at 130.78. We continue to look for a final dip closer to this target as long as minor resistance at 132.55 and more importantly as long as resistance at 133.36 is able to cap the upside. However, a break above resistance at 133.36 will indicate that red wave ii has completed and red wave iii towards 139.15 is developing.

    R3: 133.36
    R2: 132.85
    R1: 132.55
    Pivot: 132.00
    S1: 131.47
    S2: 131.25
    S3: 130.78

    Trading recommendation:
    We will buy GBP at 131.25 or upon a break above 132.55

    Analysis are provided byInstaForex.
    Best regards, PR Manager
    Learn more about InstaForex Company at http://instaforex.com

  4. #514
    Senior Member InstaForex Gertrude's Avatar
    Join Date
    Sep 2015
    Posts
    1,885
    Control zones GBP/USD 10/07/19

    The pair is trading between two significant zones. The resistance was Weekly Control Zone 1/2 1.2388-1.2372, and the weekly CZ 1.2246-1.2213 became the support. To continue medium-term growth, closing of trading above the level of 1.2388 on Monday will be required. This will pave the way for the September maximum. This model has a 50% chance of working out.


    The continuation of the medium-term growth may become the main model for the coming week, as many pairs associated with the dollar formed a reversal pattern in the direction of strengthening.

    An alternative model will be developed if the Weekly Control Zone 1/2 test leads to an increase in supply and a halt to growth. This will indicate the formation of a local accumulation zone, where the main goals will be the extremes of last week.


    Daily CZ - daily control zone. The zone formed by important data from the futures market that changes several times a year.
    Weekly CZ - weekly control zone. The zone formed by the important marks of the futures market, which change several times a year.
    Monthly CZ - monthly control zone. The zonethat reflects the average volatility over the past year.

    Analysis are provided byInstaForex.
    Best regards, PR Manager
    Learn more about InstaForex Company at http://instaforex.com

  5. #515
    Senior Member InstaForex Gertrude's Avatar
    Join Date
    Sep 2015
    Posts
    1,885
    Fractal analysis of Bitcoin on October 8

    Forecast for October 8:
    Analytical review of cryptocurrency on a scale of H1:


    For the Bitcoin instrument, the key levels on the H1 scale are: 9026.00, 8811.75, 8666.36, 8379.42, 8287.60, 8039.21, 7893.53 and 7698.41. Attention! This instrument is characterized by medium-term trend trading. Here, as expected, the price formed a local structure for the top of October 7. In addition, this instrument has a good correlation with the euro / yen.

    The range for entering the market for the purchase is 7948.00 - 8380.00. We expect the development of the upward cycle after the price passes the noise range 8287.60 - 8379.42. In this case, the first goal is 8666.36. Meanwhile, price consolidation is in the range of 8666.36 - 8811.75, as well as a possible rollback to correction. The potential value for the top, where it makes sense to close the position - 9026.00. The range 8039.21 - 7893.53 is a key support for the ascending structure. Its passage at the price will lead to the cancellation of this structure. In this case, the first goal is 7698.41. However, to trade in a downward direction, it makes sense when the local initial conditions for a downward cycle are formed.

    The main trend is the initial conditions for the top of October 7.

    Trading recommendations:
    Buy: 7948.00 - 8380.00 Stop Loss: 7891.00 Take profit: 8666.36
    To continue :
    Stop Loss: 8287.60 Take profit: 9026.00

    Analysis are provided byInstaForex.
    Best regards, PR Manager
    Learn more about InstaForex Company at http://instaforex.com

  6. #516
    Senior Member InstaForex Gertrude's Avatar
    Join Date
    Sep 2015
    Posts
    1,885
    Forecast for AUD/USD on October 9, 2019

    AUD/USD
    the opening of the week, the Australian dollar has developed on the scale of a four-hour chart. All days, until this morning, the price was reflected from the support of the MACD line of a four-hour scale. The signal line of the Marlin oscillator penetrates into the growth zone.


    Now the aussie is ready to close the gap formed at the beginning of the week. The purpose of growth is the line of the price channel of the daily scale near the MACD line at around 0.6790. We the fall to resume from the target level.


    Analysis are provided byInstaForex.
    Best regards, PR Manager
    Learn more about InstaForex Company at http://instaforex.com

  7. #517
    Senior Member InstaForex Gertrude's Avatar
    Join Date
    Sep 2015
    Posts
    1,885
    Gold breaks into battle

    Gold quickly returned above the psychologically important level of $1,500 per ounce due to weak statistics on US business activity. The United States feel the pain of trade wars and may well pull the rest of the world into the abyss, as has happened in the past more than once. At the same time, neither the US labor market report nor Jerome Powell's statement about the launch of the asset-purchase program made an impression on the precious metal. Obviously, investors are waiting for something. It is easy to guess that this is news from the negotiating table of Washington and Beijing.

    Despite the fact that the Federal Reserve chairman made it clear that the upcoming program for the purchase of short-term securities is not QE, its start can be considered a positive factor for the bulls on XAU/USD. Increasing the activity of a large buyer is a good argument in favor of rising prices and falling profitability. Non-interest-bearing gold is not able to compete with bonds if rates on them rise. If they, on the contrary, decline, the precious metal begins to enjoy increased popularity. This is confirmed by the high demand for products of ETF funds. Their stocks have been increasing for 17 consecutive days, which is the longest winning streak since 2009. The total size of the indicator is only 35 tons below the record high that took place in 2012.

    Gold ETF Stock Dynamics


    The strong growth in stocks of specialized exchange-traded funds and the stability of gold against a strong dollar allow Citigroup to adhere to its bullish forecast for XAU/USD. The company believes that the precious metal will grow to $1,700 per ounce within 6-12 months. But on the side of its fans plays and increased activity of central banks! Thus, the People's Bank of China has been building up gold reserves for the 10th consecutive month. During this period, it acquired 99.8 tons. As a result, stocks rose to 62.64 million ounces. According to the World Gold Council, 14 regulators from various countries continue to diversify their reserves in favor of precious metals in order to reduce their dependence on the US dollar. In 2018, central banks from around the world bought $27 billion worth of gold, a record high.

    The dynamics of gold reserves in China


    While central banks and ETF fans are buying gold, speculators prefer to exit. In the week of October 1, their net longs fell to their lowest level since late July. It's not necessary to be frightened by it. Financial managers quite logically take profits on the eve of an important event - trade negotiations between the US and China. Most likely, their impact on financial markets will be much greater than the publication of the minutes of the September meetings of the Fed and the ECB.

    Technically, the "Splash and Shelf" pattern takes place on the daily gold chart. Breakthrough of the lower boundary of the consolidation range of $1490-1520 will launch another correctional wave in the direction of $1440-1445 per ounce. In contrast, a successful assault on the resistance at $1520 will strengthen the risks of restoring the "bullish" trend and continuing the rally in the direction of the target at 161.8% on the AB=CD pattern.

    Analysis are provided byInstaForex.
    Best regards, PR Manager
    Learn more about InstaForex Company at http://instaforex.com

  8. #518
    Senior Member InstaForex Gertrude's Avatar
    Join Date
    Sep 2015
    Posts
    1,885
    GBP/USD continues to grow, despite weak data from the UK


    The continued sale of the dollar helped maintain the positive dynamics of the pound, but otherwise the prospects for the British currency are not very good. The UK economy fell by 0.1% in August against the expected stable value. Indicators of manufacturing and industrial production also fell short of forecasts. While the GBP/USD pair maintains its upward trend, although it has slightly deviated from recent highs in response to weak economic data. Demonstrating the miracles of resilience in the 1.2200 mark for the third consecutive session, the pair was able to restore positive movement, however, only amid continued active sales of the dollar.


    In principle, weaker than expected macroeconomic data in the UK could not have a significant impact. Nevertheless, the positive impulse did not receive a new charge, while the pair confidently holds the blow and tries to gain a foothold at a new height, despite the fact that the UK monthly GDP report showed that the economy unexpectedly declined by 0.1% in August. In addition to this, UK manufacturing and manufacturing declined more than expected in August, although this drop was partially offset by a lower-than-expected trade deficit. Now it will be interesting to see if the pair can benefit from the positive movement or fail again at higher levels amid continuing uncertainty surrounding Britain's exit from the European Union.

    Analysis are provided byInstaForex.
    Best regards, PR Manager
    Learn more about InstaForex Company at http://instaforex.com

  9. #519
    Senior Member InstaForex Gertrude's Avatar
    Join Date
    Sep 2015
    Posts
    1,885
    EUR/USD and GBP/USD. Preview of the new week. The EU summit, Brexit, inflation in the European Union


    It is safe to say that we can call the new week, the"Week of Great Britain." Most of the macroeconomic reports planned for the week will concern the GBP/USD pair. Most of the reports regarding the GBP/USD pair will come from the UK. In addition to economic data, it will be decided whether a new Brexit date will be postponed, whether Boris Johnson and the European government will be able to agree on a "deal" and whether the British Parliament will block a new deal if, by some miracle, Brussels and London succeed to reach consensus on all contentious issues in five days? Thus, the EUR/USD pair may feel relatively calm, just as it did the previous week, but the British pound is likely to break volatility records and very often change its direction if the news comes mixed. But consider all the data in more detail.

    As we said, most statistics come from the UK. On Tuesday, this will be data on unemployment and changes in average wages for August, on Wednesday - the consumer price index for September, on Thursday - retail sales and the European Union summit on Brexit starts. In addition, the United States will receive information on retail sales for September (Wednesday). However, despite the importance of future reports, we believe that the main attention of traders will be focused on Brexit, on the EU summit and on any information from Boris Johnson, Donald Tusk, Jean-Claude Juncker, Michel Barnier, Angela Merkel, Emmanuel Macron. It is these leaders who most often speak out about the promotion of the Brexit negotiation process and have the greatest influence on it. Regarding the chances of fulfilling one or another Brexit option, we recommend that traders not try to guess the future. Brexit has repeatedly shown to all market participants that trying to predict how everything will end is an ungrateful affair. The growth of the pound was often associated with rumors and unfounded market expectations, which each time gave way to a stronger fall in the British currency. That is why the movement of the pound/dollar pair this week may well be illogical and consistent with the nature of the incoming news, and all macroeconomic reports can be completely ignored. Thus, the main principle will be the "principle of caution" when trading GBP/USD in the new week.

    As for the EUR/USD pair, here from macroeconomic events we can note the report on the change in industrial production in August on Monday, the inflation report for September on Wednesday. The greatest interest, of course, will be caused by the consumer price index, which in recent months has fallen to absolute lows. A value below 1.0% will no longer be considered just low, but critical. And then it can be expected from the ECB and a new reduction in key rates, the quantitative stimulus program in the first months of its operation is unlikely to be changed, but in the future it can be expanded. And for the euro, these are all potential bearish factors. We still believe that in the confrontation with the dollar, a single European trump card is very small. And at the moment, we consider the main factor behind the growth of the euro a banal technical need to be adjusted from time to time. There is no positive news from the EU. Recently, everything is not good in the United States too, but America's economy is still stronger, macroeconomic indicators are higher, monetary policy is tougher. It is these factors that continue to play for the dollar.

    Analysis are provided byInstaForex.
    Best regards, PR Manager
    Learn more about InstaForex Company at http://instaforex.com

  10. #520
    Senior Member InstaForex Gertrude's Avatar
    Join Date
    Sep 2015
    Posts
    1,885
    USD/CAD - Heading downwards

    Greetings, dear traders. This time, I will show you a long-term recommendation on an instrument such as USD / CAD.

    What is interesting in this instrument now? First of all, the data on unemployment from Canada came out last Friday. Typically, these reports come out simultaneously with American Non-farm (NFP), but this time, the publication was separate. With this impulse, the Canadian dollar strengthened strongly against the US dollar, completely absorbing the abnormal growth a week earlier. At the moment, this indicates a very strong seller in the market.

    Since the plan is long-term, its implementation can take from several days to several weeks. Thus, it makes sense to wait for a rollback and consider selling on smaller TFs.


    It's important to understand that a lot of data will be released on Wednesday, such as the base index of retail sales for the American dollar and inflation for the Canadian one. Moreover, regular oil reserves will also affect the Canadian dollar. What is more reasonable here would be to expect the continuation of decline precisely after the release of all these news on Wednesday.

    I wish you success in trading and big profits!

    Analysis are provided byInstaForex.
    Best regards, PR Manager
    Learn more about InstaForex Company at http://instaforex.com

Page 52 of 164 FirstFirst ... 2 42 50 51 52 53 54 62 102 152 ... LastLast

Tags for this Thread

Bookmarks

Posting Permissions

  • You may not post new threads
  • You may not post replies
  • You may not post attachments
  • You may not edit your posts
  •