
 7Likes
 LinkBack URL
 About LinkBacks


Daily
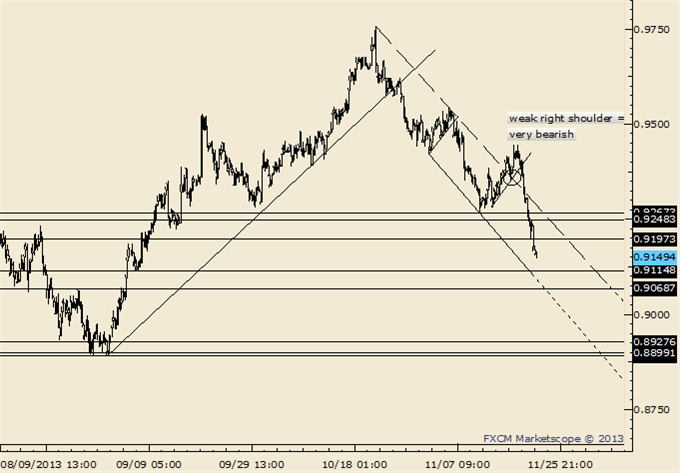
-The NZDUSD remains one of the more compelling longer term bearish possibilities. Consider that…
-The decline from the April high unfolded in 5 waves (impulsive), the advance from the August low is defined by converging lines (pennant, common in bear market advances)
-Action since 9/18 may compose a head and shoulders top.
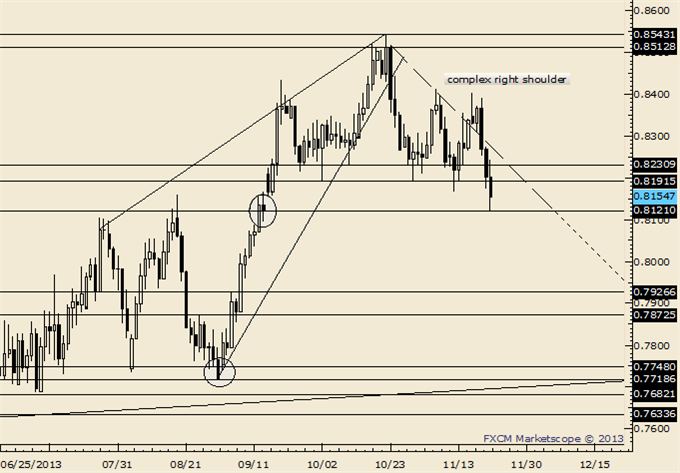
Trading Strategy: This is the fourth attempt to separate from .8200. It’s unlikely that the market holds this time. A short position is likely after some consolidation (and when the opportunity is offered to add to the AUDUSD position).
LEVELS: .8075 .8133 .8168 | .8225 .8257 .8276
--- Written by Jamie Saettele, CMT, Senior Technical Strategist for DailyFX.com
More...


 Reply With Quote


Bookmarks