Page 31 of 81 FirstFirst ... 21 29 30 31 32 33 41 ... LastLast
Results 301 to 310 of 809
Like Tree6Likes

Technical Analysis

This is a discussion on Technical Analysis within the Forex Trading forums, part of the Trading Forum category; Talking Points: Eye-Catching CAD/CHF Daily Price Action The Pair's Critical Resistance Zone 2 Potential Trade Triggers to Watch for This ...


  1. #301
    member TechnoMeter's Avatar
    Join Date
    Apr 2013
    Posts
    1,636
    Blog Entries
    421

    CAD/CHF Trend Trades for Any Risk Profile

    Talking Points:

    • Eye-Catching CAD/CHF Daily Price Action
    • The Pair's Critical Resistance Zone
    • 2 Potential Trade Triggers to Watch for


    This week’s surprise rate cut by the European Central Bank (ECB) has sent currencies running in various directions. In spite of this, the movement has actually cleared the decks a little, breaking various stalemates between bulls and bears. CADCHF is one such example.
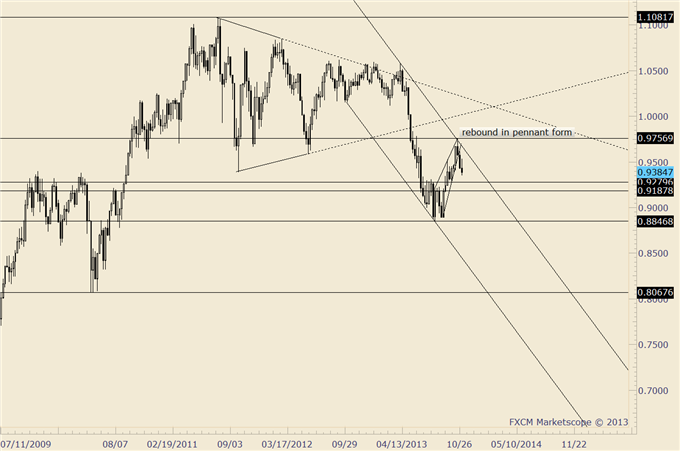
    The downtrend on the weekly chart (see below) is clear, and prices are now pulling back in a countertrend movement that traders can use in hopes of getting another move down.

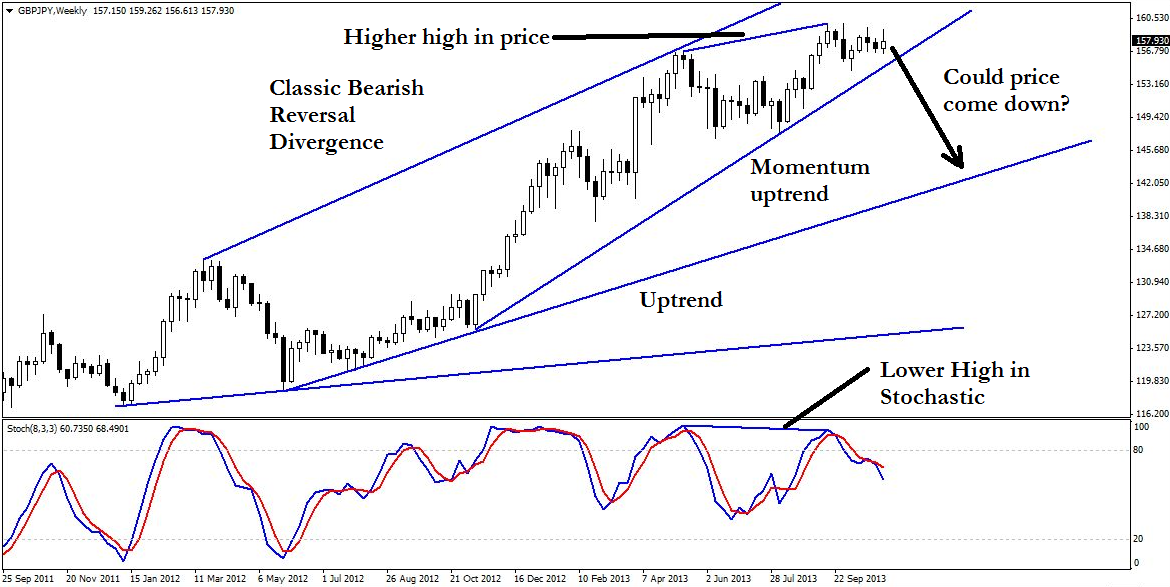
    Guest Commentary: Clear Weekly Downtrend in CAD/CHF


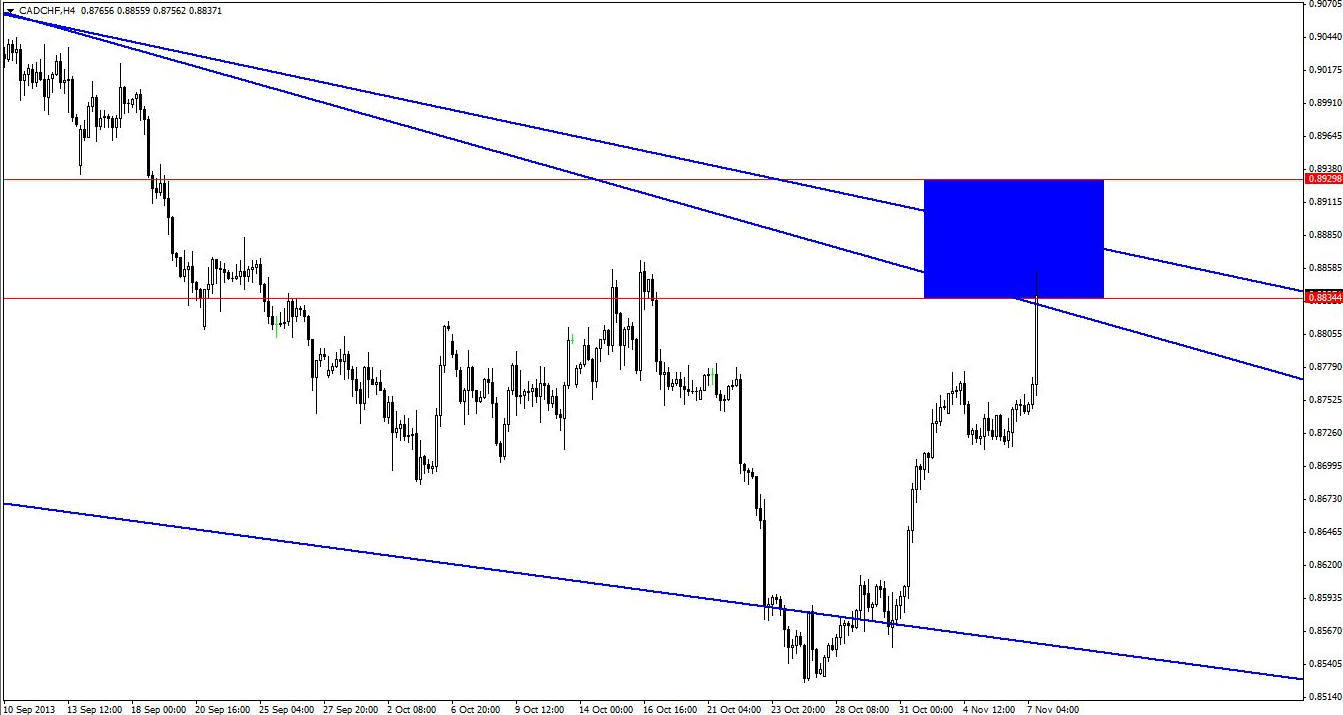
    The daily chart below provides a picture of definite interest. Price is now heading up to the test the resistance zone formed by two trend lines. The initial question, however, is which trend line should be seen as the dominant one?

    Guest Commentary: Dueling Trend Lines on CAD/CHF Daily Chart


    Different traders will favor different ones, and there’s plenty of variety not shown above. The essential point, however, is that the two trend lines taken together identify a range of resistance that could kick in to limit the upward thrust in CADCHF.
    The four-hour chart below provides an even better look at the key zone of resistance, and an estimate of those trend lines plus an upside buffer due to the speed of the news-powered movement makes the key zone of interest 0.8834-0.8929.

    Guest Commentary: The Critical CAD/CHF Resistance Zone


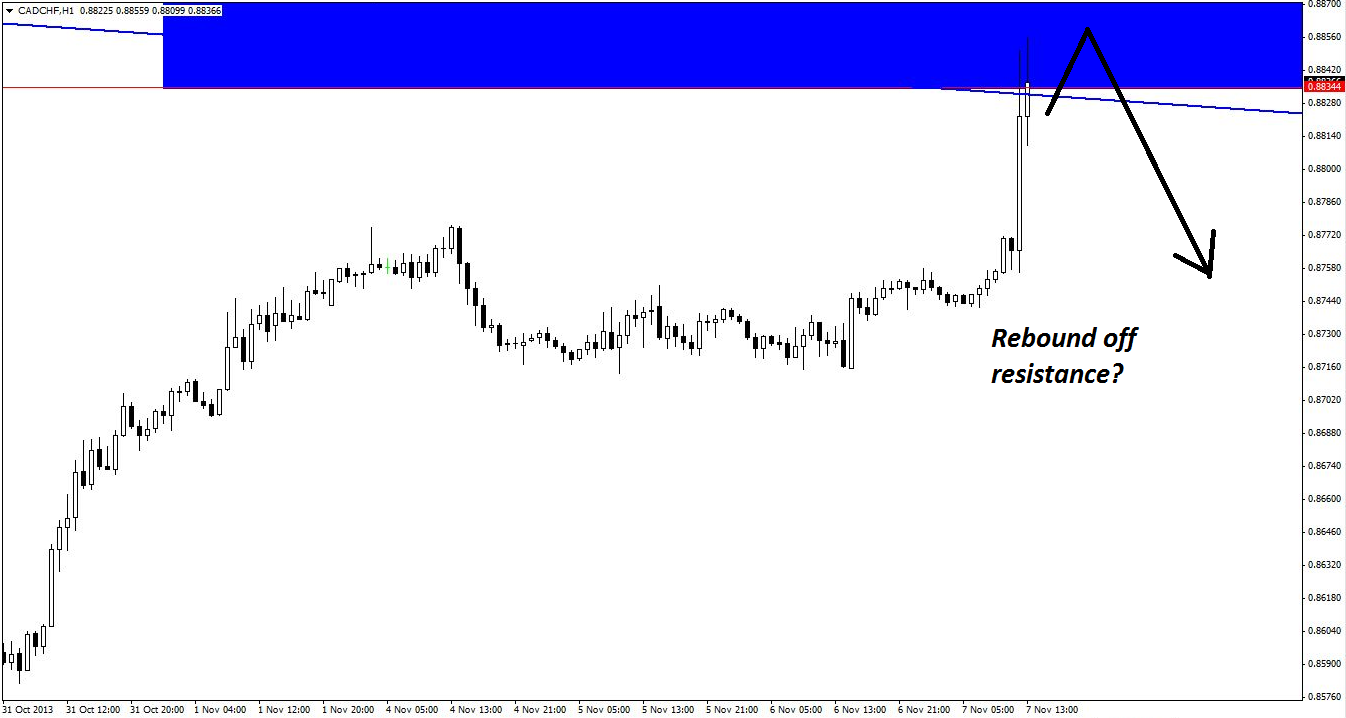
    Whether or not this zone will hold ultimately remains to be seen, but what is really needed is a reliable reversal pattern on the CADCHF hourly chart.

    As seen below, the hourly chart has (at the time of writing) already begun to test resistance. As the markets are adjusting to a news shock, a reliable trigger will be needed, the most likely of which would be a pin bar (or bearish engulfing candlestick, which is less likely). Should this occur, price will likely hesitate and wind sideways.

    Guest Commentary: 2 Potential CAD/CHF Trade Triggers


    This would signal an entry only for bold or very skilled traders. It’s tradable, but requires nimble exit work should it start to fail.

    More conservative traders would be advised to skip that signal and wait for price to climb a little higher, even if it takes a few more hourly bars. At that point, it should form a slower and more pronounced reversal pattern, probably one that’s even supported by reversal divergence. That would be the safer trade.

    Even then, CADCHF may not do much more than idle sideways, but this would afford plenty of time to get out, unlike the earlier scenario. Of course, the hope is that there is a strong reaction off the overhead resistance zone, which would result in an early short entry on a downside trend trade.

    By Kaye Lee, private fund trader and head trader consultant, StraightTalkTrading.com

    More...

  2. #302
    member TechnoMeter's Avatar
    Join Date
    Apr 2013
    Posts
    1,636
    Blog Entries
    421

    Forex: USD/JPY Technical Analysis

    Talking Points

    • Prices continue to consolidate above trend line support set from June (97.34)
    • A break downward exposes swing lows at 96.93 and 96.55
    • Resistance is at 98.75 (range top); a break higher targets 99.74 (trend line)


    --- Written by Ilya Spivak, Currency Strategist for DailyFX.com

    More...

  3. #303
    member TechnoMeter's Avatar
    Join Date
    Apr 2013
    Posts
    1,636
    Blog Entries
    421

    A Tempting GBP/JPY Trade You Shouldn’t Touch

    Talking Points:

    • Strong Initial Case for the Short Side
    • 2 Good Reasons Not to Short GBP/JPY
    • A Long Set-up to Consider Instead


    GBPJPY has quite a reputation in the industry for eating unwary traders alive, and it may be at it again. The daily chart has presented a seemingly valid countertrend short opportunity, as shown below.

    Guest Commentary: Case for a Daily GBP/JPY Short


    Quite a few factors are present here that could prompt traders to short the market, including:

    • A valid line of resistance provided by the downward-sloping trend line, and;
    • A bearish engulfing pattern that practically jumps off the chart at you


    And, on the weekly chart below, there is a classic bearish reversal divergence, which happens to be one of the signals that helped validate our NZDJPY trade from earlier this week.

    Guest Commentary: Weekly GBP/JPY Bearish Reversal Divergence


    So why hesitate to take this trade?

    The first and most obvious argument would be that it is countertrend in nature, which is clearly visible on the weekly chart. Now, some traders may argue that the reversal divergence pattern is a case for going short, and that is true, but the effect of Stochastic divergence is typically good for only, say, five to eight bars.
    It could well give one more swipe to the downside, but the shallow, sideways motion is a signal that must be respected. If bears cannot push price down even with the help of divergence, then there is a good chance that the bulls might come in with a surprise move up.

    Even on the daily chart, pattern traders will recognize the triangle consolidation pattern, which, although symmetrical, is biased to the upside due to the major upward move that preceded it.

    The second argument against the GBPJPY short trade is that there are rising trend lines on the daily chart which are very close to the bearish engulfing formation. Even if the trade triggered and managed to push through one or two of them, it would be fighting nearly all the way. In short, there is just not much room to move.

    So, despite what on the surface seems like a viable short set-up, the better bet is to trade with the trend, as is always the case. While trends break all the time, the probability of a trend trade being profitable is much better.

    It’s not to say that the bearish engulfing pattern set-up won’t work, because it most certainly could, but under the circumstances, a long position would be much more preferable, and there just so happens to be one setting up!

    The Preferred GBP/JPY Trade: Going Long

    To identify an optimal buy zone for GBPJPY, we move down and look at price action on the four-hour chart, where a zone of support has been estimated near the rising support trend line on the daily triangle pattern occurring between 156.08 and 156.83.

    The exact zone, particularly the higher value, is supported by previous bounces in that location, and is easily visible when looking at the red, horizontal level on the chart.
    Guest Commentary: The GBP/JPY Trade That’s Worth Taking


    Due to the downward momentum move from yesterday (Nov. 7), a little more leeway has been given than usual. Hence, the support zone has approximately 80 pips, which is just slightly smaller than the pair’s current daily average true range (ATR) of 90 pips.

    The ideal trade would be for price to head downwards, giving some kind of reversal pattern on the hourly chart, which could include a pin bar, a bullish engulfing pattern, or a bullish reversal divergence.
    Given that this is a sideways price-motion chart on the daily, a lot of choppiness is to be expected within the triangle. That actually works in the favor of the long trade since it is possible to bank quite a few pips before price will even have to contend with upside resistance.

    The GBPJPY’s notorious tendency to snap back and forth is a definite plus should this trade develop, as it could well turn profitable quickly. That’s assuming, of course, that it does not decide to take a bite at the stop loss first, but given the overall set-up, this is a calculated risk that’s worth taking.
    By Kaye Lee, private fund trader and head trader consultant, StraightTalkTrading.com

    More...

  4. #304
    member TechnoMeter's Avatar
    Join Date
    Apr 2013
    Posts
    1,636
    Blog Entries
    421

    The Importance of Gaps and Trading Australian Dollar Crosses

    • EURUSD and USDJPY; mind the gaps!
    • Australian Dollar breaking down
    • Exploring exotic opportunities


    EUR/USD
    Daily


    -EURUSD has broken the trend channel that defines action from the July low.
    -Significant levels (the channel in the current situation) are sometimes re-tested from the opposite side of the market. The underside of the channel crosses about 1.3475 to 1.3510 next week.
    -The previously uncovered 9/13 close was filled on Thursday and the EURUSD made an inside day on Friday. This combination is short term bullish.
    Trading Strategy: I do not have a position at the moment. A week or so of upside into 1.3475-1.3510 might offer an opportunity to get short though.

    USD/JPY
    Daily


    -USDJPY traded above 99 (Oct high) and into the previously uncovered 9/20 close on Thursday. There is an uncovered close from the 10/25 close at 97.37.
    -Kristian Kerr and I spoke at length about JPY and AUD during a ‘ on Thursday. Important levels on a daily closing basis are 99 and 96.50 (October range).
    Trading Strategy: “This market is coiled for a big move to end the year. Triangles are usually continuation patterns but it’s possible that the eventual break ‘surprises’ to the downside. We’ll trade it either way when it’s ready.” Apparently, the market is not ready. Remember, 96.50 and 99 on a daily closing basis need to be seen before we can even think about participating. Even then, a proper setup is required. What constitutes a proper setup? A break of support/resistance and re-test of that level from the opposite of the market tend to offer the best reward/risk entries.

    AUD/USD
    Weekly


    -AUDUSD has followed through on the reversal that ended the week of 10/25. 10/23 was the day of the top and an outside day reversal formed that day.
    -Bigger picture, the market broke from a symmetrical triangle the week that ended 5/17/2013. The recent top is just pips from that close level (with an outside day reversal on 10/23) and right at channel resistance.
    -The rally from the June low forms 2 converging lines and can be called a pennant. These patterns are often seen in the early stages of large bear markets.
    Trading Strategy: Currently short. Original stop was .9550. Stop has been lowered to .9375. .9190-.9300 could produce consolidation / corrective activity.

    --- Written by Jamie Saettele, CMT, Senior Technical Strategist for DailyFX.com


    More...

  5. #305
    member TechnoMeter's Avatar
    Join Date
    Apr 2013
    Posts
    1,636
    Blog Entries
    421

    Forex: GBP/USD Technical Analysis

    Talking Points

    • A bearish Dark Cloud Cover candle pattern marked a turn lower, as expected
    • Support is at 1.5918 (23.6% Fib ret.); resistance is at 1.6169 (trend line from Jul’13)
    • Break higher targets 1.6235 (23.6% Fib exp.), below support eyes 1.5707 (38.2% Fib ret.)


    --- Written by Ilya Spivak, Currency Strategist for DailyFX.com

    More...

  6. #306
    member TechnoMeter's Avatar
    Join Date
    Apr 2013
    Posts
    1,636
    Blog Entries
    421

    EUR/USD Resistance Surrounds 1.3500 the Rest of the Week

    Daily


    -EURUSD has broken the trend channel that defines action from the July low. My interpretation of this development is that the major trend has turned at least sideways, and maybe down (see the recent writing on false EURUSD bullish breaks in recent years).
    -Significant levels (the channel in the current situation) are sometimes re-tested from the opposite side of the market. The underside of the channel crosses about 1.3485 to 1.3510 the rest of this week.
    -The previously uncovered 9/13 close was filled on Thursday and the EURUSD made an inside day on Friday. This combination is short term bullish.

    Trading Strategy: I do not have a position at the moment. Watch for resistance around 1.3500. I do remain long EURAUD. See the AUDUSD section for more.
    LEVELS: 1.3296 1.33171.3355 | 1.3440 1.3472 1.3521


    More...

  7. #307
    member TechnoMeter's Avatar
    Join Date
    Apr 2013
    Posts
    1,636
    Blog Entries
    421

    US Dollar Moves to Overturn Four-Month Down Trend

    Talking Points:

    • US Dollar Channel Break Would Overturn 4-Month Downtrend
    • S&P 500 Looking for Direction Cues Below October Swing High
    • Gold at Risk of Deeper Losses, Crude Oil Rebounds as Expected


    S&P 500 TECHNICAL ANALYSIS – Prices are struggling to build lower after putting in a Bearish Engulfing candlestick pattern but the pattern remains valid absent a daily close above 1778.90, the October 30 high. Initial support is at 1747.70, the 23.6% Fibonacci retracement, with a break below that targeting the 38.2% level at 1728.50.


    GOLD TECHNICAL ANALYSIS – Prices broke below support at 1292.15, the 38.2% Fibonacci expansion, exposing the 50% level at 1270.67. A further push beneath that eyes the 61.8% Fib at 1249.18. Alternatively, a turn back above 1292.15 targets the 23.6% expansion at 1318.73.


    CRUDE OIL TECHNICAL ANALYSIS – Prices broke higher as expected after showing a Bullish Engulfing candlestick pattern, taking out falling trend line resistance to expose the top of a falling channel set from early September at 97.09. Alternatively, a turn back below the trend line (now at 93.77) targets the November 5 low at 93.09.


    --- Written by Ilya Spivak, Currency Strategist for DailyFX.com

    More...

  8. #308
    member TechnoMeter's Avatar
    Join Date
    Apr 2013
    Posts
    1,636
    Blog Entries
    421

    GBP/USD Penetrates Multi-Month Range and Closes Sep Gap

    Daily


    -GBPUSD broke the trendline that originates at the July low on 10/29. The line connects the 7/9 and 8/2 lows and crosses through several days in mid-October. This development is an early sign that the entire advance is complete.
    -Price traded to its lowest since 9/13, filling the previously uncovered close from that date in the process. Today’s close is the lowest since 9/17.
    Trading Strategy: The break of the range warrants a short position. The stop is above Monday’s high of 1.6020. The measured objective is 1.5530 (width of range extended from the range low).
    LEVELS: 1.5717 1.5774 1.5853 | 1.5945 1.5992 1.6009


    More...

  9. #309
    member TechnoMeter's Avatar
    Join Date
    Apr 2013
    Posts
    1,636
    Blog Entries
    421

    Forex: EUR/GBP Technical Analysis

    Talking Points

    • Prices launched a spirited recovery from support at 0.8332, the October 1 low
    • A break above resistance at 0.8442 (50% Fib ret.) exposes 0.8475 (61.8% Fib)
    • Reversing back below 0.8442 aims for 0.8408 (38.2% Fib retracement)


    --- Written by Ilya Spivak, Currency Strategist for DailyFX.com

    More...

  10. #310
    member TechnoMeter's Avatar
    Join Date
    Apr 2013
    Posts
    1,636
    Blog Entries
    421

    EUR/USD Focus Remains Towards Breakdown Level for a Short

    Daily


    -EURUSD has broken the trend channel that defines action from the July low. My interpretation of this development is that the major trend has turned at least sideways, and maybe down (see the recent writing on false EURUSD bullish breaks in recent years).
    -Significant levels (the channel in the current situation) are sometimes re-tested from the opposite side of the market. The underside of the channel crosses about 1.3500 to 1.3510 the rest of this week.
    -The previously uncovered 9/13 close was filled on Thursday and the EURUSD made an inside day on Friday. This combination is short term bullish.
    Trading Strategy: I do not have a position at the moment. Watch for resistance around 1.3500. I do remain long EURAUD.

    LEVELS: 1.3296 1.33551.3410 | 1.3470 1.3500 1.3547


    More...

Page 31 of 81 FirstFirst ... 21 29 30 31 32 33 41 ... LastLast

Tags for this Thread

Bookmarks

Posting Permissions

  • You may not post new threads
  • You may not post replies
  • You may not post attachments
  • You may not edit your posts
  •