Page 30 of 81 FirstFirst ... 20 28 29 30 31 32 40 80 ... LastLast
Results 291 to 300 of 809
Like Tree6Likes

Technical Analysis

This is a discussion on Technical Analysis within the Forex Trading forums, part of the Trading Forum category; Talking Points: The "Battleground" Where the Trade Will Develop A 2-Part Strategy for Playing it An Ideal Entry Signal for ...


  1. #291
    member TechnoMeter's Avatar
    Join Date
    Apr 2013
    Posts
    1,636
    Blog Entries
    421

    A GBP/NZD Long Trade with Lots to Like

    Talking Points:

    • The "Battleground" Where the Trade Will Develop
    • A 2-Part Strategy for Playing it
    • An Ideal Entry Signal for GBP/NZD Longs


    With markets running at full tilt, finding good trades can be tricky. For the most part, it is wiser to be more wary of initiating longer-time-frame trades at this point, as most instruments are either far from their turning points, or are charging towards them with too much momentum for comfort. One possible exception to this condition is GBPNZD, which may soon present a trading opportunity on the hourly charts.

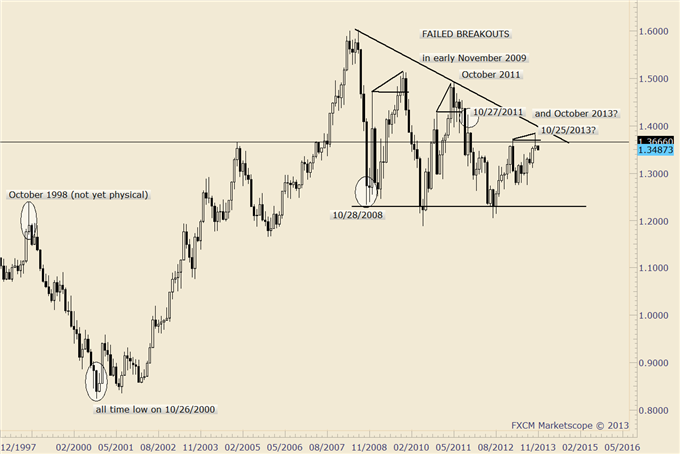
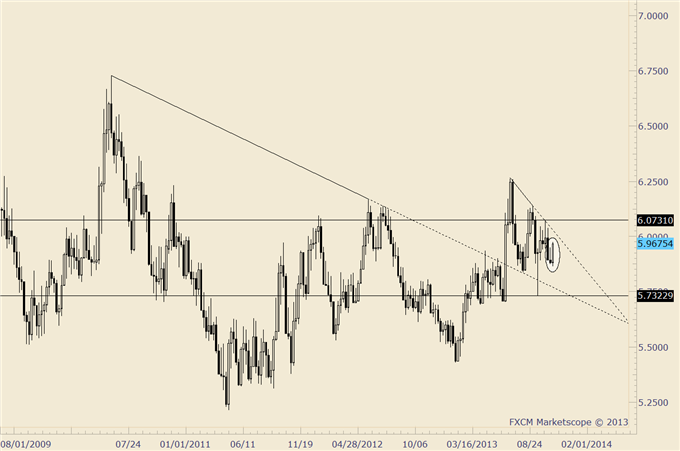
    As shown below, the daily chart is in a downtrend, although it is far from clear. That downward channel is contained by a larger sideways pattern. Thus, both longs and shorts may be viable.

    Guest Commentary: A Developing GBP/NZD Long Set-up


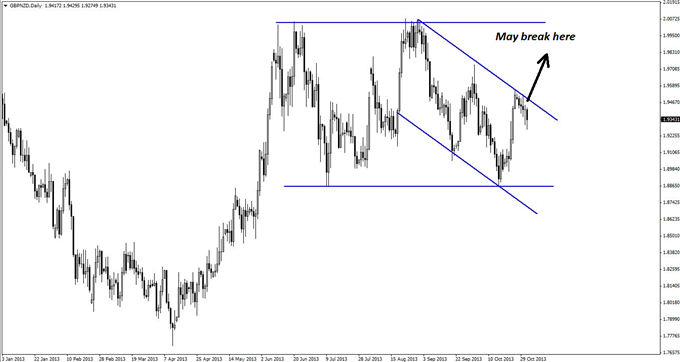
    At this point, the clue that gives us hope of a larger move is that prices have not been significantly pushed down by the top of the declining channel. This shallow move may develop into a larger move up towards the horizontal resistance, as marked.

    However, at this point, a long would be (relatively mildly) counter to the daily trend, and a higher level of precision is desirable.

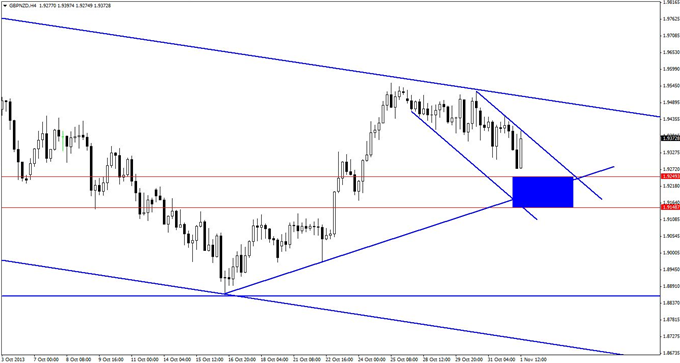
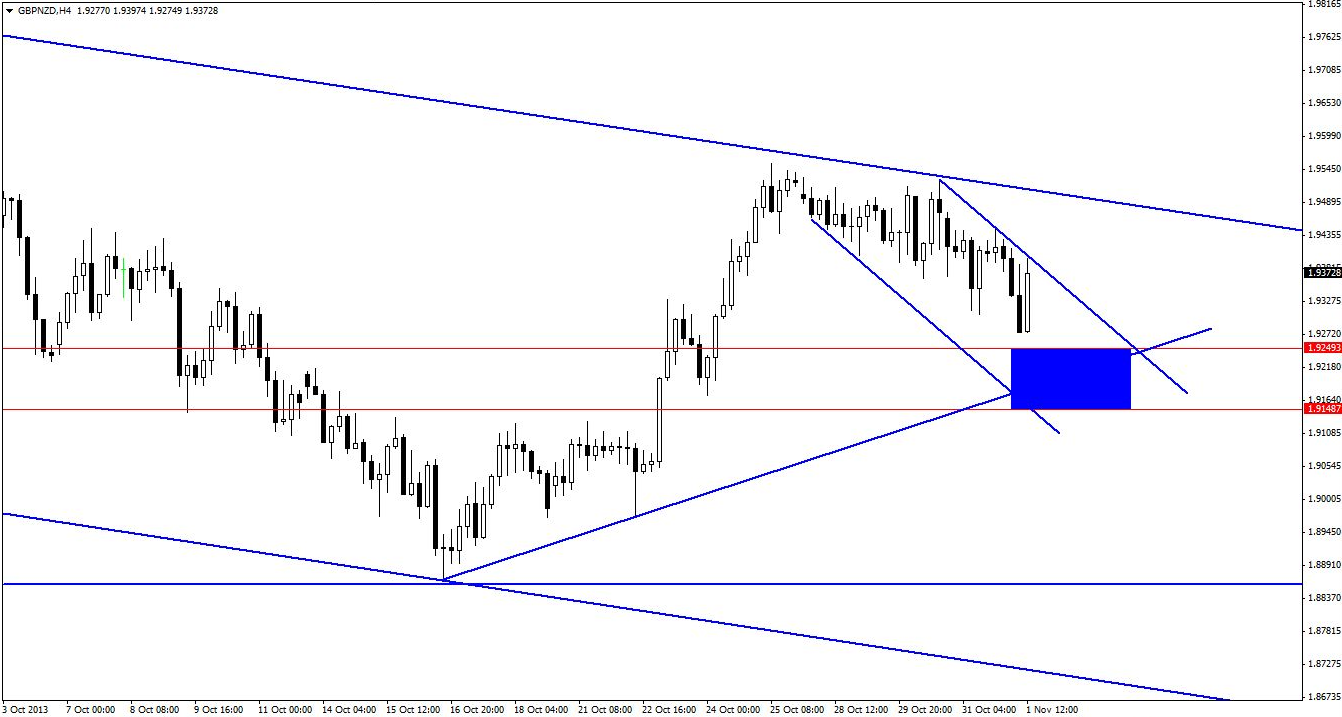
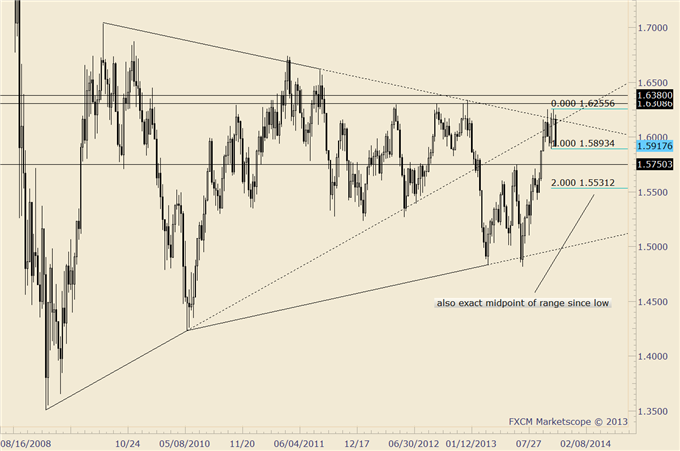
    The four-hour chart below presents a unique intersection of a declining channel and a rising trend line, which allows an estimated zone of resistance in the area of the 1.9148-1.9249. This will be the battleground upon which the next major price movement will likely be decided.

    Guest Commentary: The Critical Resistance Area for GBP/NZD


    However, as previously noted, the daily momentum is slightly down. Thus, traders who choose to go long in this zone would be well-advised to divide their trades into two portions, one short-term and one long-term position.

    The short-term position should be a scalp-type trade, and one to be exited at the first sign of trouble. The longer-term position should be held onto if price rallies aggressively from this level in hopes of getting a better trade.

    A few questions are likely to arise regarding this trade scenario, and the first would be whether it matters if the declining channel on the four-hour chart was broken before the support zone was tested. As the support is largely estimated from the rising trend line, the answer would be "no." This set-up would be viable regardless of whether the channel remained intact.
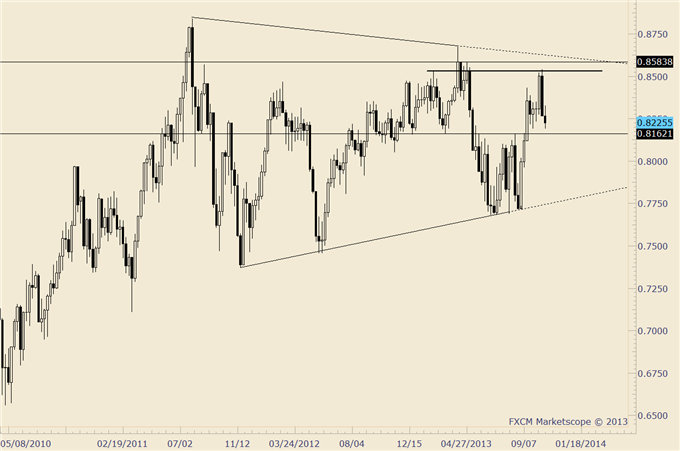
    The next question would be regarding a logical entry strategy, and for help with this, we turn to the hourly chart. As seen below, there is clear evidence that there are buyers in this market, even though the sellers are stronger. This can be seen by the cyclic, or wavy, movement of price towards the support zone.

    Guest Commentary: The Ideal Entry Signal for GBP/NZD


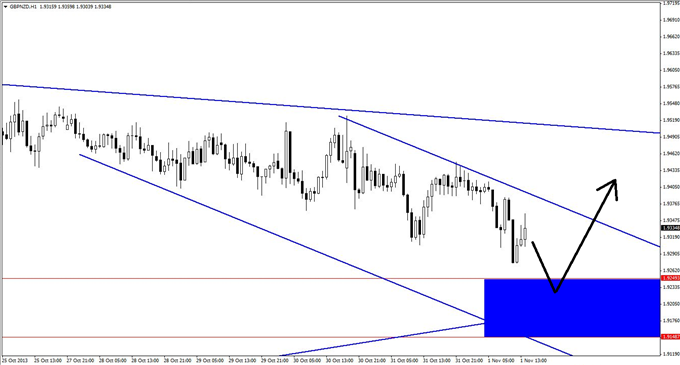
    The fact that the rallies, although producing lower highs, are actually quite large, is very encouraging. In fact, one of the most attractive points about this trade is the fact that it presents a high-probability scalp scenario where a trader could grab some quick profits in the short term (which would turn the overall trade to breakeven quickly) and then hang on to see if a larger move develops for the longer-term position.

    Thus, the ideal entry signal would be some type of bullish reversal divergence once the pair reaches the highlighted range on the hourly chart.
    By Kaye Lee, private fund trader and head trader consultant, StraightTalkTrading.com


    More...

  2. #292
    member TechnoMeter's Avatar
    Join Date
    Apr 2013
    Posts
    1,636
    Blog Entries
    421

    Dollar Rally a Harbinger of Things to Come? Here are Trade Setups

    • Largest 1 week EURUSD decline in over a year.
    • Major NZDUSD triangle in the works?
    • USDNOK setting up for major move


    EUR/USD
    Monthly


    -The EURUSD registered its largest one week decline (open to close) since the week that ended 7/6/2012. October is no stranger to important EURUSD market turns. My colleague Kristian Kerr has discussed the importance of ‘anniversary dates’. The all-time EURUSD low occurred on 10/26/2000 and the high last month was on the 25th. Other important Octobers include the 1998 high (rates were being set), 2008 (the low was on the 28th) and 2011 (the high was on the 27th).
    -Generally speaking, lower tops from the 2008 high and lows in the same area form a possible descending triangle (typically bearish).
    -The failed break above the February high is a bull trap. We’ve seen this before. In fact, such trade has become standard procedure in this market since 2009. The 2009 high occurred on November 4th.
    -Near term supports for a bounce are the June high at 1.3415 and the August high at 1.3451. Watch specifically for a EURUSD print below the October low of 1.3472 WITHOUT a USDCHF print above its October high of .9177.

    Trading Strategy: Order to short at 1.3565, stop 1.3610 (above the first day of the month high). Target half at 1.3300 (just above midpoint of year’s range). There is an uncovered close at 1.3296 (9/13).

    GBP/USD
    Weekly


    -GBPUSD weakness below 1.5893 would confirm a double top. The measured objective would be 1.5531 (width of range subtracted from 1.5893). 1.5531 is also the exact midpoint (50% retracement) of the rally from the July low. Be aware of the June high at 1.5750 as possible support. There is also an uncovered close at 1.5876 (9/13)
    -1.5950/70 is viewed as near term resistance.

    Trading Strategy: Daily Technicals have been short since 10/21. The first target was reached at 1.5960. The stop on the rest is trailed to 1.6060 (above first day of month high) with a 1.5540 limit.

    AUD/USD
    Weekly


    -AUDUSD followed through on last week’s key reversal.
    -The market broke from a symmetrical triangle the week that ended 5/17/2013. The recent top is just pips from that close level (with an outside day reversal on 10/23) and right at channel resistance.
    Trading Strategy: I screwed this one up by exiting a short on Thursday. A short bias is warranted against .9525 towards the October low. Exceeding that level could offer an entry opportunity in the .9570-.9600 region.

    NZD/USD
    Weekly


    -NZDUSD followed through on last week’s outside week reversal. Bigger picture, a triangle may be in the works from the 2011 high. See the above chart in the AUDUSD to understand that the eventual break of a triangle doesn’t have to be in the direction of the previous trend (despite the contention of many…the same goes for the USDJPY by the way…the eventual break could go either way).
    -Possible support is seen from former resistance between .8105 and .8162. There is an uncovered close at .8133 (9/13).

    Trading Strategy: Daily Technicals is short from .8285 with a breakeven stop. Exceeding .8315 could offer an entry opportunity in the .8350-.8430 region.

    USD/NOK
    Weekly


    -USDNOK broke above a 3 year trendline in June. The topside of that line was tested as support in September (the test was in the form of a spike on ‘no-taper’).
    -A trendline crosses the tops (exactly) of 7/5, 9/5, and 10/10. Watch for a break above that line and re-test of the top side of that line as support.
    -A close up view of the outside week action reveals an impulsive advance from the 10/30 low and therefore an opportunity to buy a corrective decline.
    Trading Strategy: Order to go long at 5.9200, stop 5.8600. If not triggered, then will look to position on a breakout and re-test of the mentioned trendline.

    --- Written by Jamie Saettele, CMT, Senior Technical Strategist for DailyFX.com

    More...

  3. #293
    member TechnoMeter's Avatar
    Join Date
    Apr 2013
    Posts
    1,636
    Blog Entries
    421

    Forex: USD/CAD Technical Analysis

    Talking Points

    • A bearish Evening Star candle pattern hints a turn lower is ahead
    • Breaking support at 1.0422 (23.6% Fib ret.) would expose 1.0376 (38.2% Fib)
    • Trend line support-turned-resistance is now at 1.0489


    --- Written by Ilya Spivak, Currency Strategist for DailyFX.com

    More...

  4. #294
    member TechnoMeter's Avatar
    Join Date
    Apr 2013
    Posts
    1,636
    Blog Entries
    421

    A NZD/JPY Set-up That’s the Best of the Bunch

    Talking Points:

    • Divergence Signals Potential for Reversal
    • 2 Most Likely Scenarios for NZD/JPY
    • The NZD/JPY Entry Signal to Watch for


    Most major currencies are consolidating and taking their breaths after last week’s major moves. This would normally mean a better market for the crosses, but in this case, the moves have confused those markets as well. In light of that, the takeaway is clear: Trade with caution.
    That said, the best response to this environment is to continue to take trades, knowing that although they have lower probability, the price of not taking them could well be missing the one trade that does shoot in our direction. It’s my belief that NZDJPY could be that one favorable trade scenario.
    As shown below, the weekly chart of NZDJPY is an uptrend, and the most interesting thing about this chart is the divergence that formed two weeks prior.

    Guest Commentary: Bearish Reversal Divergence in NZD/JPY
    The large bearish engulfing candlestick is also indicative of some possible downward momentum. Since that original signal, we have not had any bearish candles on the weekly time frame. Given that a bearish reversal divergence scenario should generally produce sideways to bearish price action for the next few bars, this suggests that we may stand to catch the high of this week’s bar, and wouldn’t it be nice if it turned out bearish, too?
    On the daily chart (see below), there are two scenarios that are most likely to develop from this point on, although that’s not to say that they are the only possible scenarios.

    • Price goes to test the underside of the broken trend line and then races down to test the longer-term trend line
    • Price ignores the trend line and goes into a range type of motion before continuing on its way


    Guest Commentary: The 2 Most Likely NZD/JPY Scenarios


    Again, there is a multitude of other possibilities, but these two show extremes of what could go right with this trade and what could go wrong. It is highly dependent on the weekly chart’s reversal divergence coming back into force.

    As always, uncertain trades call for hair-trigger entries, and for that, it pays to use the lower time frames.

    The four-hour chart below provides a set of resistance levels that, when taken together, form a zone. Two levels were taken off pin bars from the previous upward move, as marked. The resistance in between them is the 50% Fibonacci retracement level. Together, these levels should form a zone at least strong enough to cause a reasonable reversal on the hourly charts.
    As a bonus, the Stochastic is overbought, as price is heading up to the resistance zone, allowing for reasonable downside.

    Guest Commentary: The NZD/JPY Entry Signal to Watch for


    The trade should be taken on the hourly chart as price gets into the price zone and shows signs of slowing down, usually through some form of reversal divergence.
    In these markets, the wise thing to do would be to divide the trade into a short-term position and a long-term position. The short-term trade should be taken off at the first sign of trouble on the hourly charts, and the longer term trade—once risk has been reduced or eliminated through the short-term component—should be trailed less aggressively in hopes of possibly catching a very large move, should it develop.

    By Kaye Lee, private fund trader and head trader consultant, StraightTalkTrading.com


    More...

  5. #295
    member TechnoMeter's Avatar
    Join Date
    Apr 2013
    Posts
    1,636
    Blog Entries
    421

    Forex: USD/CAD Technical Analysis

    Talking Points

    • A bearish Evening Star candle pattern hints a turn lower is ahead
    • Breaking support at 1.0422 (23.6% Fib ret.) would expose 1.0376 (38.2% Fib)
    • Trend line support-turned-resistance is now at 1.0493


    --- Written by Ilya Spivak, Currency Strategist for DailyFX.com

    More...

  6. #296
    member TechnoMeter's Avatar
    Join Date
    Apr 2013
    Posts
    1,636
    Blog Entries
    421

    The Triple-Bottom Trap and How to Dodge it

    Talking Points:

    • The Triple-Bottom Pattern in EUR/USD
    • Practical Application of Elliott Wave
    • The Right Way to Trade a Triple Bottom


    Last week’s Federal Open Market Committee (FOMC) meeting caught many currency traders on the wrong side of the US dollar (USD) trade, and it cost them dearly! With the Fed’s exclusion of a small phrase pertaining to tightening fiscal conditions, the markets quickly priced in a reduction of bond purchases at the December FOMC meeting, and the dollar soared in response. However, those who didn’t have a EURUSD short at work prior to the announcement had a tough time finding a safe entry.

    The six-hour EURUSD chart (see below) plummeted towards the 1.3470 double bottom that was formed in October, thus setting up a possible triple bottom. In my experience, triple bottoms rarely hold and reverse the market. More times than not, triple bottoms wind up failing and breaking to new lows, but here’s the trick: Never trade the first test of a triple bottom. Instead, wait for a completed Elliott wave corrective rally to position a trade for the attack—and ultimate defeat—of the triple bottom.

    Guest Commentary: The Triple-Bottom Pattern in EUR/USD


    Using Elliott Wave to Trade the Real Break of the Triple Bottom

    Moving back to the EURUSD example, the FOMC meeting (yellow label) dropped the pair quite sharply in a third wave (green labels) of a five-wave Elliott trend. Just as we would expect, the initial test of the 1.3470 triple bottom held support and put in a short-term bounce, which we can identify as a fourth-wave correction of a five-wave Elliott trend.
    If we can time it right, we can use Fibonacci to pinpoint the zone where this bounce from doomed support will terminate, thus setting up a wave-five slide to new lows.

    Guest Commentary: The Key EUR/USD Resistance Zone


    At this point, I’m going to get into some of the finer points of Elliott wave to set up the trade. In future articles, we will dig deeper and study how to do this for yourself. To begin, we need to construct FRZs, or Fibonacci Resistance Zones, which should capture the end of the green wave four (W4).

    1.3573: 38% price retracement of green W.3
    1.3572: 261.8% projection of on-going green W.4 compared to same-degree W.2
    1.3565: Typically, fourth waves will terminate at the area of the prior fourth wave of one lesser degree. Green W.4 will test the prior fourth wave (orange) at 1.3565
    1.3523: 23.6% price retracement of green W.3
    1.3522: 261.8% projection of ongoing green W.4 compared to same-degree W.2

    How to Properly Trade This Triple Bottom

    Traders who are not armed with the tools to correctly trade for the break of the key 1.3470 level are being stopped out right now. They tried their best to align themselves with the trend and went short EURUSD a few days too early, only to watch the pair climb back above 1.3470 on this bounce. As their stop losses are being triggered, we are setting our sell limits to move into short positions.

    Sell half the position at 1.3520 and another half position at 1.3570 with stop losses at 1.3605. Book partial profits at 1.3450 and move the stop loss to breakeven.

    By Todd Gordon of TradingAnalysis.com


    More...

  7. #297
    member TechnoMeter's Avatar
    Join Date
    Apr 2013
    Posts
    1,636
    Blog Entries
    421

    Forex: USD/CAD Technical Analysis

    Talking Points

    • A bearish Evening Star candle pattern hints a turn lower is ahead
    • Breaking support at 1.0422 (23.6% Fib ret.) would expose 1.0376 (38.2% Fib)
    • Resistance is in the 1.0496-98 area (trend line from June low, Oct 30 high)


    --- Written by Ilya Spivak, Currency Strategist for DailyFX.com

    More...

  8. #298
    Junior Member
    Join Date
    Oct 2013
    Posts
    19
    Yep, the USD/CAD pair is likely to go down further. Thanks

  9. #299
    member TechnoMeter's Avatar
    Join Date
    Apr 2013
    Posts
    1,636
    Blog Entries
    421

    An AUD/JPY Trade with Huge Reward Potential

    Talking Points:

    • Hundreds of Pips at Stake in AUD/JPY
    • A Surprisingly Small Risk Profile
    • 2 Potential Triggers for Taking This Trade


    In the case of AUDJPY, the potential reward on the weekly chart speaks for itself. Traders who catch that move early—should it develop—would stand to bank hundreds of pips. That being said, it pays to balance aspirations with careful analysis.

    Guest Commentary: AUD/JPY Trade with Huge Reward Potential


    The daily chart is showing another classic pattern whereby the rising trend line has just been broken and price is heading up to test it. With this type of motion, this trade is potentially even more attractive than AUDCHF, as it does not have the large momentum move to overcome.

    Guest Commentary: Key Trend Line on AUD/JPY Daily Chart


    The upward retest move has, so far, been tentative, suggesting that bears have an above-average chance of winning this tussle. Overall, the case for this trade is strong, and all that remains is to identify a calculated entry strategy.

    For that, we’ll look to the four-hour chart (see below), which provides plenty of resistance. Three levels that are in confluence with the broken trend line on the daily chart have been chosen, thus providing a resistance zone of 94.10-94.59.

    Guest Commentary: Potential AUD/JPY Trade Triggers


    It is even more encouraging to note the steady cyclical movement as price winds its way up to meet the identified level. This indicates healthy give and take between buyers and sellers, suggesting that even if the trade does not work out, there will at least be room to reduce risk by scaling out, moving stop losses, and, should price feedback become hostile, to exit for a smaller gain or loss.

    One possible trigger for this trade would be the end of a sudden, explosive upward thrust, culminating in a pin bar or bearish engulfing formation on the hourly chart. A second trigger would be a reversal divergence on the hourly chart as price slows down before rolling over.

    The risk on this trade is surprisingly minimal, but of course, it is still present. The danger comes if price bulldozes through the identified resistance zone and ignores the trend line altogether. This is possible, but given the evidence, it’s rather unlikely, and that small risk profile and huge potential reward makes this a very interesting trade indeed.

    By Kaye Lee, private fund trader and head trader consultant, StraightTalkTrading.com


    More...

  10. #300
    member TechnoMeter's Avatar
    Join Date
    Apr 2013
    Posts
    1,636
    Blog Entries
    421

    Forex: AUD/USD Technical Analysis

    Talking Points

    • Prices turned lower as expected after putting in a Bearish Engulfing candle pattern
    • Support is now at 0.9409 (38.2% Fib); breaking below that targets 0.9302 (50% Fib)
    • Above 0.9509-42 (channel bottom, Fib cluster) exposes 0.9714 (50% Fib from April high)


    --- Written by Ilya Spivak, Currency Strategist for DailyFX.com

    More...

Page 30 of 81 FirstFirst ... 20 28 29 30 31 32 40 80 ... LastLast

Tags for this Thread

Bookmarks

Posting Permissions

  • You may not post new threads
  • You may not post replies
  • You may not post attachments
  • You may not edit your posts
  •