Page 1 of 81 1 2 3 11 51 ... LastLast
Results 1 to 10 of 809
Like Tree6Likes

Technical Analysis

This is a discussion on Technical Analysis within the Forex Trading forums, part of the Trading Forum category; GBPUSD remains in uptrend from 1.4831, the fall from 1.5411 is likely consolidation of the uptrend. Support is at the ...


  1. #1
    member TechnoMeter's Avatar
    Join Date
    Apr 2013
    Posts
    1,636
    Blog Entries
    426

    Technical Analysis

    GBPUSD remains in uptrend from 1.4831, the fall from 1.5411 is likely consolidation of the uptrend. Support is at the lower line of the upward price channel on daily chart, as long as the channel support holds, the uptrend could be expected to resume, and another rise to 1.5600 area is still possible.On the downside, a clear break below the channel support will suggest that the upward movement from 1.4831 had completed at 1.5411 already, then the following downward movement could bring price to 1.4500 zone.For long term analysis, GBPUSD may be forming a cycle bottom at 1.4831 on weekly chart. Further rise towards 1.6000 could be expected over the next several weeks.


    More...
    mikesmith likes this.

  2. #2
    member TechnoMeter's Avatar
    Join Date
    Apr 2013
    Posts
    1,636
    Blog Entries
    426

    What I See in FX Market

    $EURUSD
    What Forex Target Traders See: We are currently sitting @ 1.3059 in a sideways move . We are looking at this current move as a bear flag so looking to get long near the .500 Fibo @ 1.2945 area but we could get a fall to the .618 @ 1.2900 before the bounce. We can see a head and shoulders pattern in force. The average (14 day) daily true range (ATR) for the pair currently is 109 pips
    .
    ——————————————————————————–
    $USDJPY
    What Forex Target Traders See: We are currently @ 99.50 on the 3rd wave R5 resistance and need a correction before looking again to longs. We will need to get a pullback hopefully to the .618 fibo @ 98.83 since the Day chart top is @ 99.97. If the market corrects we will look to going long to the first wave R7 resistance @ 102.43. The average (14 day) daily true range (ATR) for the pair currently is 157 pips.*

    ——————————————————————————–
    $GBPUSD
    What Forex Target Traders See: Cable is currently @ 1.5233. We are looking for a continuation to the S4 support @ 1.5179 and then further to the S6 @ 1.5027. There is day chart trend line bisecting this so watch for a bounce there. The average (14 day) daily true range (ATR) for the pair currently is 118 pips.

    ——————————————————————————–
    $AUDUSD – A great smooth currency for Newbie’s!
    What Forex Target Traders See: Aussie is currently @ 1.0288 –in a descending wedge pattern which is bearish. We are bouncing on the .382 fibo which could be a bounce point. We expect a break down to the day chart bottom @ 1.0182 and then a bounce since the ozzie is in a big sideways move on the day chart. The average (14 day) daily true range (ATR) for the pair currently is 95 pips.


    More...
    mikesmith likes this.

  3. #3
    member TechnoMeter's Avatar
    Join Date
    Apr 2013
    Posts
    1,636
    Blog Entries
    426

    EURUSD - Slow upwards movement expected this week

    Elliott Wave Forex

    Be ahead of the Pack. Know tomorrow's price movements TODAY. Full charts and videos by experts analysts.
    The pair did not move lower as our previous analysis expected. We did however see the pair move higher as was expected for later in the week and this has resulted in the wave count staying the same for the new analysis with minor updates.
    8 Hourly Count: Main
    - Invalidation Point:1.30013
    - Confirmation Point:1.31290 (Increase in confidence)
    - Upwards Target:1.32924
    - Wave number: c Orange
    - Wave structure: Motive
    - Wave pattern: Ending Diagonal
    Elliott Wave chart analysis for the EURUSD for 19 April, 2013.

    The 8 hourly count expects waves (w) and (x) green are complete within the combination expected for wave ii pink.
    Within wave (y) green waves a and b orange are seen as complete and upwards movement within wave c orange is expected.
    Movement above 1.31290 would provide an increase in confidence for this wave count.
    At 1.32924 wave c orange would reach 1.618 the length of wave a orange. This target falls between the .5 and .618 retracement of wave i pink. We need to keep in mind that at this early stage wave c orange may unfold as an ending diagonal which may cause it to fall short of the upwards target.
    Movement below 1.30013 would invalidate this wave count as no second wave correction within wave c orange may move beyond the start of the first wave.


    More...

  4. #4
    member TechnoMeter's Avatar
    Join Date
    Apr 2013
    Posts
    1,636
    Blog Entries
    426

    EUR/USD: Short at 1.3080 for 1.2962 objective, stop 1.3133

    Majors

    EUR/USD: SHORT AT 1.3080 FOR 1.2962 OBJECTIVE, STOP 1.3133
    USD/JPY: LONG AT 97.76 FOR 100.43 OBJ, REVISED STOP 98.90
    GBP/USD: LOOK TO BUY NEAR 1.5176-99 AREA
    USD/CHF: BUY AT .9301 FOR .9413 OBJECTIVE, STOP .9274
    AUD/USD: SHORT AT 1.0345 FOR 1.0202; STOP AT 1.0369
    USD/CAD: LONG AT 1.0235 FOR 1.0343, STOP AT 1.0170
    Crosses

    EUR/JPY: AWAIT TRADE OPPORTUNITY, POSS BUY LOWER
    EUR/GBP: BUY AT .8540 FOR A .8685 OBJECTIVE, STOP AT .8485
    EUR/CHF: BUY AT 1.2164 FOR A 1.2218 OBJECTIVE; STOP AT 1.2148
    EUR/CAD: SHORT AT 1.3430 FOR 1.3200 OBJ, STOP 1.3540
    GBP/JPY: BUY AT 150.90 FOR 154.85, STOP AT 149.45
    NZD/USD: SHORT AT .8470 FOR A .8352 OBJECTIVE, STOP AT .8495


    More...
    mikesmith likes this.

  5. #5
    member TechnoMeter's Avatar
    Join Date
    Apr 2013
    Posts
    1,636
    Blog Entries
    426

    Daily Forex and Dow Jones Recommended Levels

    Several words about the EUR/USD future.
    Resistance (daily close) :
    1.3182, 1.3364, 1.3590 and 1.3778. After that 1.3958, 1.4186 and 1.4400. Break of the latter will give 1.4490, 1.4692

    More...

  6. #6
    member TechnoMeter's Avatar
    Join Date
    Apr 2013
    Posts
    1,636
    Blog Entries
    426

    EUR/USD: about to challenge 1.3000

    EUR/USD Current price: 1.3022

    View Live Chart for the EUR/USD


    Risk to the downside increases for the EUR/USD as the pair approaches latest low of 1.3001 posted last April 17th. With not much fundamental data behind and US Existing Home sales in a couple hours, the pair has been under selling pressure since early European opening, weighted by ECB’s Constancio comments regarding a possible rate cut from ECB next month. The hourly chart shows price well below 20 SMA while indicators head south below their midlines. In the 4 hours chart technical readings are also bearish, with momentum crossing the 100 level and RSI accelerating below 50. A break of 1.3000 should trigger stops and favor a stronger slide in the pair, with 1.2935 then at sight for today.
    Support levels: 1.3000 1.2970 1.2935
    Resistance levels: 1.3040 1.3070 1.3115*
    GBP/USD Current price: 1.2536

    View Live Chart for the GBP/USD (select the currency)

    Pound managed to bounce slightly higher from key 1.52 level against the greenback, but remains neutral according to the hourly chart, as price hovers around a flat 20 SMA as indicators lay around their midlines. In the 4 hours chart 20 SMA heads lower, crossing to the downside 200 EMA both around 1.5260 and offering strong resistance in case of further advance, while indicators head slightly lower right below their midlines. As long as below this 1.5260 level, the downside remains favored thus needing technical confirmation with a break below 1.5190 immediate support.
    Support levels: *1.5190 1.5150 1.5120
    Resistance levels: 1.5260 1.5295 1.5330
    USD/JPY Current price: 99.60

    View Live Chart for the USD/JPY (select the currency)

    After opening the week with a strong note, the USD/JPY has spent most of the past two sessions in a 20 pips range, again unable to take the 100.00 psychological level. Yen weakness has been supported by G20 statement welcoming BOJ ultra lose policy past Friday, yet the pair still refuses to take the 100.00 level. *The hourly chart shows indicators heading lower with momentum below 100 and RSI still above 50, suggesting not much selling interest around, while 100 and 200 SMA approach each other below current price. Downside corrective movements may gather momentum only on a break below 99.50 immediate support, although the movement will find strong buying interest if 98.80 area is reached.*
    Support levels: 99.50 99.20 98.80
    Resistance levels: 100.00 100.35 100.80
    AUD/USD: Current price: 1.0255

    View Live Chart for the AUD/USD (select the currency)

    The AUD/USD trades under pressure today, having posted a daily low of 1.0250 and consolidating nearby ahead of the US opening. The hourly chart shows price limited to the upside by a bearish 20 SMA, while indicators head south below their midlines, all of which supports a downward continuation. In the 4 hours chart technical readings are also biased lower, with fresh lows anticipating a run towards 1.0100 over the upcoming sessions.
    Support levels: 1.0260 1.0220 1.0180
    Resistance levels: 1.0300 1.0335 1.0380*
    New to Forex? Visit our Glossary!


    More...
    mikesmith likes this.

  7. #7
    member TechnoMeter's Avatar
    Join Date
    Apr 2013
    Posts
    1,636
    Blog Entries
    426

    Daily Forex and Dow Jones Recommended Levels

    Several words about the EUR/USD future.
    Resistance (daily close) :
    1.3182, 1.3364, 1.3590 and 1.3778. After that 1.3958, 1.4186 and 1.4400. Break of the latter will give 1.4490, 1.4692

    More...

  8. #8
    member TechnoMeter's Avatar
    Join Date
    Apr 2013
    Posts
    1,636
    Blog Entries
    426

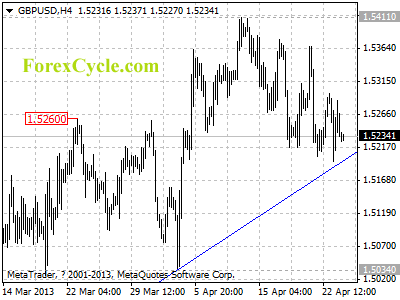
    GBPUSD is facing trend line support

    GBPUSD is facing the support of the upward trend line on 4-hour chart, a clear break below the trend line support will suggest that the upward movement from 1.4831 had completed at 1.5411 already, then the following downward move could bring price to 1.4500 zone. On the upside, as long as the trend line support holds, the uptrend could be expected to resume, and one more rise towards 1.5600 is still possible. Resistance is at 1.5335, a break above this level could signal resumption of the uptrend.


    More...
    mikesmith likes this.

  9. #9
    member TechnoMeter's Avatar
    Join Date
    Apr 2013
    Posts
    1,636
    Blog Entries
    426

    Daily Chart Art - April 24, 2013

    USD/CAD: 1-hour


    Comdoll lovers out there will go nuts for this setup on USD/CAD. It's a perfect*ascending triangle*This chart pattern usually precedes a strong bullish move, so I wouldn't be surprised to see the 1.0285 resistance level give way in the coming days. But then again, we can't rule out a downside breakout either, so you should also have a backup plan in case sellers take control and drag price to a new low.


    More...
    mikesmith likes this.

  10. #10
    member TechnoMeter's Avatar
    Join Date
    Apr 2013
    Posts
    1,636
    Blog Entries
    426

    EUR/USD: losing charm

    EUR/USD Current price: 1.2987

    View Live Chart for the EUR/USD


    The EUR/USD trades back below the 1.30 mark, having already reached a daily low of 1.2954 on disappointing IFO readings early Europe. Latest slide however, comes from US data, as Durable Goods orders fell well below expectations, putting some pressure on stocks after yesterday impressive rally. The hourly chart shows price below 20 SMA and indicators heading lower getting into negative territory, while in the 4 hours chart technical readings hold a negative stance: *a candle opening below 1.2970 or an acceleration below the level will confirm further falls for today, as long as 1.3040 maintains the upside limited.
    Support levels: 1.2970 1.2925 1.2880
    Resistance levels: 1.3040 1.3070 1.3115
    GBP/USD Current price: 1.5262

    View Live Chart for the GBP/USD (select the currency)

    The GBP/USD holds to its neutral stance, pivoting around the 1.5260 area, and unable to set a clear trend. Short term time frames show technical readings in positive territory, yet with no upward momentum, while in the 4 hours chart the picture is pretty much the same. Sellers gather around the 1.5300 area and buyers in the 1.5190/1.5210 price zone, so unless a clear break of *any extreme, there’s not much to expect from the pair.
    Support levels: *1.5225 1.5190 1.5150
    Resistance levels: 1.5280 1.5300 1.5330*
    USD/JPY Current price: 99.45

    View Live Chart for the USD/JPY (select the currency)

    The USD/JPY holds to its latest range, with 100 SMA advancing over 200 one, currently around 99.15, offering short term support to the pair. Leaving aside the kneejerk suffered past US session, trading has been pretty uneventful in the pair, as proximity to 100.00 seems to discourage buyers at the time being, who anyway take every dip to jump in. In bigger time frames, the outlook continues to be bullish, although showing not enough momentum at the time being, and with stocks so far hovering around their opening, there’s not much chances of a big move in the pair.*
    Support levels: 99.20 99.00 98.60
    Resistance levels: 99.70 100.00 100.35*
    AUD/USD: Current price: 1.0272

    View Live Chart for the AUD/USD (select the currency)

    AUD advanced further against the greenback, approaching 1.0300 where sellers pushed the pair back lower. The hourly chart shows price above 20 SMA and indicators turning flat around their midlines, showing certain hesitation to sell at current levels. In the 4 hours chart however, bias remains to the downside, with indicators retracing from their midlines and price struggling around a bearish 20 SMA: steady losses below 1.0260 will open doors for a quick retest of the 1.0220 area today.
    Support levels: 1.0260 1.0220 1.0180*
    Resistance levels: 1.0300 1.0335 1.0370
    New to Forex? Visit our Glossary!


    More...

Page 1 of 81 1 2 3 11 51 ... LastLast

Tags for this Thread

Bookmarks

Posting Permissions

  • You may not post new threads
  • You may not post replies
  • You may not post attachments
  • You may not edit your posts
  •