 7Likes
 LinkBack URL
 About LinkBacks
Thanks a lot TechnoMeter for sharing these wonderful information

This is a discussion on Technical Analysis within the Forex Trading forums, part of the Trading Forum category; Thanks a lot TechnoMeter for sharing these wonderful information...


Thanks a lot TechnoMeter for sharing these wonderful information

Talking Points
- US Dollar Holding at Chart Support, Waiting for Clear Catalyst
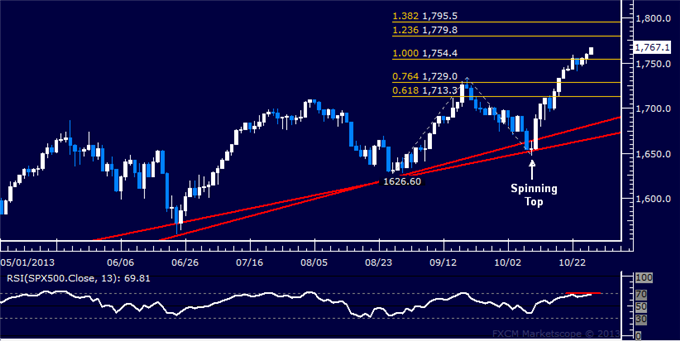
- S&P 500 Continues to March Upward Toward the 1800.00 Figure
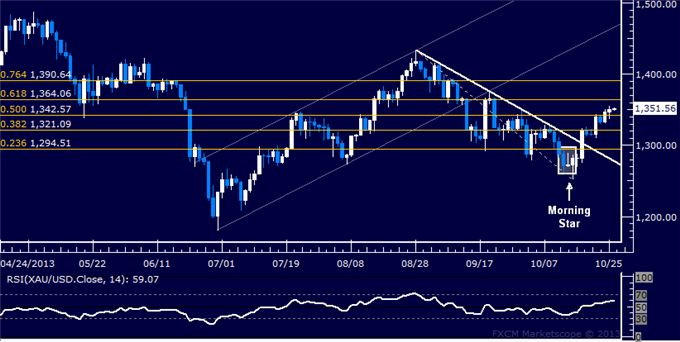
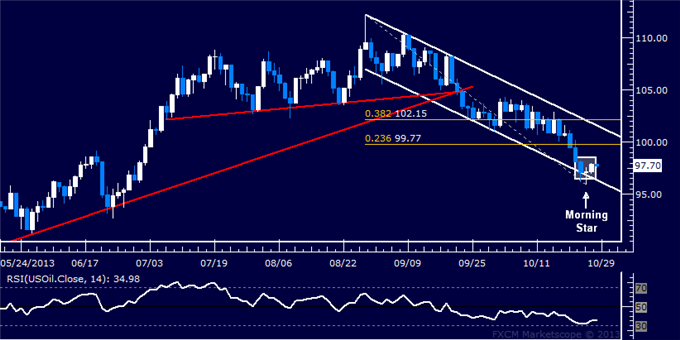
- Gold Aims to Extend Gains, Crude Oil Reversal May be Starting
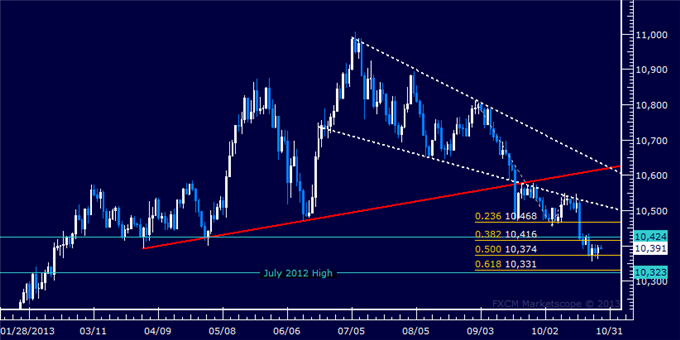
US DOLLAR TECHNICAL ANALYSIS – Prices are testing support at 10374, the 50% Fibonacci expansion. A break below this barrier targets the 10323-31 area, marked by the June 1 2012 swing high and the 61.8% level. Resistance is in the 10416-24 region, the site of April’s shelf support and the 38.2% Fib, with a reversal above that eyeing 23.6% expansion at 10468.
S&P 500 TECHNICAL ANALYSIS – Prices recovered as expected after showing a Spinning Top candlestick at support marked by a rising trend line set from late February. A break above resistance at 1754.40, the 100% Fibonacci expansion, has exposed the 123.6% level at 1779.80. However, early signs of negative RSI divergence warn of ebbing upside momentum and hint a reversal may be brewing. A move back below 1754.40 sees the first layer of support at 1729.00, the 76.4% Fib.
GOLD TECHNICAL ANALYSIS – Prices broke higher as expected after putting in a bullish Morning Star candlestick pattern. Resistance is now at 1634.06, the 61.8% Fibonacci retracement, with a break above that targeting the 76.4% level at 1390.64. Near-term support is at 1342.57, the 50% Fib. A reversal back beneath that eyes the 38.2% Fib at 1321.09.
CRUDE OIL TECHNICAL ANALYSIS– Prices put in a bullish Morning Star candlestick pattern at the bottom of a falling channel set from late August, hinting at rebound ahead. Near-term resistance is at 99.77, the 23.6% Fibonacci retracement, with a break above that targeting the channel top at 101.59. Channel bottom support is now at 96.27.
--- Written by Ilya Spivak, Currency Strategist for DailyFX.com
More...

Talking Points:
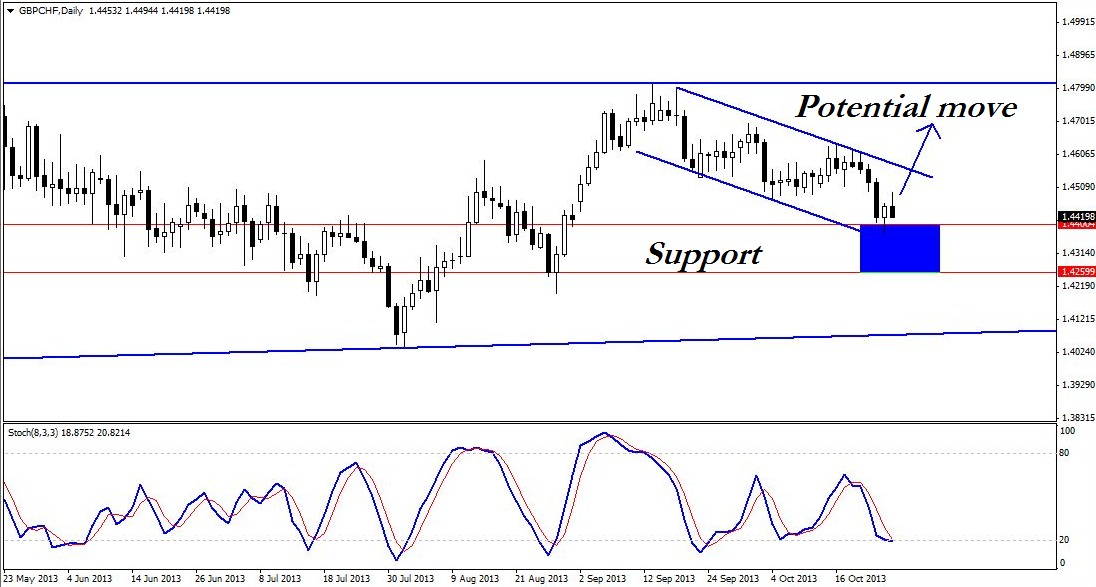
- Rare "Three-Push" Pattern in GBP/CHF
- Potential Swing Move off Daily Support
- The Critical Support Zone to Watch
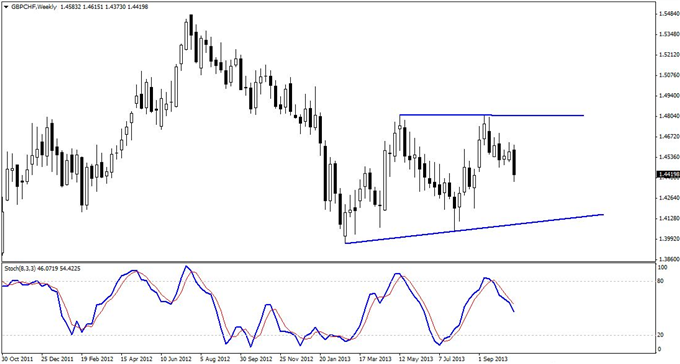
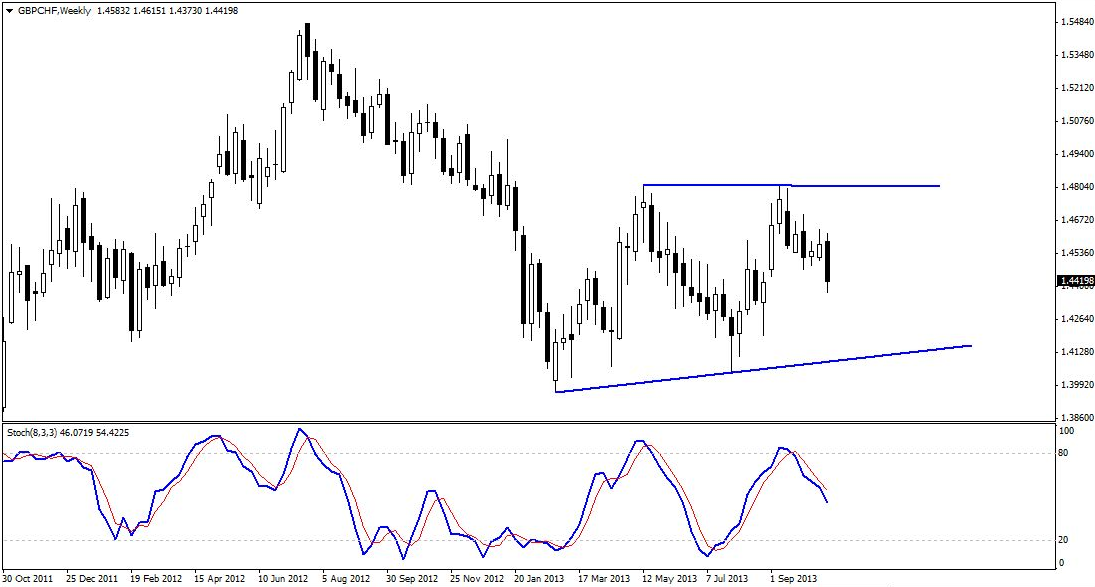
GBPCHF is currently in a mostly sideways area on the weekly chart, resting after a downward move. The big picture momentum is down, but this is not an area where large movements are expected.
Guest Commentary: Weekly Downtrend/Consolidation for GBP/CHF
The pair is in the midst of a downward swing, as indicated by the stochastic crossing down, or indeed a direct examination of the price action. Nonetheless, there is an interesting situation that has formed on the daily chart that makes a long position potentially desirable.
Traders will note the relatively rare “three-push” pattern on the GBPCHF daily chart. It consists of three equal pushes down within a fairly consistent channel. The second-to-last bar has a longish tail, which is a potential indication that the current downswing is nearly over. The Stochastic is still crossed down, but there may well be an entry long.
Guest Commentary: “Three-Push” Pattern on GBPCHF Daily Chart
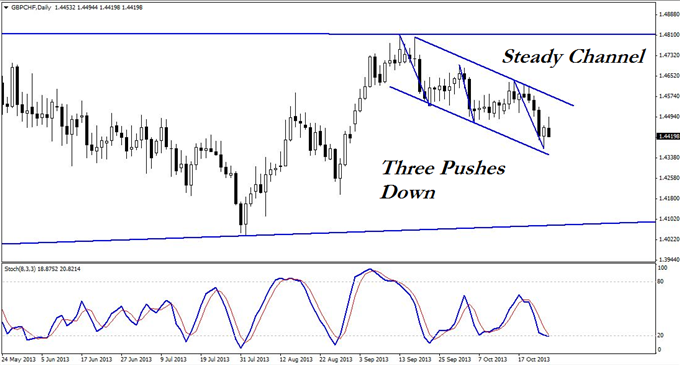
The three-push pattern is an end-of-trend pattern, and if it truly develops, it would point to price going up well above the top of the channel (see below). That would be ideal indeed!
Guest Commentary: Potential GBP/CHF Move off Daily Support
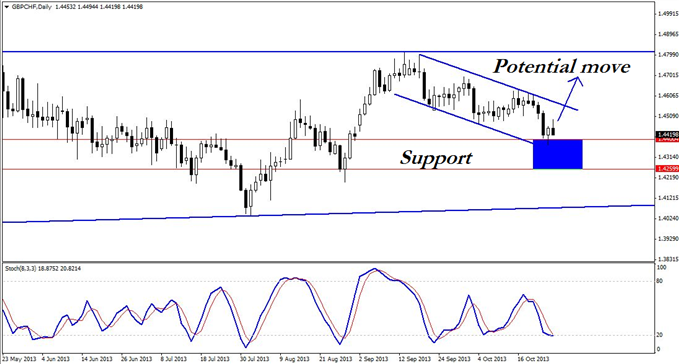
To account for the fact that the weekly chart is still in a general downtrend, and also for the fact that a three-push pattern by its very nature defies the current trend, a support zone approximately half the size of the downward channel has been estimated.
Further, this zone has been adjusted to match previous price action, in particular, the late-August low.
That zone is 1.4259-1.4400. It is a fairly large area, but there are two reasons why it is viable:
- The potential reward would be much larger;
- A trade trigger on the four-hour chart would allow for a smaller stop.
Guest Commentary: Critical GBP/CHF Price Points to Watch
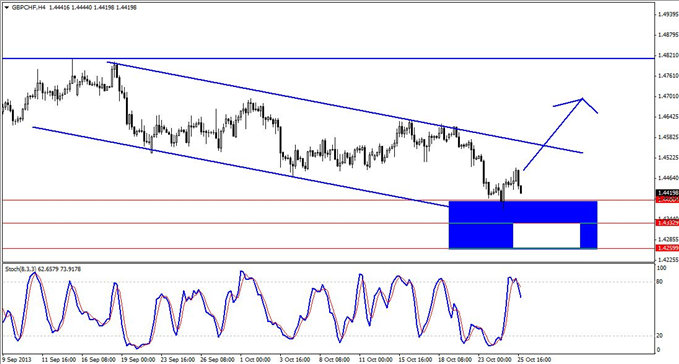
On the four-hour chart, price still looks to be under pressure from a bearish flag pattern, so it may well be that the lower half of the zone will be challenged, and that would reduce the zone by approximately half, leaving the target area confined between 1.4529 and 1.4332.
This is the zone worth watching for signs of reversal divergence or some other bullish pattern on the four-hour charts for the coming week. Other patterns such as the inverse head-and-shoulders may also be tradable on the hourly chart. However, it is worth noting that the level of support is likely to prove flexible, and price may spike below it.
In the event that price closes below the range on the four-hour chart, however, it would be considered a break of the zone, rendering this set-up effectively null and void.
By Kaye Lee, private fund trader and head trader consultant, StraightTalkTrading.com
More...

Talking Points
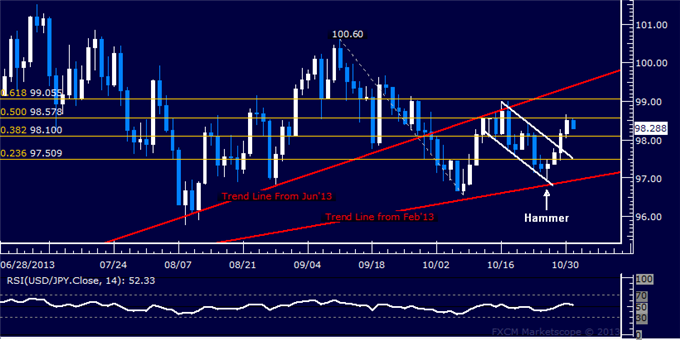
- Prices rose as expected after showing a Hammer candle, breaking 97.51 (23.6% Fib)
- A break of resistance at 97.87 (38.2% Fib, channel top) would expose 98.15 (50% Fib)
- Back below 97.51 sees support at 96.88 (trend line from Feb’13)
c
--- Written by Ilya Spivak, Currency Strategist for DailyFX.com
More...

Talking Points:
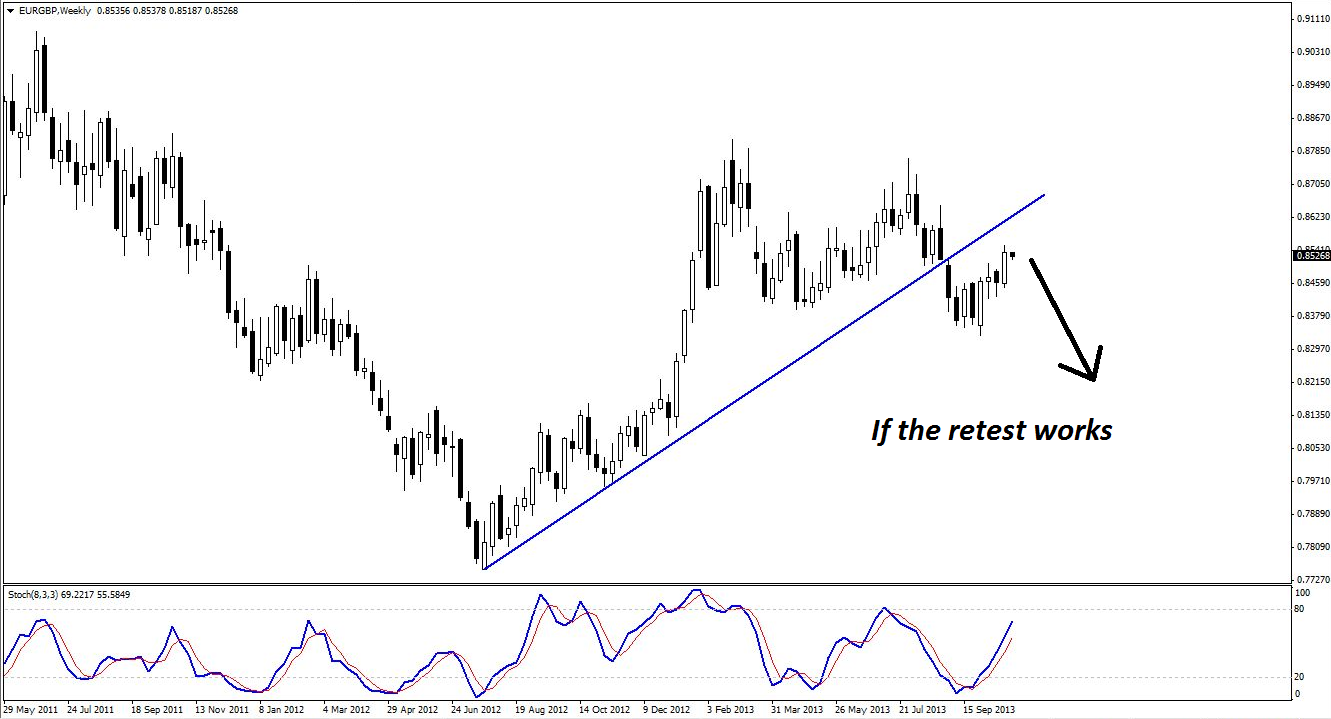
- EUR/GBP Nears Rising Trend Line
- A Much Larger Pattern in the Making
- The "Ideal" EUR/GBP Set-up
EURGBP is widely seen as a slow-moving currency pair, but nonetheless, it is creeping back to retest the underside of a rising trend line on the weekly chart, as shown below.
Guest Commentary: EUR/GBP Nears Weekly Trend Line
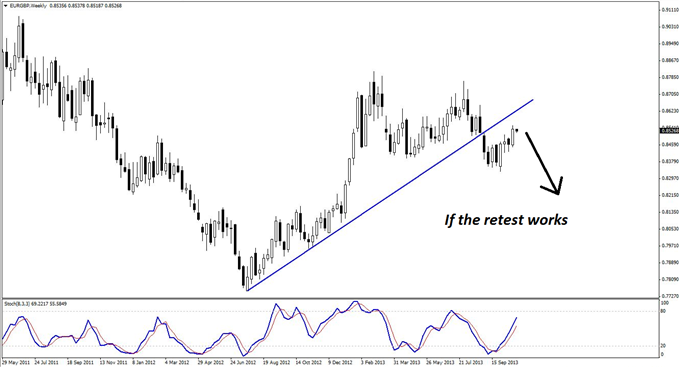
Admittedly, now may be a little early to form a longer-term short, as the primary momentum on the weekly chart has merely turned sideways, and not down. However, it should provide at least a near-to-mid-term short opportunity that could turn out to be a much larger trade.
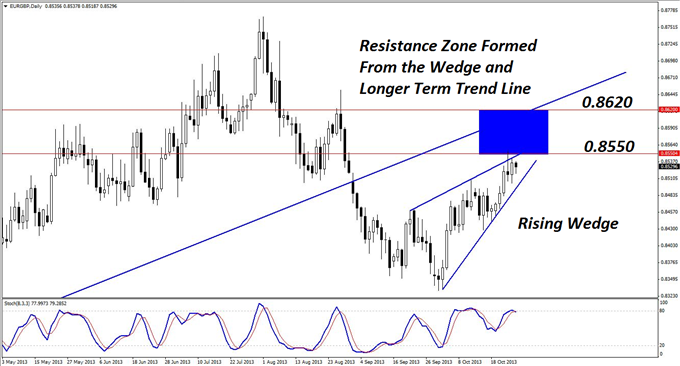
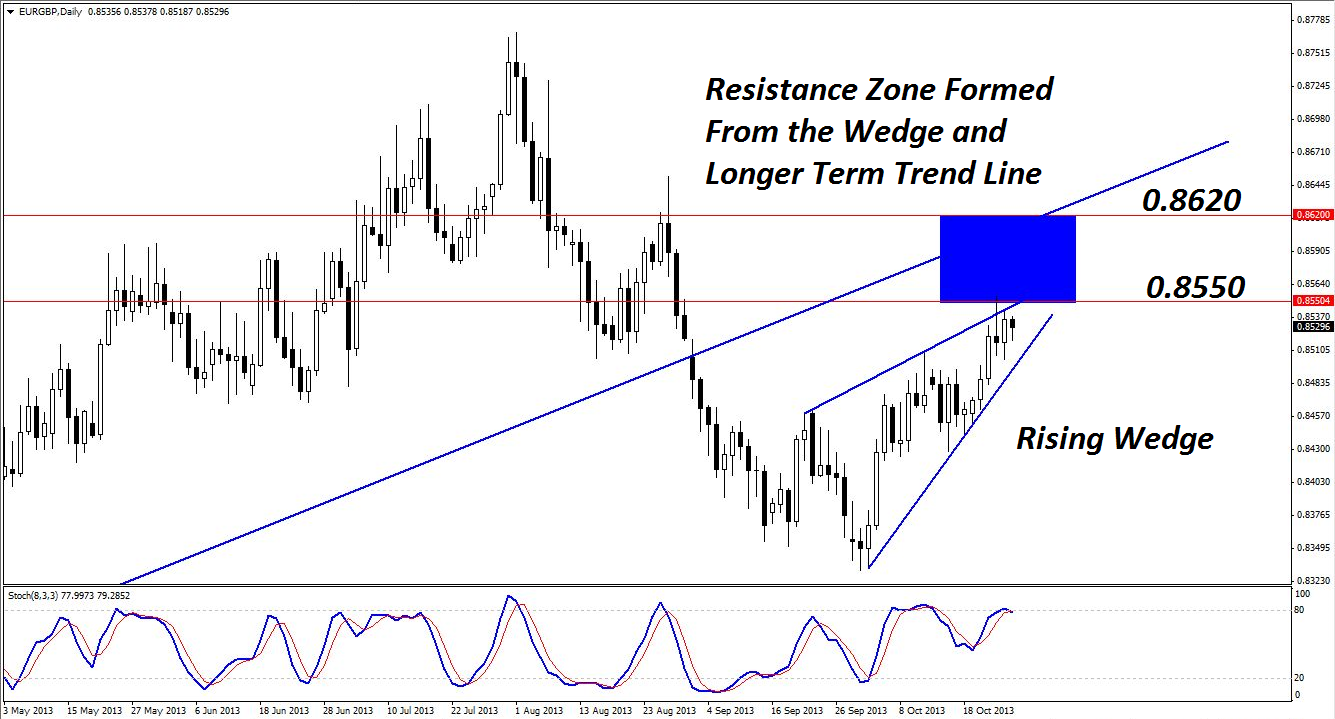
The daily chart of EURGBP has a rising wedge forming rather beautifully below the trend line, which is another case for a short. The zone between the upper wedge resistance and the underside of the longer-term trend line has been estimated as 0.8550-0.8620.
Guest Commentary: Rising Wedge Pattern in EUR/GBP
Some traders would already be short on the pin bar from October 24, but given how close the rising wedge support is on the daily chart, a sharper entry would be preferable.
Going down to lower time frames is always useful for reducing risk and getting better entries, so we’ll turn to the four-hour chart for guidance.
Although there are several patterns in play on the four-hour time frame, not of least of which is the sideways/symmetrical triangle, there are no new factors here that would significantly change the analysis.
Guest Commentary: Be Very Picky with EUR/GBP Shorts
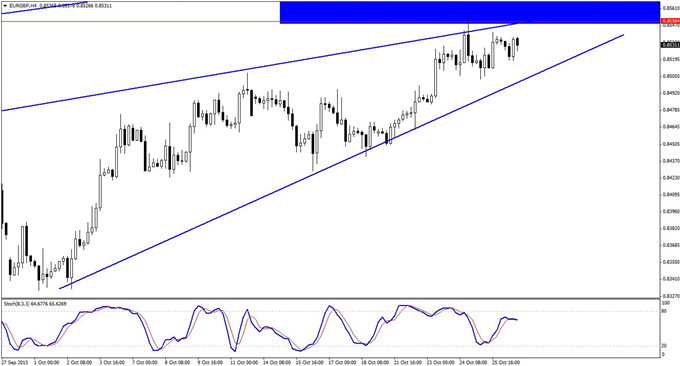
As a result, the ideal trade set-up would be another push into the projected resistance zone accompanied by reversal divergence. That should be quite easily fulfilled, as there has already been one divergence. This trade is one to be picky about entries, as the reward-for-risk would be poor otherwise.
By Kaye Lee, private fund trader and head trader consultant, StraightTalkTrading.com
More...

Talking Points
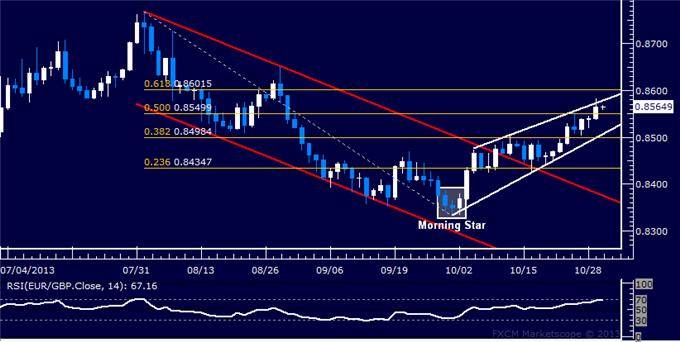
- A Rising Wedge chart pattern warns a reversal lower may be brewing ahead
- Breaking below 0.8550 (50% Fib) eyes the 0.8498-0.8507 area (Wedge bottom , 38.2% Fib)
- Pushing above the Wedge top (now at 0.8578) initially targets 0.8602 (61.8% Fib)
--- Written by Ilya Spivak, Currency Strategist for DailyFX.com
More...

Talking Points:
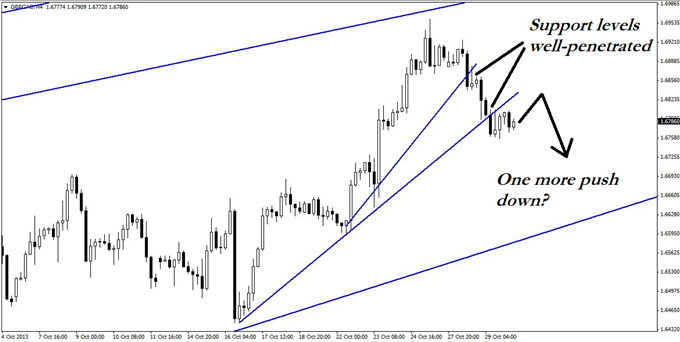
- The Sharp GBP/CAD Downside Move
- Consolidation Before Another Potential Push Down
- Conflicting Elliott Wave Signals to Contend with
As seen in the chart below, the current profit level on that trade would now be approximately equal to the risk taken.
Guest Commentary: An “Eye-Catching” GBP/CAD Move
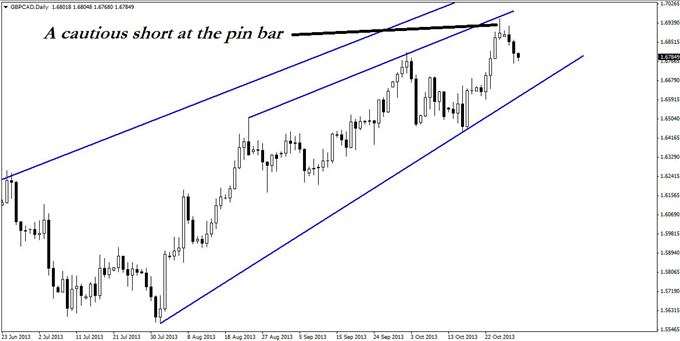
It is the speed of the move down that is eye-catching, however, particularly because price has already broken the rising trend line support levels.
Consolidating where it is now suggests that although some upward pullback is likely, there should be at least one more push down.
Guest Commentary: Another Push Down for GBP/CAD
Due to the risk factors cited earlier for that trade, however, caution is still a top priority, and as a result, only an intraday trade should be attempted at this point.
In that regard, there are two conflicting Elliott wave counts on the four-hour and hourly charts that could be of particular interest.
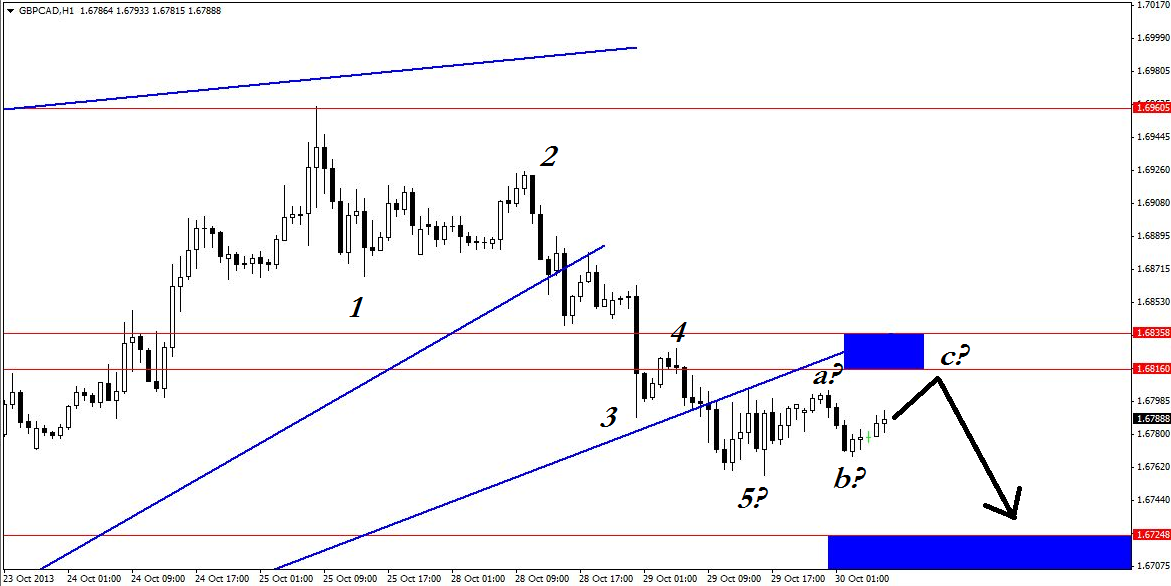
Guest Commentary: Conflicting GBP/CAD Elliott Wave Counts
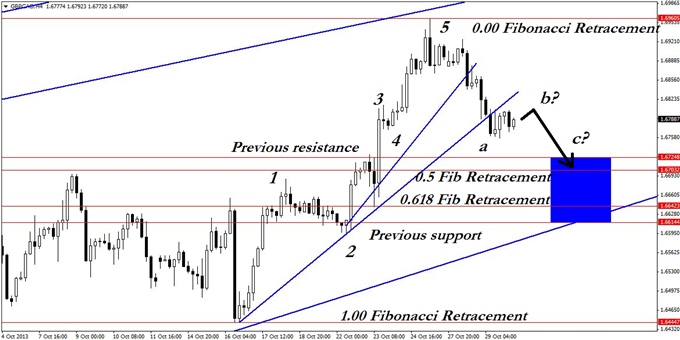
The four-hour Elliott wave count has been identified in the above chart for enthusiasts only. For those who wish to understand the bottom line, the hypothetical projected move is the jagged black arrow labelled with “b” and “c.”
The key point here is that according to Elliott wave projections, price could potentially move down to find support between the 50% and 61.8% Fibonacci retracement levels at 1.6642 and 1.6703. To be conservative, this zone has been slightly enlarged to 1.6614-1.6724 in order to account for previous price-based support and resistance.
Essentially, the analysis suggests that there could be at least 60 pips of additional downside to this move. The important question, however, is how to capture that potential move?
Guest Commentary: Conflicting GBP/CAD Elliott Wave Counts (cont’d.)
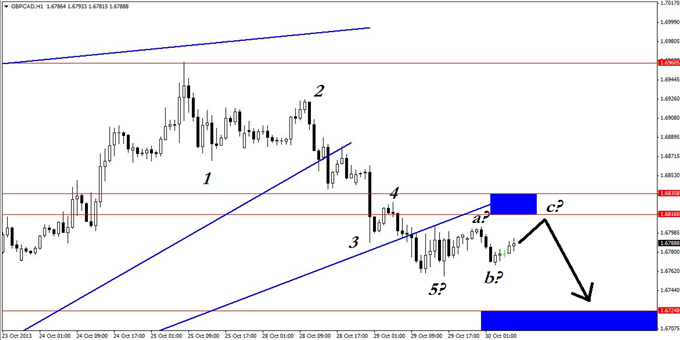
The wave count on the GBPCAD hourly chart is far less certain, as wave 5 may not represent the low. Nonetheless, on pure support and resistance principles, we have an estimated resistance zone around the wave 4 high in the area of 1.6816-1.6835.
This is extremely small in relation to the move that could develop. Although price could run straight down without going up to test that level of resistance, the move is a little doubtful on the daily chart, so a more defensive stance is preferable here, even if it means missing the potential move.
Alternatively, price could go down to make a new low (new wave 5) before pulling back up to this resistance, and that scenario would be tradable as well. Since this zone is anchored around previous price action, the resistance zone would still be valid. Of course, if price moves straight to the projected support zone, then the opportunity would be negated.
This is essentially an intraday trading opportunity using a 15-minute chart where an early entry and nimble trade management would be required. As usual, pin bars, engulfing bars, reversal patterns, and divergence would all be potential reasons to enter when price pierces that key resistance zone.
By Kaye Lee, private fund trader and head trader consultant, StraightTalkTrading.com
More...

Talking Points
- Prices rose as expected after showing a Hammer candle at trend line support set from Feb
- Bulls are now testing resistance at 98.58 (50% Fib ret.); brake higher targets 99.06 (61.8% Fib)
- Reversing below support at 98.10 (38.2% Fib) initially exposes 97.51 (23.6% Fib)
--- Written by Ilya Spivak, Currency Strategist for DailyFX.com
More...

- US Dollar may have set critical bottom versus major forex counterparts
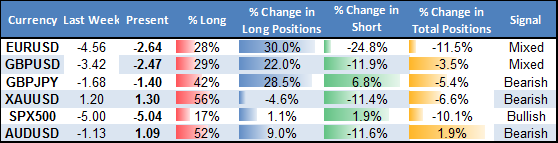
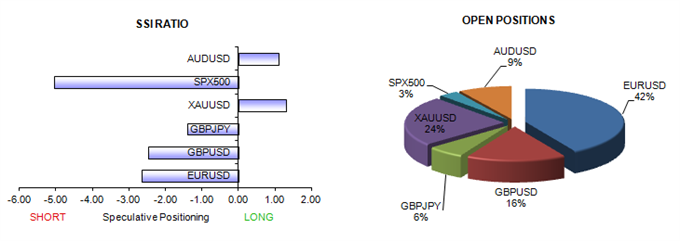
- Retail forex crowds remain long Dollar, but huge shift warns of turn in price
- Our sentiment-based trading systems have begun buying into Greenback strength
Weekly Summary of Forex Trader Sentiment and Changes in Positioning
The US Dollar may have set a lasting bottom versus the Euro, Australian Dollar, and British Pound. Why? And what could invalidate?
It’s a fool’s errand to try and catch major turning points in price, and saying that it “feels like” a reversal is a sure-fire way to lose money over the long run. Yet our retail FX sentiment-based strategies have begun buying into the USD bounce as we see early signal of a potential turn.
Past performance is NOT indicative of future results, but our Momentum2 trading system has done well trading the Greenback through recent months of trading. The fact that it has now sold EURUSD, GBPUSD, and AUDUSD serves as early confirmation of a potentially lasting Dollar bounce.
--- Written by David Rodriguez, Quantitative Strategist for DailyFX.com
More...

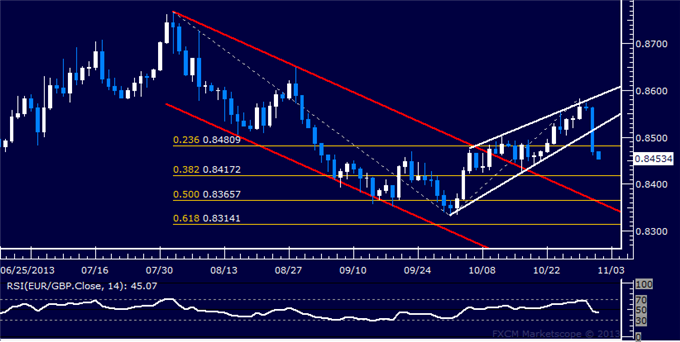
Talking Points
- Prices declined as expected, completing a Rising Wedge chart formation
- Sellers are targeting support at 0.8417 (38.2% Fib); below that exposes 0.8366 (50% Fib)
- Back above 0.8481 (23.6% expansion) aims the Wedge bottom (now at 0.8523)
--- Written by Ilya Spivak, Currency Strategist for DailyFX.com
More...


 Reply With Quote


Bookmarks