
 7Likes
 LinkBack URL
 About LinkBacks


- Long term stock market channels and US Treasury Bond pattern
- New Zealand Dollar crosses may reverse
- USDMXN responds to support
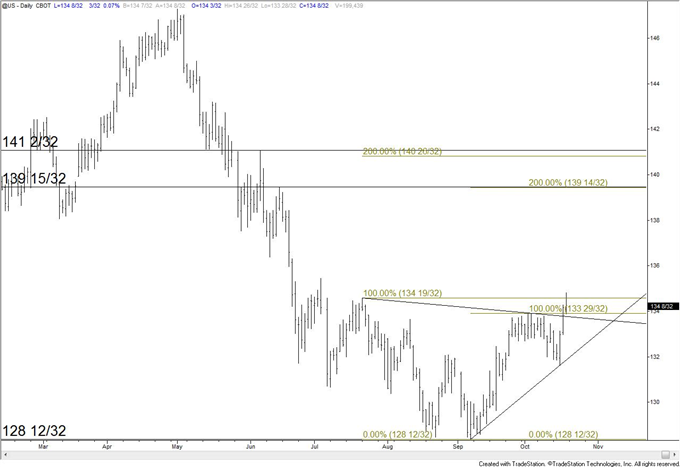
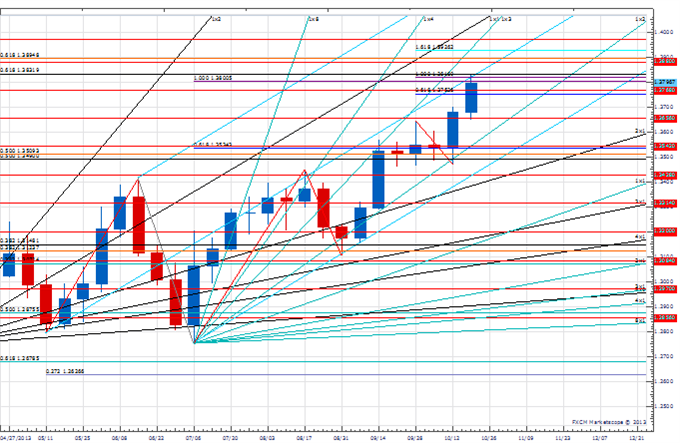
30 Yr. US Treasury Bond Future Continuous Contract (Dec)
Daily
-The 30 Yr. US Treasury Bond future traded above the 7/22 high today and into the day of the July high.
-Price is at resistance but so is the specter of a head and shoulders bottom. Friday’s weak US session urges caution but 131 20/32 (Wednesday low) is the pivot. A push through 135 14/32 would open up a run towards measured levels of 139 14/32 and 140 20/32. These levels coincide with important highs in June.
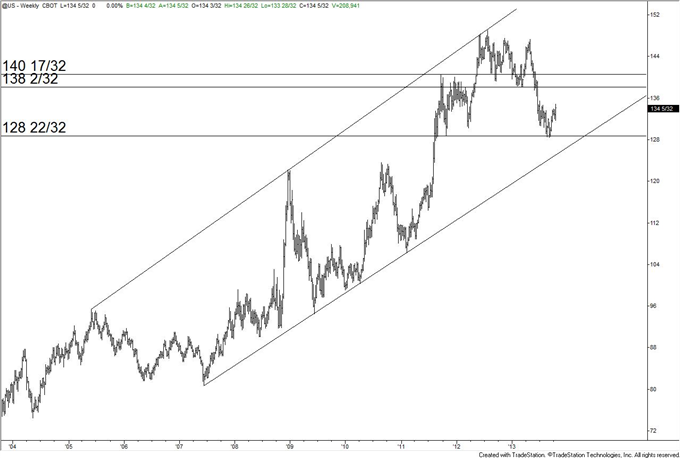
-Bigger picture, price has responded to the October low and the mentioned measured levels are in line with major support/resistance levels (see below chart).
30 Yr. US Treasury Bond Future Continuous Contract (Dec)
Weekly
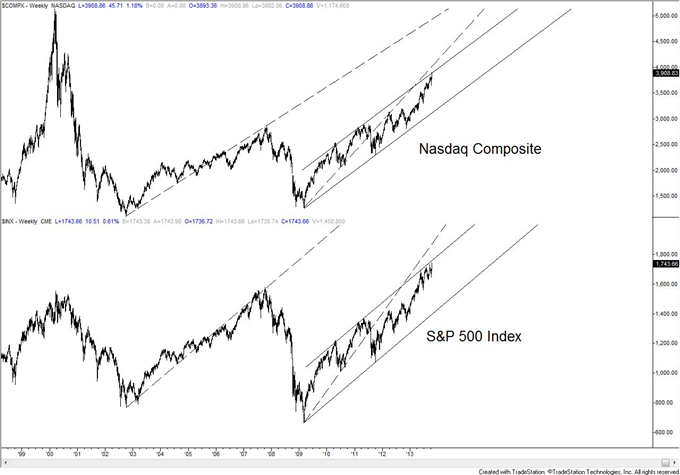
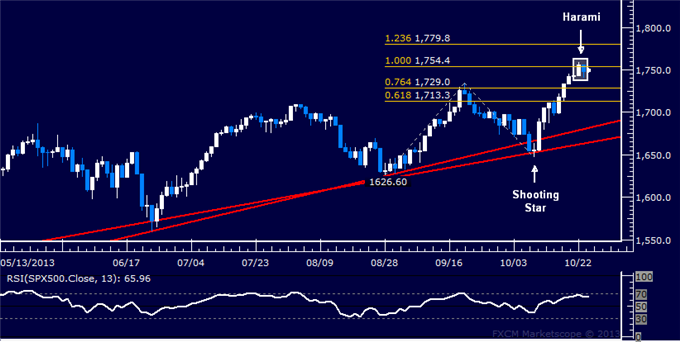
Nasdaq Composite and S&P 500 Index
Weekly
-The Nasdaq and S&P 500 are pushing into channel resistance that originates at the 2009 lows.
-The dashed lines are trendlines that connect the origin of a move and first meaningful reaction (defined as more than 6 months of weakness) within that move. The lines identified the final highs in 2007 although the S&P 500 did ‘ride’ the line higher for some time. The steep slopes of the current lines denote a manic market environment. A final ‘blowoff’ into these lines is possible.
-The Nasdaq composite would consist of 2 equal legs from the 2009 low at 3921. The S&P 500 would consist of 2 equal legs at 1179 (the first legs end at the May 2011 highs).
Trading Strategy: A possible outcome from a bond market breakout (not yet confirmed) and US equity indices at major resistance is a reversal from capital appreciation to capital preservation.
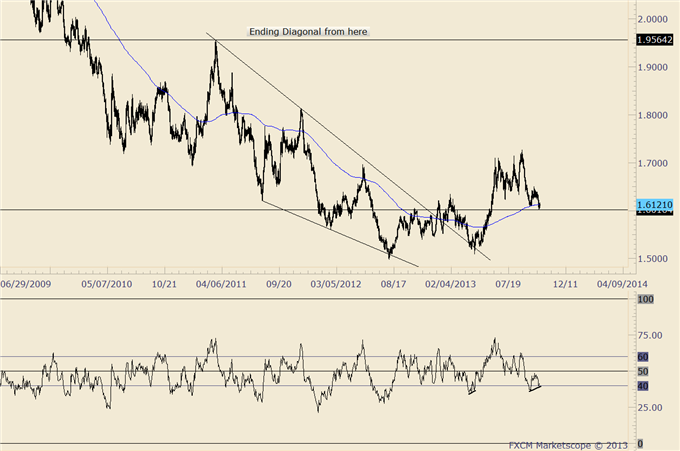
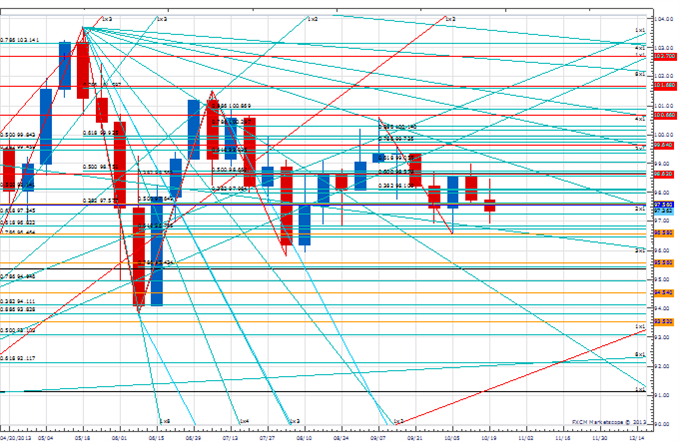
EUR/NZD
Daily
-EURNZD decline from the March 2011 high is an ending diagonal. Reversals from these patterns often return to the pattern’s origin (1.9564).
-Price has returned to the 200 day average. Highs from October 2012 and February 2013 are support here as well.
-Divergence with NZDJPY supports a turn at the current juncture. This fractal may help us navigate market swings moving forward as well.
Trading Strategy: I am long now with a stop at 1.6000. Catching a turn often requires several attempts and if this market heads lower then watch for support at the 5/29 low of 1.5873. As always, I’ll track developments in real time through Twitter @ JamieSaettele.
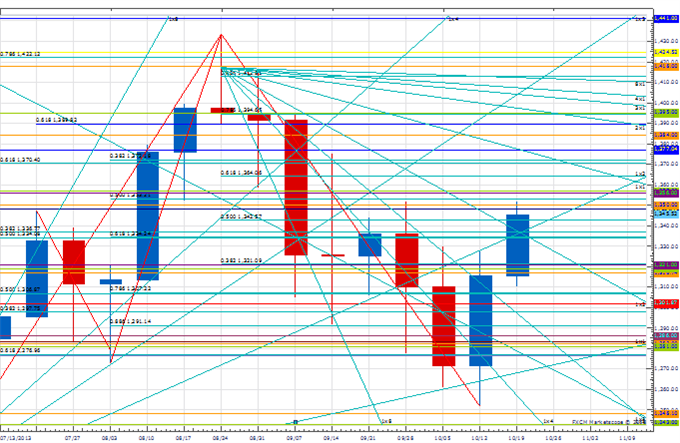
NZD/JPY
Daily
-NZDJPY has responded to the line that extends off of the April and September highs. A key reversal formed on Thursday and an inside day on Friday.
-Gaps can only occur in the FX market over the weekend. When gaps occur, pay attention. The close before the gap serves as a reference point. That level is possible resistance when approached from below and possible support when approached from above. Look to April for an example. The 4/12 gap served as resistance for weeks. The 9/20 close is serving as resistance right now.
Trading Strategy: Flat at the moment…will visit this early next week.
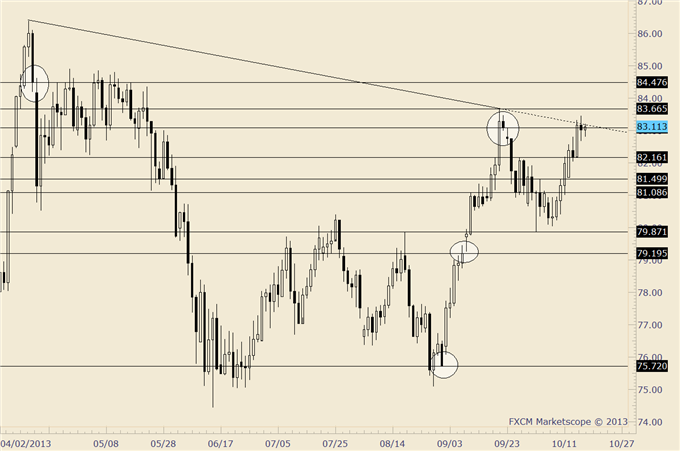
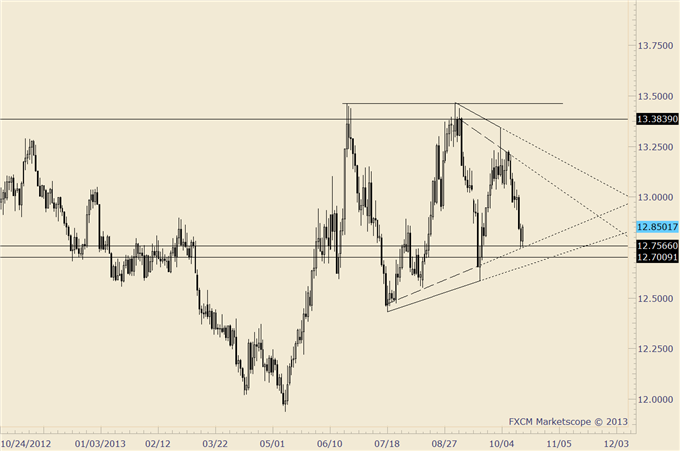
USD/MXN
Daily
-“USDMXN has been trading in a broad range since the June high. The pattern may take the form of a 3 point ascending triangle. Such patterns have the ability to produce intense bullish market moves.”
-Dashed trendlines are drawn off of the closes. Solid lines are drawn off of the high/low. USDMXN has rebounded from the trendline that extends off of the closes.
Trading Strategy: Near term resistance extends to about 12.93. A push through on an impulsive rally would suggest that a low is in place. Until then, keep 12.70 in mind as possible support for a turn.
--- Written by Jamie Saettele, CMT, Senior Technical Strategist for DailyFX.com
More...


 Reply With Quote


Bookmarks