
 7Likes
 LinkBack URL
 About LinkBacks


Talking Points
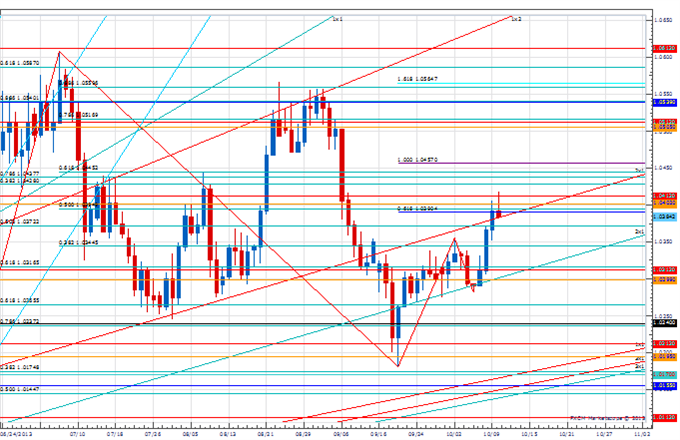
- Prices turned lower as expected after showing Shooting Star candle, negative RSI divergence
- A break of trend line support has triggered a short trade from here (1.6172)
- Initial target at 1.6063 (23.6% Fib); stop-loss activated on a daily close above 1.6259
--- Written by Ilya Spivak, Currency Strategist for Dailyfx.com
More...


 Reply With Quote

 Charts
  Charts


 Daily Chart


Bookmarks