
 7Likes
 LinkBack URL
 About LinkBacks


Talking Points
- USD/JPY rebounds off key Gann level
- USD/CAD has important cycle turn window later this week
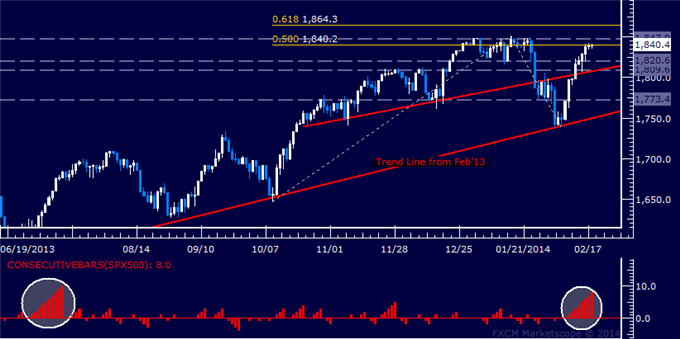
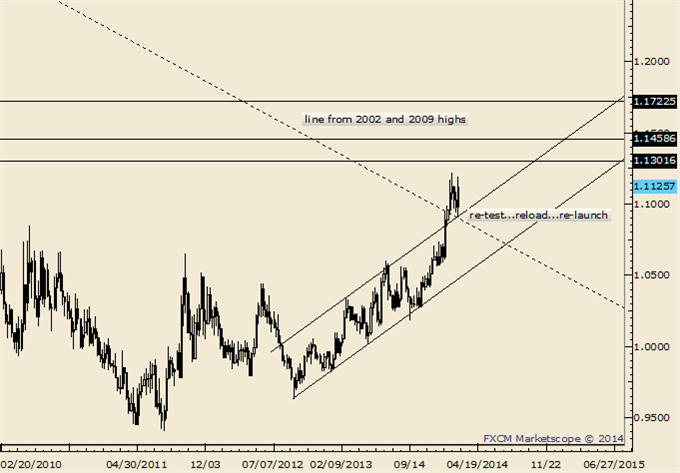
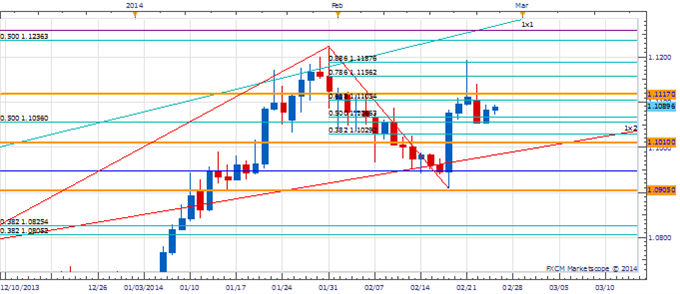
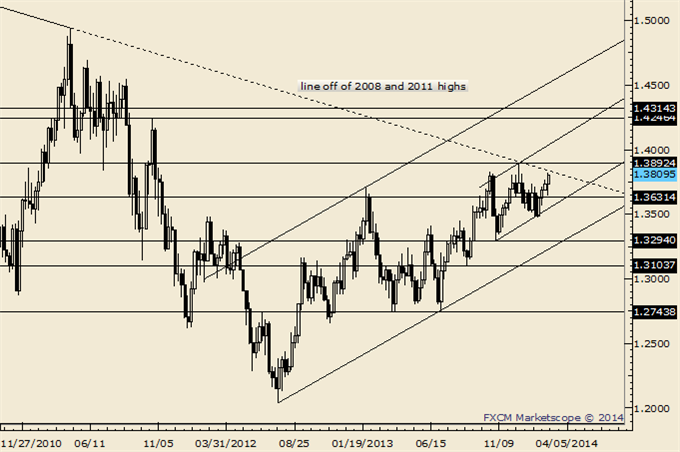
- Euro testing key resistance zone
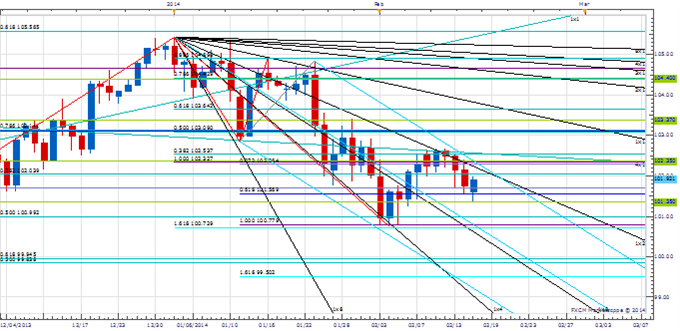
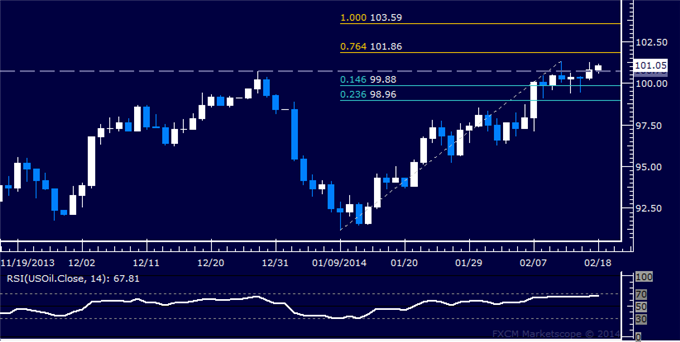
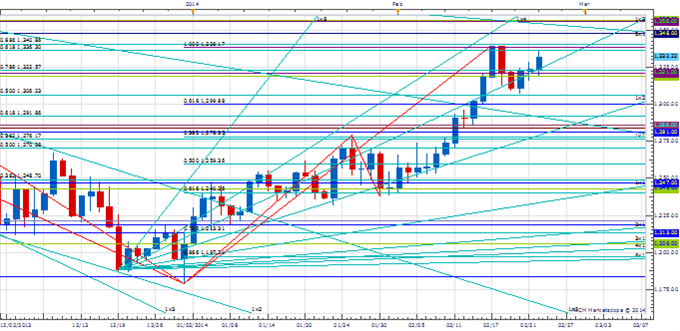
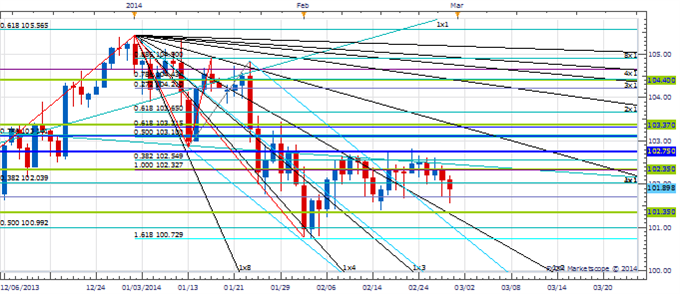
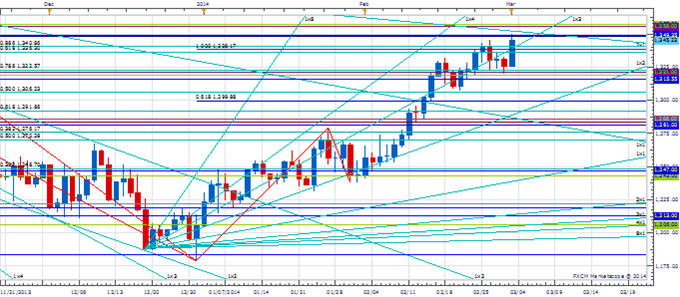
Price & Time Analysis: USD/JPY
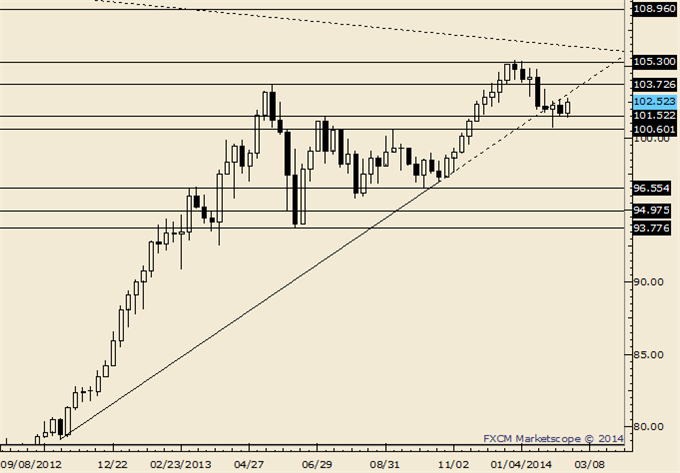
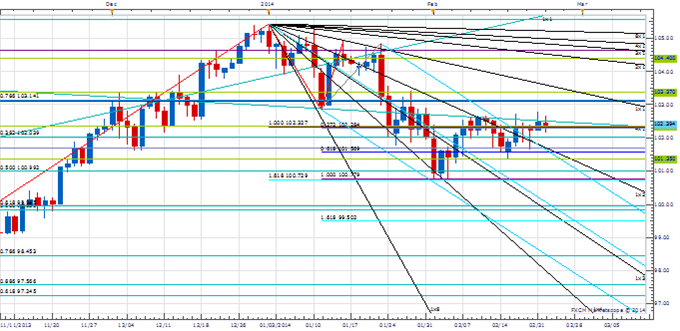
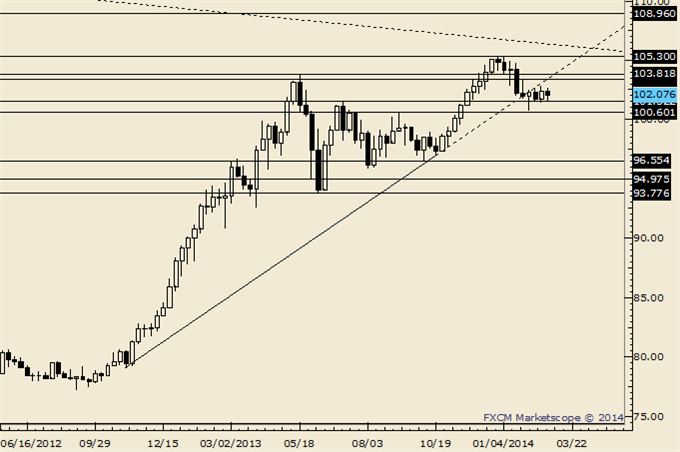
- USD/JPY found support today at the 4th square root relationship of the year-to-date high near 101.35
- Our near-term trend bias is positive in the exchange rate while 101.35 holds
- The 2nd square root relationship of the year’s low at 102.75 remains important resistance that needs to be breached soon if a more important move higher is to take hold
- A cycle turn window is seen around the middle of the week
- A daily close below 101.35 would turn us negative again on USD/JPY
USD/JPY Strategy: Like being square for the time being, but may look to buy a break of 102.75.
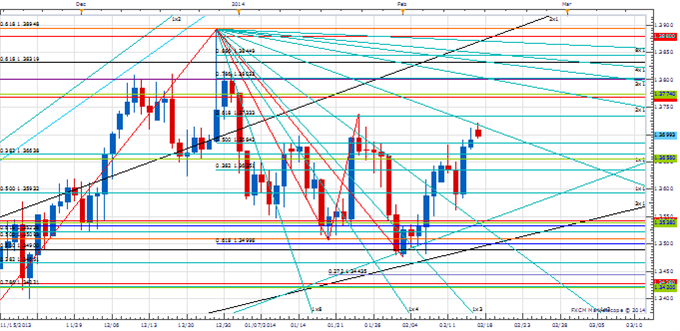
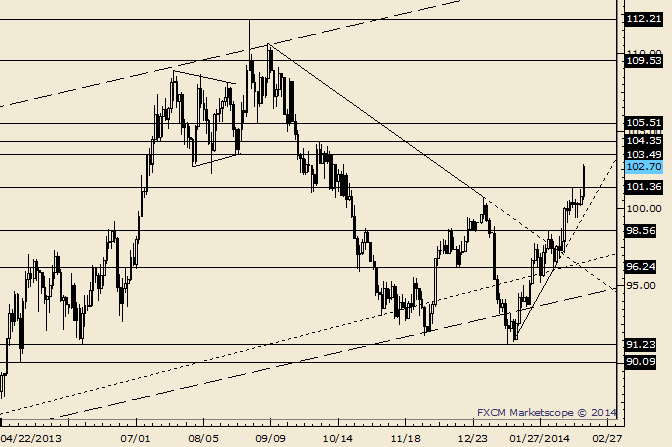
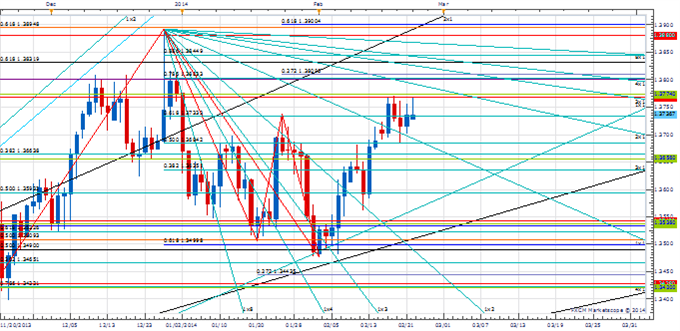
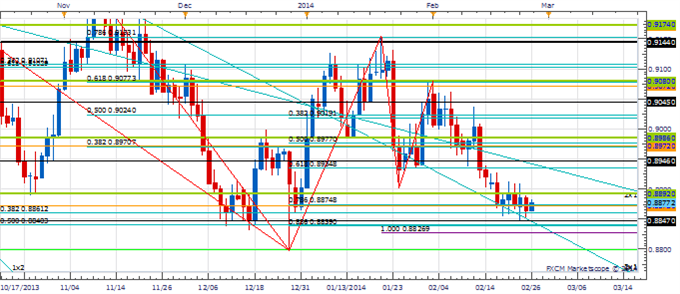
Price & Time Analysis: USD/CAD
Instrument Support 2 Support 1 Spot Resistance 1 Resistance 2 USD/JPY 101.35 101.70 101.90 102.55 *102.75
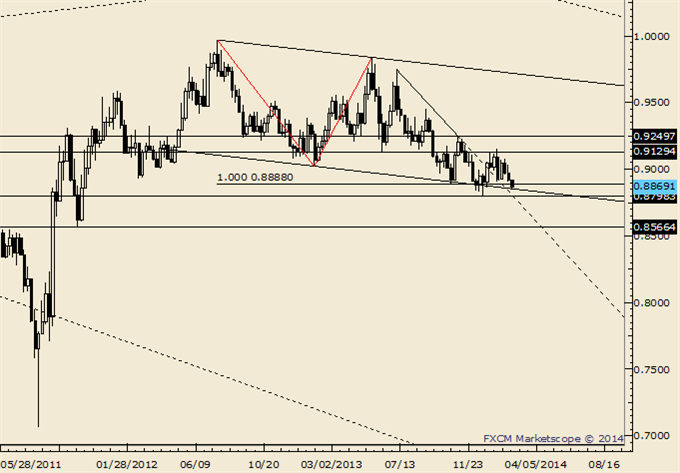
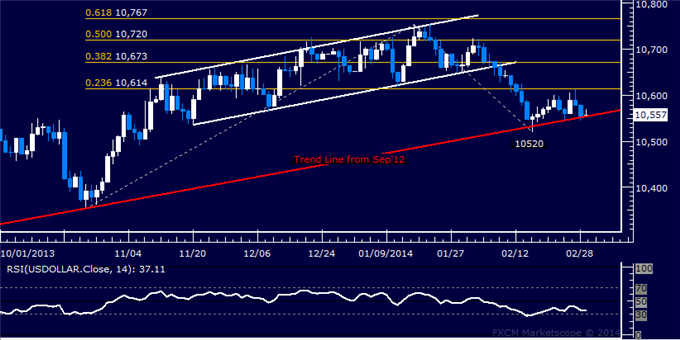
- USD/CAD has come under steady pressure over the past few weeks since failing just below the 50% retracement of the 2009/2011 decline at 1.1235
- Our near-term trend bias is lower in Funds while below 1.1120
- Interim support is seen at 1.0950 ahead of then next major downside attraction at 1.0905
- An important cycle turn window is seen at the end of this week/early next week
- A daily close over the 1st square root relationship of the year’s high at 1.1120 would turn us positive on USD/CAD
USD/CAD Strategy: Shorts favored while below 1.1120, but the clock looks to be ticking for the decline.
Instrument Support 2 Support 1 Spot Resistance 1 Resistance 2 USD/CAD *1.0905 1.0950 1.0960 1.1055 *1.1120
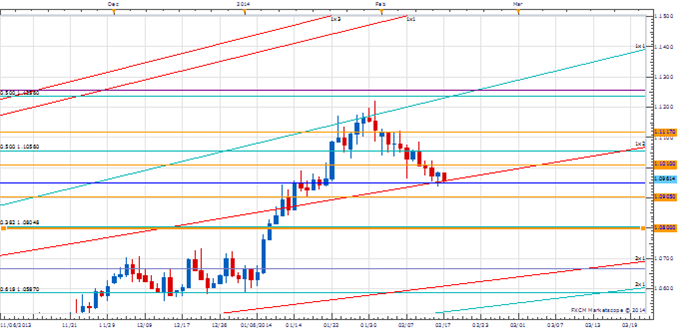
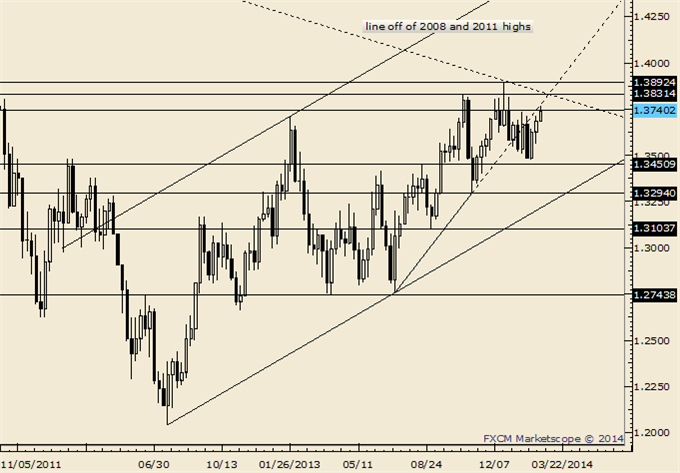
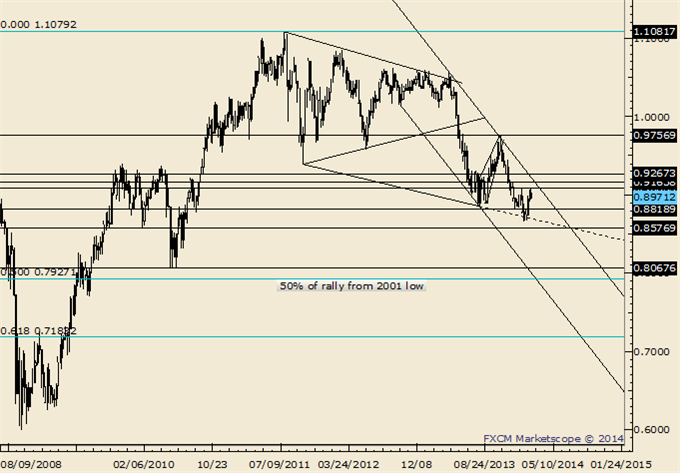
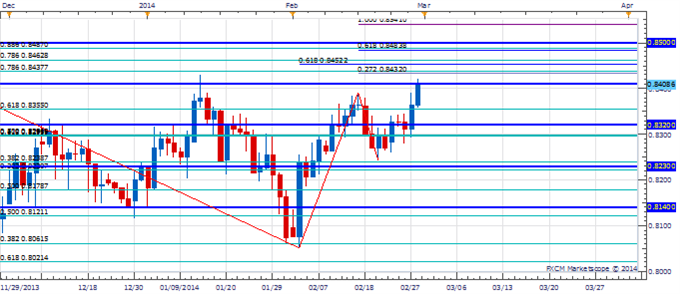
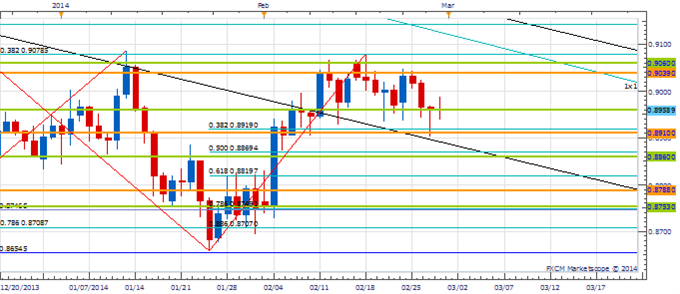
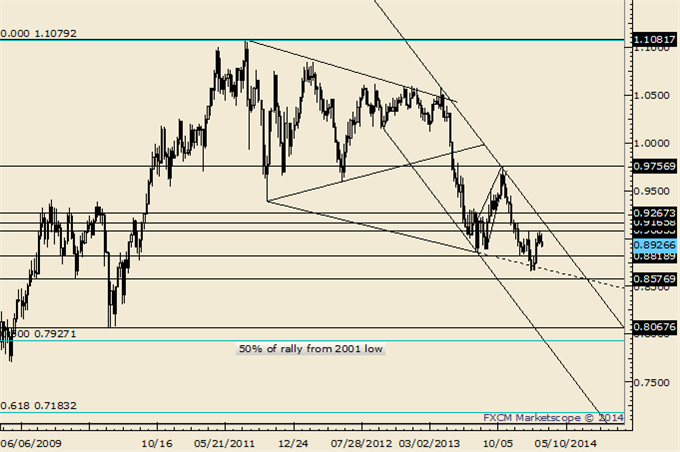
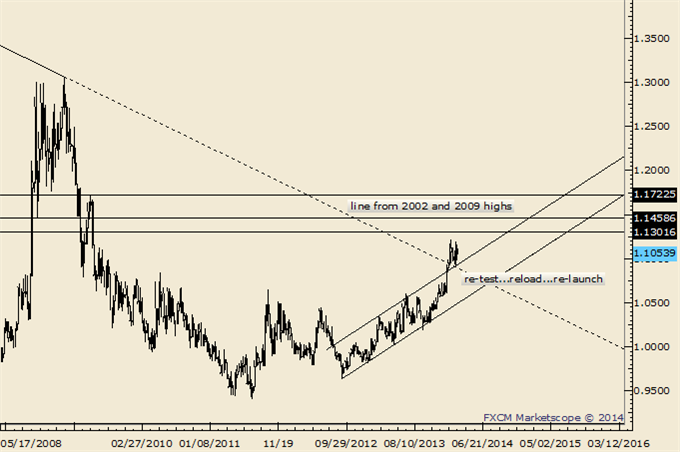
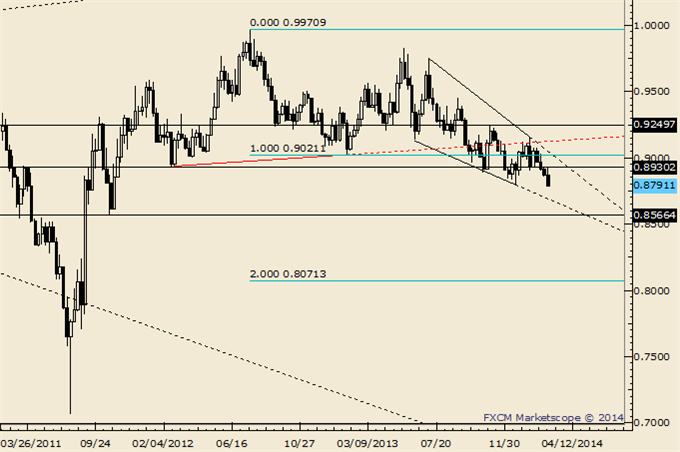
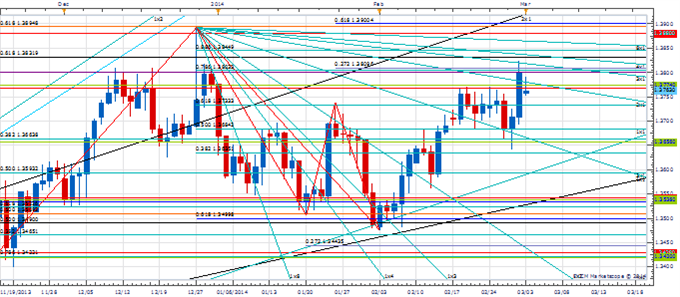
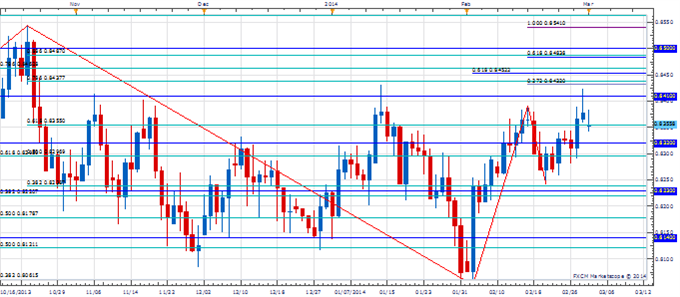
Focus Chart of the Day: EUR/USD
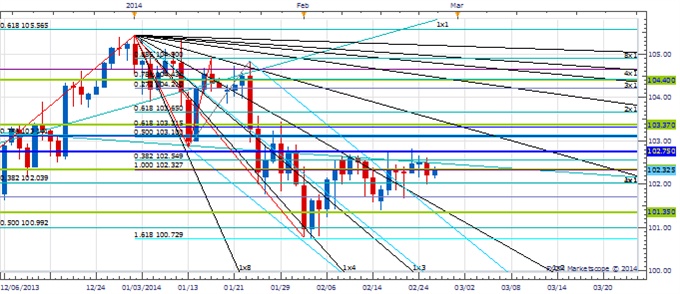
The price action around bank holidays in the US or the UK is usually written off by FX analysts as inconsequential due to the “lack of volume” associated with these events. We have never really subscribed to this thinking as P&L will reflect moves (and the subsequent psychological knock on effects) the same whether there was high turnover or not. Our interest actually tends to perk up around these periods as we have noticed countless episodes over the years where bank holidays actually produced meaningful reversals if not full on changes in trend. Heading into today’s President’s Day holiday in the US our attention is on EUR/USD and USD/CHF as both are at points in their respective cycles where a change in direction looks quite possible. They are also both nearing key levels of resistance and support at 1.3735 and .8875. If at least a short-term turn is to materialize then we would expect it to do so over the next day or so from around these key levels. Continued European currency strength into late in the day on Tuesday would signal our cyclical view was off.
More...


 Reply With Quote


Bookmarks