
 7Likes
 LinkBack URL
 About LinkBacks


- EURUSD and USDCHF LONG TERM momentum pattern implications
- USDJPY rebounds at year open
- NZDUSD next leg lower soon?
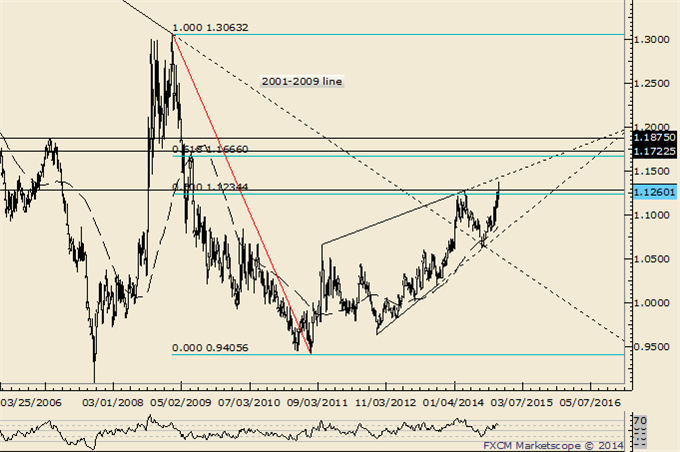
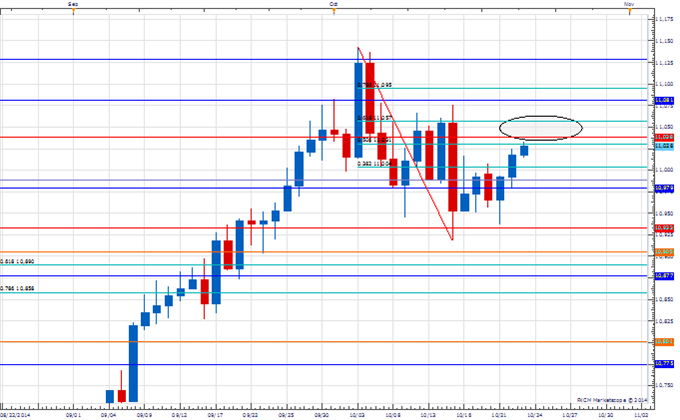
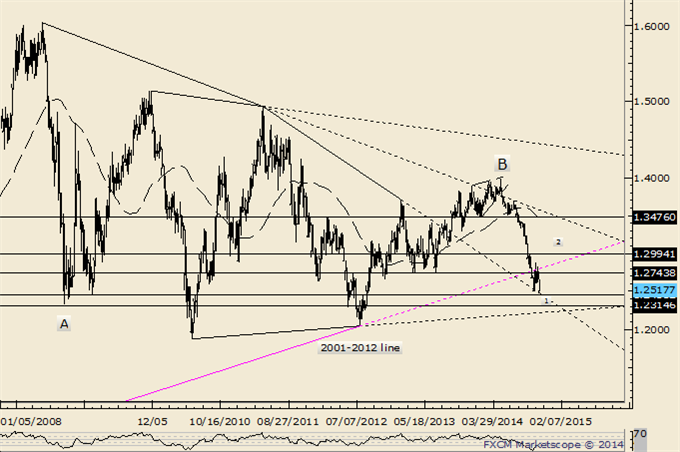
EURUSD
Monthly
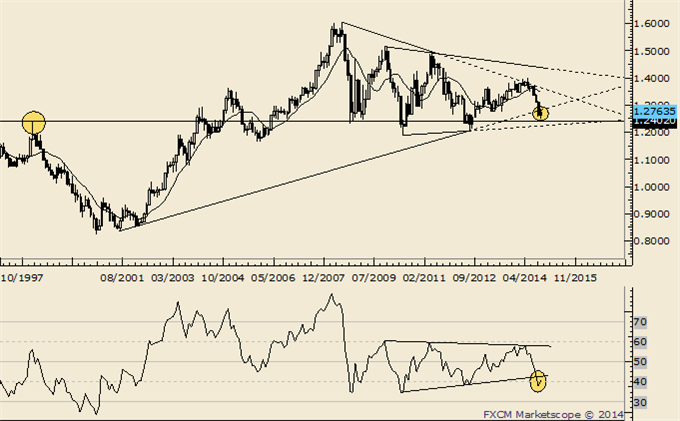
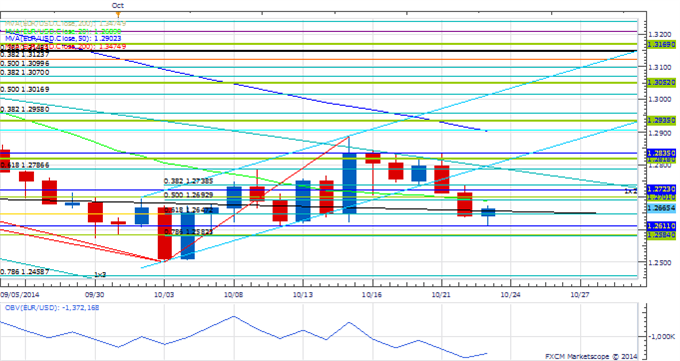
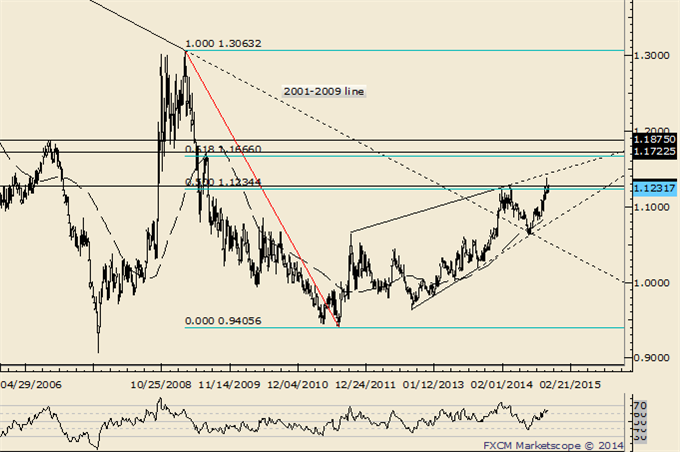
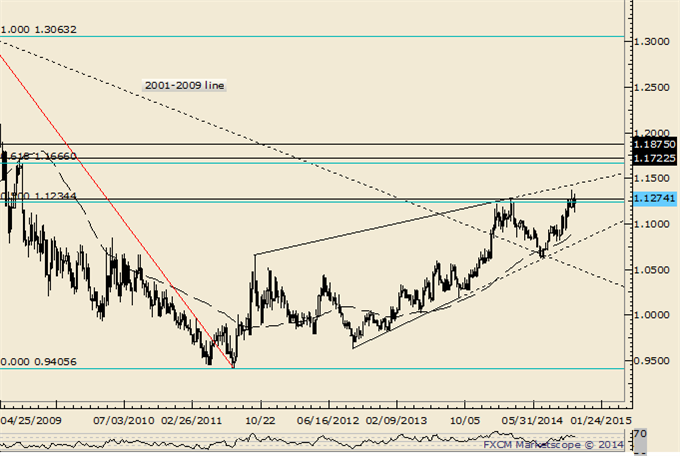
-“IF EURUSD trades to a new low while staying below 1.2791 THEN a 5 wave decline from the May high is probably nearing completion. 1.2315/28 would be of interest for a low. IF EURUSD exceeds 1.2791 while staying above 1.2500, THEN expect resistance between 1.2865 and 1.30 and a move to new lows thereafter.” The former scenario is on track so look for a top.
-BIG picture, monthly RSI has broken out of a triangle pattern. Sometimes, a pattern breakout in momentum (or OBV) precedes the breakout in price. The development’s implications are obviously significant.
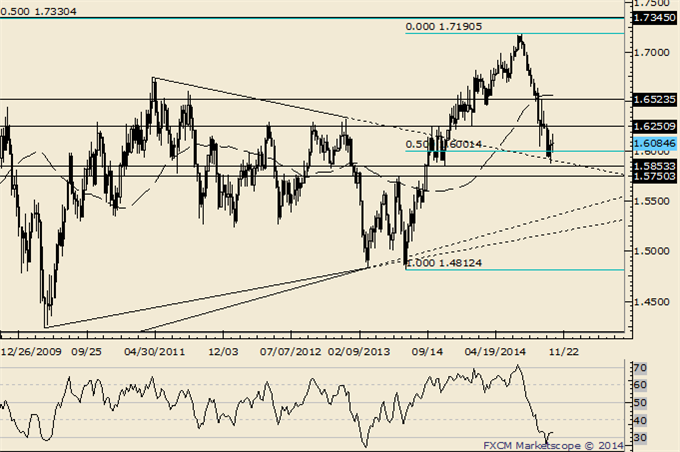
GBP/USD
Weekly
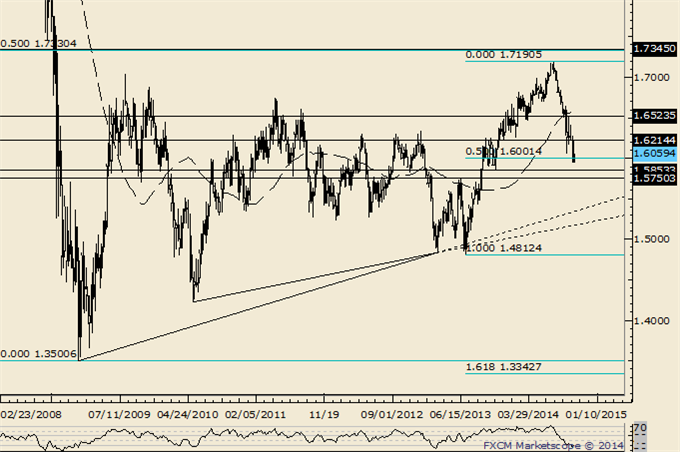
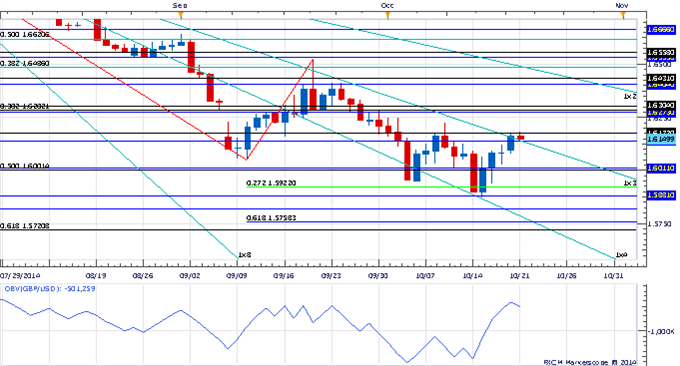
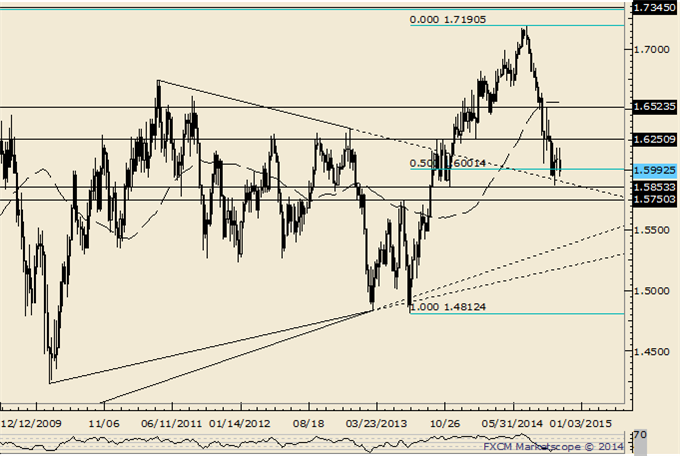
-“GBPUSD has retraced half of the rally from the 2013 low and then some. The top side of the line that extends off of the 2011 and 2013 highs is a level to keep in mind but the next major support level is the November low at 1.5853, followed by the June 2013 high and 61.8% retracement at 1.5720/50. 1.6150-1.6224 is resistance.”
-GBPUSD has followed through on the 10/15 reversal but strong resistance is seen from 1.6160 and 1.6250. The trend is down against 1.6524 and 1.5750 is the next possible support.
AUD/USD
Weekly
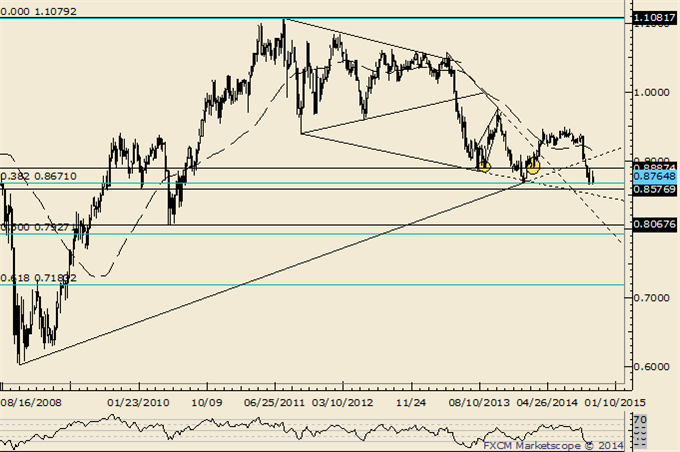
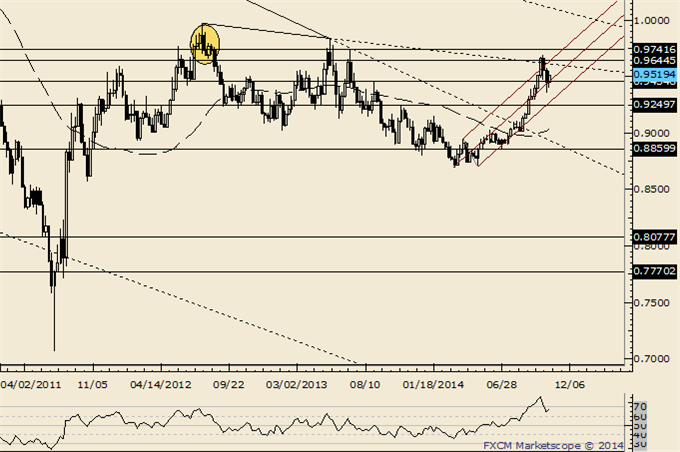
-“The combination of the .9400 figure and weekly RSI failing near 60 indicates a lot of overhead to punch through. Since the 2011 top, each RSI failure near 60 has led to a top or topping process (range for several weeks then a breakdown...that may be the case now).”
-AUDUSD broke down from a head and shoulders top on 9/9. The target was reached 4 days after the pattern completed. Weakness has extended below the line that extends off of the 2008 and 2014 lows, warning of something much more significant on the downside. .8500 is a possible bounce level.
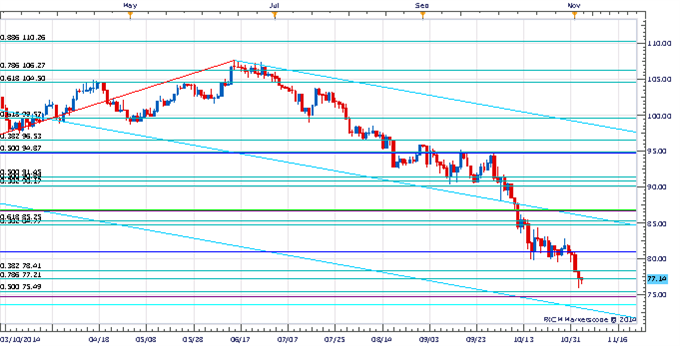
NZD/USD
Weekly
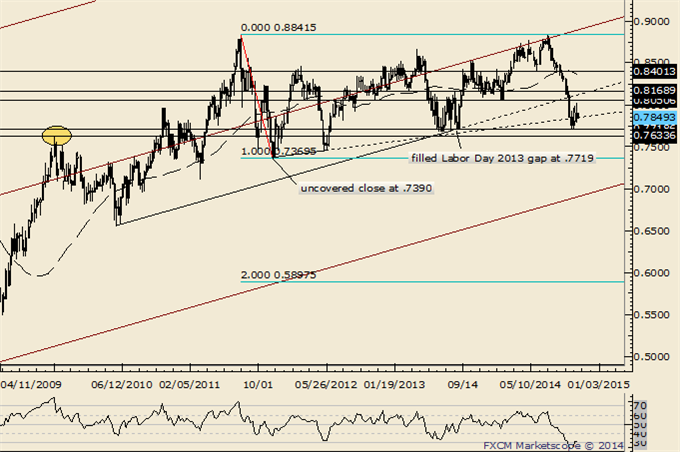
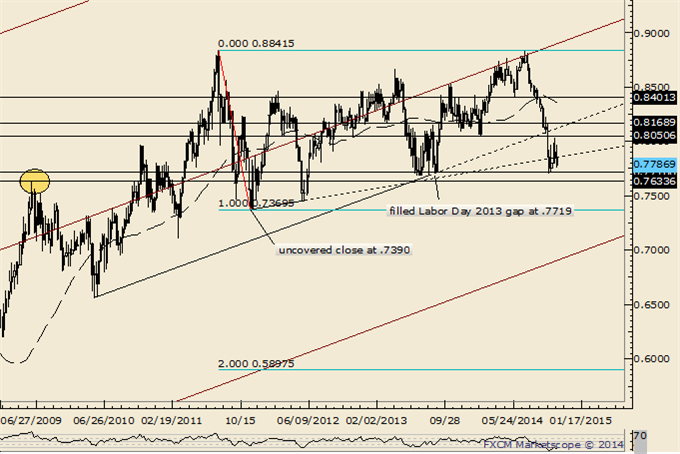
-“Don’t forget about the line that extends off of the 1996 and 2007 highs. That line crosses through the 2008, 2011, and highs as well. In 2011 (record free float high), the rate surged through the line in late July before topping on August 1st. The rate reversed this week from pips below the record high and above the mentioned line.”
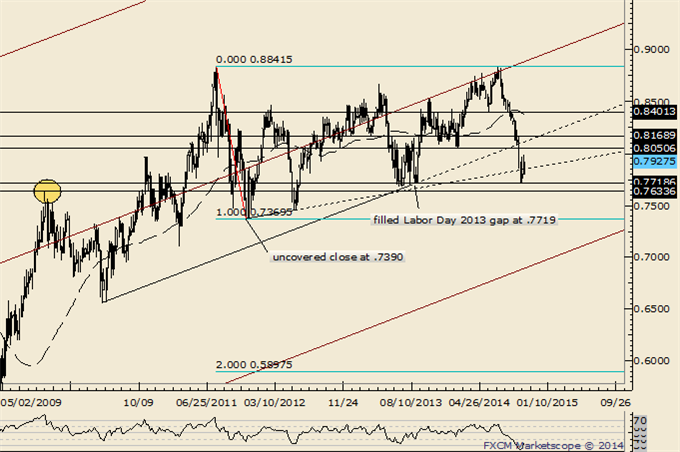
-“Above .8534 is needed in order to suggest that at least a minor low is in place. Look lower as long as price is below that level.” The pivot can be lowered to .8169. The February low is now resistance at .8050. The gap from Labor Day 2013 has held as support so far at .7720 but weakness below opens up the October 2009 high at .7634. Ultimately, weakness below .7370 would confirm a double top with an objective of .5898.
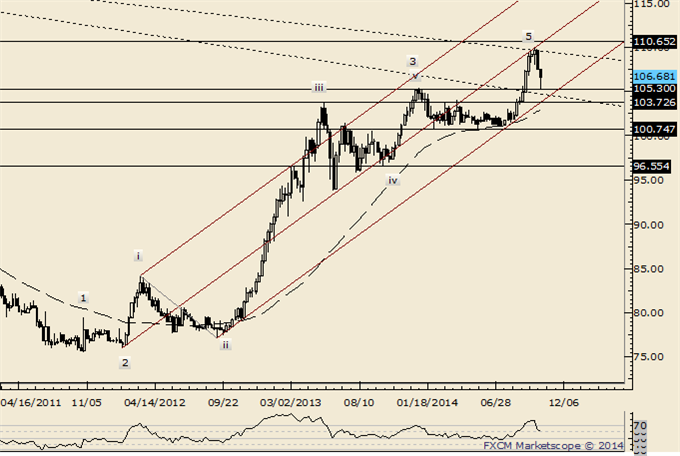
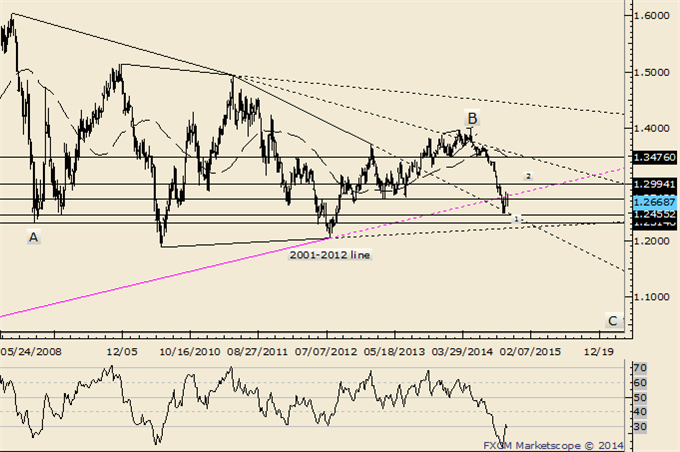
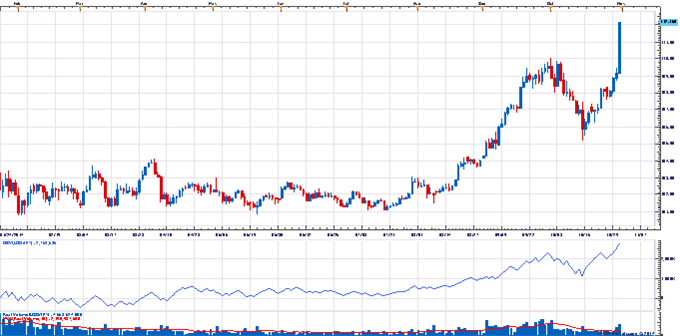
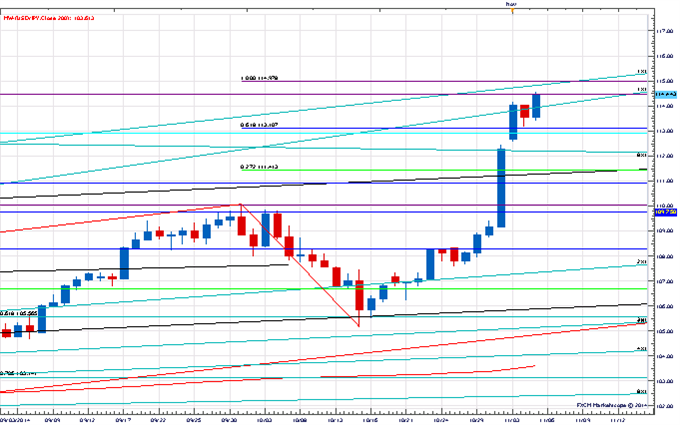
USD/JPY
Weekly
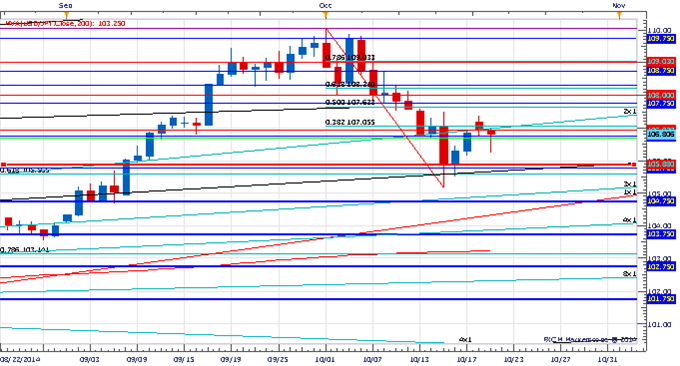
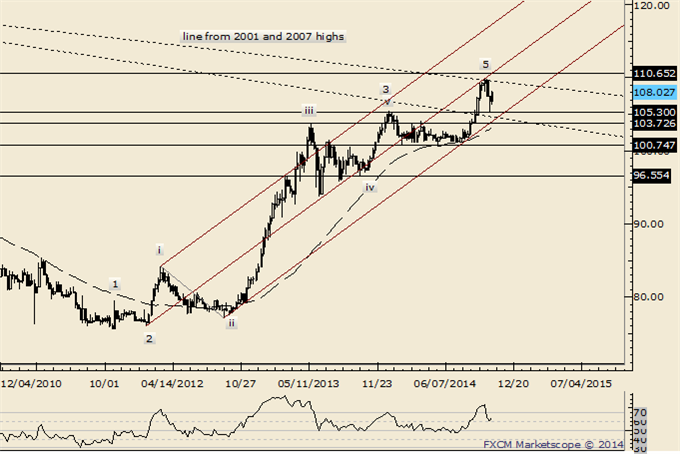
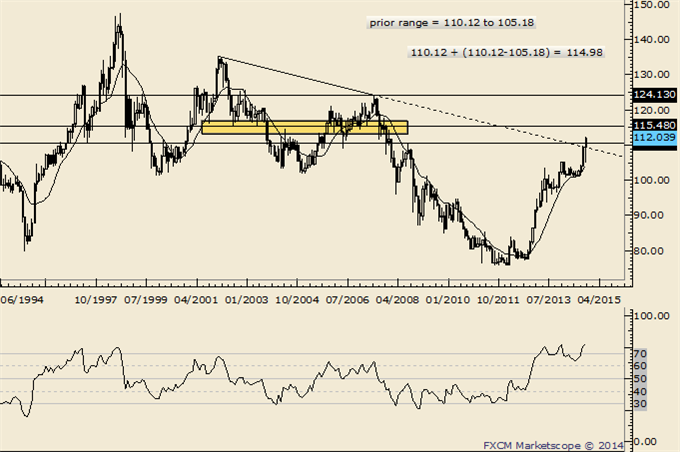
-“5 waves up from the 2011 low are counted which raises the risk of a sharp reversal lower from the trendline that extends off of the 2001 and 2007 highs. 106.80 and 105.40 are reaction levels (support).” USDJPY dropped into the December high (and 2014 year open) this week, which provided support. Given the significance of the level at the recent top, I’m inclined to look at the short side on strength.
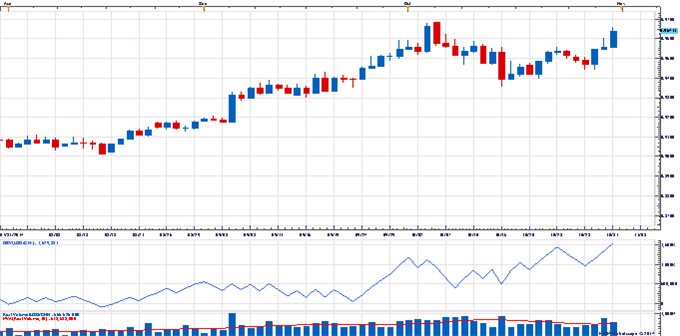
USD/CAD
Monthly
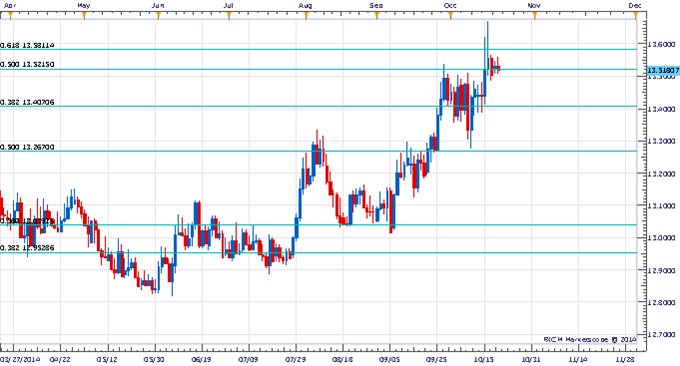
-USDCAD traded to its best levels since July 2009 this week but finished in the middle of its range for the week. The close and weak momentum profile casts doubt regarding the validity of the breakout but continue to look higher as long as price is above 1.1080. The rate also encounters potential resistance near 1.1450 from the upward sloping line that connects the October and 2011 and March 2014 highs.
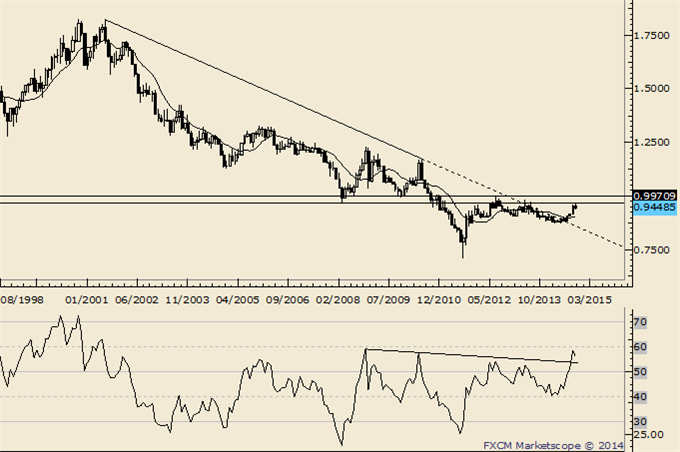
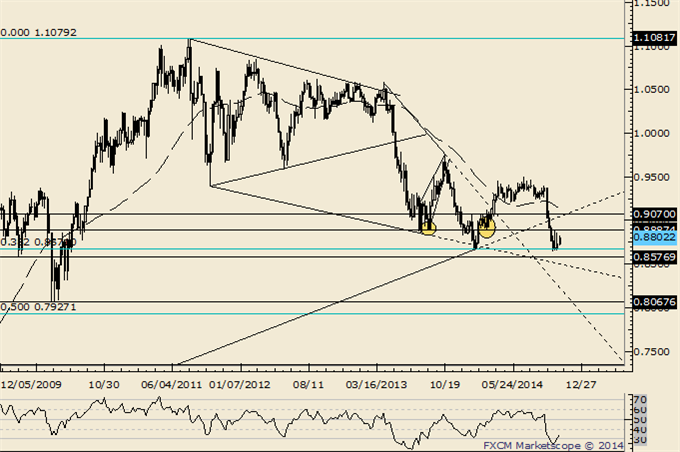
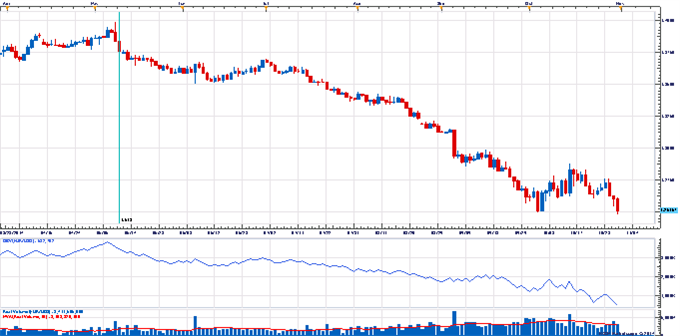
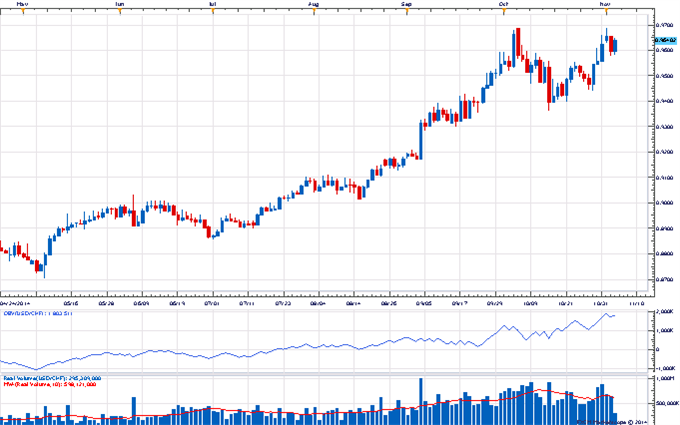
USD/CHF
Monthly
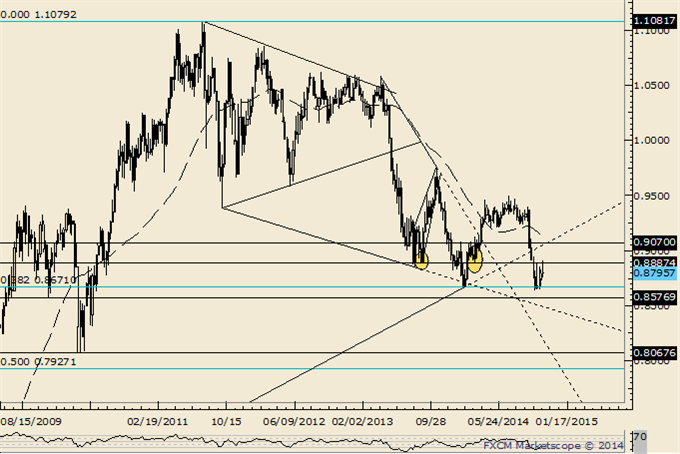
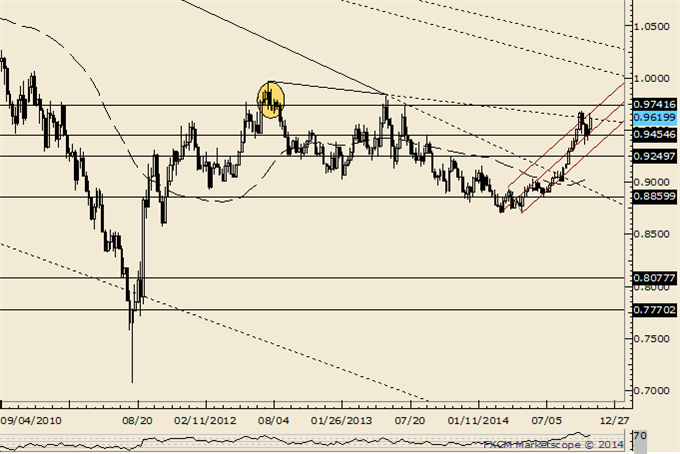
-USDCHF traded into the .9300-.9430 support zone this week, which may reset the market for another rally attempt. Remember, USDCHF broke above the trendline that extends off of the 2001 and 2010 highs. Like EURUSD, USDCHF monthly RSI broke from a potentially long term basing pattern. As long as .9300 holds, look higher.
More...


 Reply With Quote


Bookmarks