
 7Likes
 LinkBack URL
 About LinkBacks


- EUR/USD stalls ahead of key Gann level
- GBP/USD in consolidation mode
- EUR/CHF cyclical confluence early this week
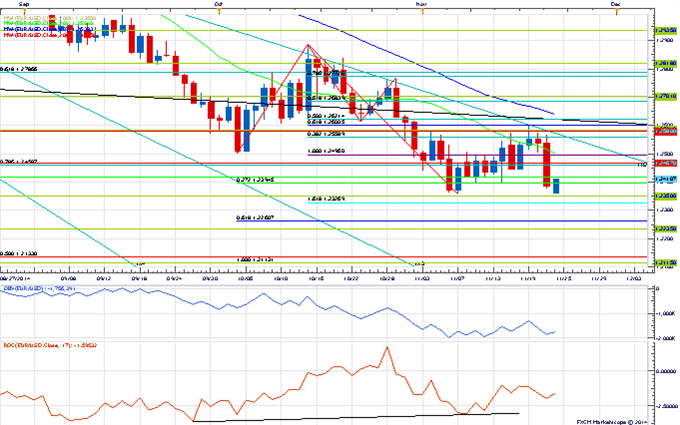
EUR/USD
- EUR/USD fell sharply lower last week after failing at the 1x2 Gann angle line of the year’s high in the 1.2600 region
- Our near-term trend bias is negative in the exchange rate while below 1.2505
- A Gann level at 1.2350 is the next downside pivot of note in the exchange rate
- The next turn window of significance is eyed early next month
- A close over 1.2505 would turn us positive on EUR/USD
EUR/USD Strategy: Like the short side while below 1.2500.
Instrument Support 2 Support 1 Spot Resistance 1 Resistance 2 EUR/USD 1.2325 1.2450 1.2405 1.2455 1.2505
GBP/USD
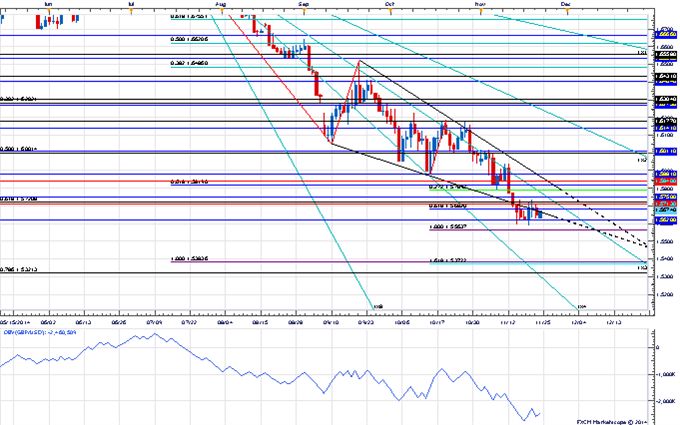
- GBP/USD is in consolidation mode above the 1.5620 12th square root relationship of the year’s high
- Our near-term trend bias is lower in GBP/USD while below 1.5840
- A close under 1.5620 is needed to signal that a new leg lower in the rate is underway
- A very minor turn window is seen on Tuesday
- A close over the 2nd square root relationship of the year’s low at 1.5840 would turn us positive on Cable
GBP/USD Strategy: Like the short side while under 1.5840.
Instrument Support 2 Support 1 Spot Resistance 1 Resistance 2 GBP/USD 1.5565 1.5620 1.5675 1.5720 1.5840
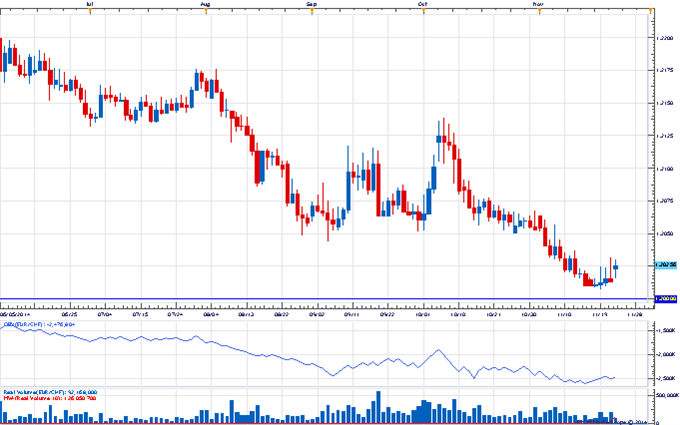
EUR/CHF
We don't like betting on central bank interventions. As traders who have been long the EUR/CHF over the past few months can probably attest - central banks are not always on the same time table as speculators. The ‘mental capital’ wasted on waiting for central banks to do what they promised is usually not worth the effort. That said, there are times when cyclical relationships begin to align with the agenda of the monetary authorities. We think we are about to undergo one of those periods in EUR/CHF as several medium-term cyclical relationships are converging over the next few days. In our view, this increases the potential for a change in trend or at least some decent sort of counter trend attempt. Coincidentally (or perhaps not) this timing relationship convergence is coinciding with a more positive news cycle with respect to the cross as recent opinion polls regarding the Swiss gold referendum have swung dramatically in favor of the “No” camp which should help relieve some of the recent pressure. Also, this morning’s sight deposit numbers seem to confirm that the SNB indeed has been intervening.
--- Written by Kristian Kerr, Senior Currency Strategist for DailyFX.com
More...


 Reply With Quote


Bookmarks