EUR/USD Current price: 1.3076
The EUR/USD was hit after the US opening, when Mario Draghi in a press conference in Rome, stated that the ECB is ready to cut rates again if necessary. After a dull European session that saw the pair trading in a 20 pips range for most of a day, the news put the common currency under pressure, sending EUR/USD to the 1.3050 price zone. Bounce after the low was again supported by US stocks that hold at record highs as the day comes to an end. Anyway, and despite the intraday movements, Monday has add no definition to EUR/USD trend: the pair continues in its 1.30/1.32 range as it has been for nearly a month already.
As for the short term, the hourly chart maintains a bearish tone ahead of Asian opening, with 20 SMA gaining bearish momentum above current price and indicators standing in negative territory. Buyers however will surge in dips up to 1.2970, 23.6% Fibonacci retracement of the 1.3710/1.2744 daily fall.
Support levels: 1.3070 1.3040 1.3000
Resistance levels: 1.3115 1.3144 1.3190*
EUR/JPY Current price: 129.90
The EUR/JPY surged up to 130.40 before easing back towards it daily opening, about to end the day with no changes. Once again, failure on USD/JPY to firmly advance over the 100.00 level maintains buyers limited, and even force some profit taking, helped no doubts by Mr. Draghi. The EUR/JPY hourly chart shows indicators flat around their midlines, while moving averaged stand well below from current price, first one around 128.80, also strong static support level. In the 4 hours chart technical readings maintain a positive tone, although with no strength: as said yesterday, the ability to extend gains, will depend mostly on EUR self strength, something not quite clear these days.
Support levels: 129.70 129.30 128.80
Resistance levels: 130.30 130.80 131.10
GBP/USD Current price: 1.5541
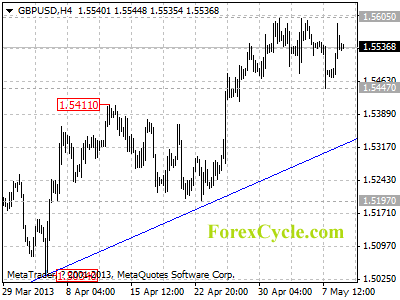
GBP/USD edges lower but mostly range bound, with still no clear direction midterm: the pair has rose to the 50% retracement of its latest daily fall at 1.5605, and despite unable to break higher, there are no signs pointing for an interim top. Ahead of Asian opening, the hourly chart shows price steady below 20 SMA and indicators aiming to recover below their midlines, while in the 4 hours chart technical indicators turned bearish, and accelerate lower, suggesting a deeper correction underway: key support is now the 1.5490 level as once below, the pair has scope to extend its slide up to 1.5420, 38.2% retracement of its latest daily fall.
Support levels: *1.5530 1.5490 1.5450*
Resistance levels: 1.5580 1.5610 1.5650*
USD/JPY Current price: 99.34
The USD/JPY holds near the daily high of 99.45 and continues pressuring higher with the hourly chart showing indicators in positive territory, although flat. 100 SMA accelerates higher, still well below current price, around 98.10, and below 200 one, which suggest the upside is not a done deal yet. In bigger time frames, the dominant trend is still clearly bullish, yet unless a strong acceleration higher, there are no signs suggesting further gains ahead.
Support levels: 98.80 98.40 98.10*
Resistance levels: 99.45 99.70 100.00
AUD/USD: Current price: 1.0250
The AUD/USD again bounced from 1.0220, third time in less than 2 weeks, although holds now below 1.0260 level, immediate resistance. The hourly chart shows price below a strongly bearish 20 SMA converging with mentioned static resistance, while indicators hold in negative territory, after correcting oversold readings. In the 4 hours chart price also stands below a bearish 20 SMA, although indicators aim higher around their midlines, giving the pair a more neutral stance. The dominant trend in the pair is still bearish, with move upwards seen as selling opportunities. RBA meeting today however, may set the tone, as there’s a chance of a rate cut: if so, expect the pair to finally break below mentioned floor.
Support levels: 1.0220 1.0180 1.0130
Resistance levels: 1.0260 1.0300 1.0335*
More...


 7Likes
 LinkBack URL
 About LinkBacks


 Reply With Quote


Bookmarks