Page 15 of 81 FirstFirst ... 5 13 14 15 16 17 25 65 ... LastLast
Results 141 to 150 of 809
Like Tree6Likes

Technical Analysis

This is a discussion on Technical Analysis within the Forex Trading forums, part of the Trading Forum category; Now we just need to figure out what normal is J The USD was the big winner in the month-end ...


  1. #141
    member TechnoMeter's Avatar
    Join Date
    Apr 2013
    Posts
    1,636
    Blog Entries
    425

    FX market returning to normal after heavy month-end flows

    Now we just need to figure out what normal is J The USD was the big winner in the month-end flows stakes, making solid gains against all the other major currencies. The AUD was the biggest loser on Friday, with bearish sentiment picking up steam.
    Today sees the release of Japanese manufacturing industry sentiment (Tankan report) and this will*be followed later today by Chinese PMI data. Tomorrow’s RBA meeting is also coming into view and traders are starting to position themselves for all of these risk events.

    USD/JPY has started the week on a bullish note and demand has been quite strong in early trade. Support levels should be very strong near previous highs at 98.75 and Fibo resistance at 99.90 is the bulls target (see chart). The fundamental outlook is bullish, but the market is long, so I prefer to wait for swing trading opportunities.


    EUR/USD is opening the week just above 1.3000 and the big factor here will be the size of reported Sovereign bids towards 1.2970/80. Trend-line support comes in near 1.2925 (see chart).


    EUR/JPY has again stalled just above 129.50 (see chart). A clean break above there targets a Fibo resistance at 130.45.


    Cable is supported by very strong technical support at 1.5155/80 (see chart) with the double-bottom neckline and a 61.8% retracement (1.4830/1.5750) lying close together.


    AUD/USD closed last week below previous support at .9140, which is usually a bearish sign. There isn’t much in the way of technical support now until .8925 so the bears look to have the stronger cards in the short-term.

    The AUD crosses are sending mixed signals; AUD/NZD continues to trade with a definite bearish*tendency although currently consolidating between 1.1735/1.2000, but the AUD has a better outlook against the JPY and the EUR.

    Weekly resistance at 1.4400 in EUR/AUD has held for another week and AUD/JPY support at 89.50 has also proven to be very reliable.
    Good luck today.


    More...

  2. #142
    member TechnoMeter's Avatar
    Join Date
    Apr 2013
    Posts
    1,636
    Blog Entries
    425

    Daily Chart Art - July 2, 2013


    GBP/USD: 4-hour


    Is a reversal in the works for Lady Cable? Looks to me like the pair is finding solid support at the 1.5200 handle. With bullish divergence forming as well, this could be the time to load up on those long positions! Watch out though, for a solid candle close below 1.5200, as that would signal that the recent downtrend ain't finished yet.

    More...

  3. #143
    member TechnoMeter's Avatar
    Join Date
    Apr 2013
    Posts
    1,636
    Blog Entries
    425

    USDJPY: 99.90-100.0 5 on the upside, 99.05-99.20 on the downside

    Propareos levels (areas where probabilities of price action reversal or saturation reach 90%; valid till 15:00 GMT):

    • EURUSD: 1.3090-1.3105 on the upside, 1.2980-1.2995 on the downside.
    • AUDUSD: 0.9280-0.9295 on the upside, 0.9120-0.9135 on the downside.
    • USDJPY: 99.90-100.0 5 on the upside, 99.05-99.20 on the downside.
    • GBPUSD: 1.5250-1.5265 on the upside, 1.5130-1.5145 on the downside.
    • USDCAD: 1.0575-1.0590 on the upside, 1.0465-1.0480 on the downside.
    • NZDUSD: 0.7855-0.7870 on the upside, 0.7730- 0.7745 on the downside.
    • EURJPY: 130.50-130.65 on the upside, 129.35-129.50 on the downside.
    • EURGBP: 0.8605-0.8620 on the upside, 0.8530-0.8545 on the downside.
    • USDCHF: 0.9510-0.9525 on the upside, 0.9415-0.9430 on the downside.
    • AUDJPY: 92.45-92.60 on the upside, 90.00-90.15 on the downside.
    • EURAUD: 1.4270-1.4285 on the upside, 1.4055-1.4070 on the downside.


    Warning! Propareos levels do not take into account fundamental developments. Their validity is reduced on days when the NFP is released and when Central Banks change their interest rate.


    More...

  4. #144
    member TechnoMeter's Avatar
    Join Date
    Apr 2013
    Posts
    1,636
    Blog Entries
    425

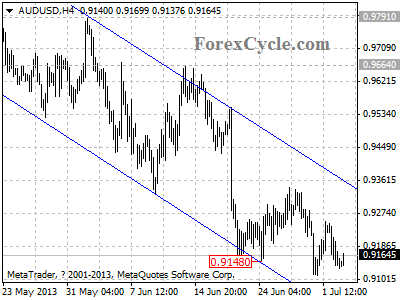
    AUDUSD stays within a downward price channel

    AUDUSD stays within a downward price channel on 4-hour chart, and remains in downtrend from 1.0582 (Apr 11 high), the price action from 0.9148 could be treated as consolidation of the downtrend. Further decline would likely be seen after consolidation, and next target would be at 0.9000 area. Key resistance is located at the upper line of the price channel, only a clear break above the channel resistance could signal completion of the downtrend.


    More...

  5. #145
    member TechnoMeter's Avatar
    Join Date
    Apr 2013
    Posts
    1,636
    Blog Entries
    425

    EUR/USD: Wild ride

    EUR/USD Current price: 1.2958


    Market is seeing some wild ranges this Wednesday, with the EUR/USD falling as low as 1.2922 on the back of disappointing Services PMI’s across Europe, but recovering up to 1.2983 as stocks surged from their lows. Wide movements but little definitions for the pair, as it trades a few pips away from its daily opening. In the hourly chart, technical readings maintain the bearish tone, with indicators heading south below their midlines and price unable to clearly recover above a bearish 20 SMA. In the 4 hours chart the picture is also bearish, although losses below mentioned low are required to confirm the intraday trend.

    Support levels: 1.2945 1.2910 1.2880
    Resistance levels: 1.2980 1.3010 1.3050

    GBP/USD Current price: 1.5255


    Pound soared amid better than expected numbers in the UK, rising up to 1.5280 against the greenback before easing some. Maintaining the positive tone, the hourly chart shows indicators heading higher despite in overbought territory, while 20 SMA turns north below current price. In the 4 hours chart technical readings also turned bullish, but price halted a few pips below the 61.8% retracement of its latest bullish run at 1.5290 and unless a clear break of the level, buying interest will remain limited.

    Support levels: 1.5220 1.5180 1.5135
    Resistance levels: 1.5290 1.5320 1.5350*

    USD/JPY Current price: 99.69


    Yen accelerate higher on bad European news, as EUR/JPY shed near 200 pips in less than an hour, sending USD/JPY below key 100.00 level. So far the pair is finding short term support around its 100 SMA, around 99.40, as the hourly chart shows price is unable to establish below. Indicators turned flat in oversold readings, suggesting a halt in the slide. However, with price below 100.00 risk remains to the downside, with a price acceleration below mentioned 99.40 opening doors for a test of the 98.80 area.*
    Support levels: 99.40 99.10 98.80
    Resistance levels: 100.00 100.30 100.70*

    AUD/USD: Current price: 0.9065


    Aussie accelerated lower against the greenback, weighted by negative stocks around the word and disappointing Retail Sales in Australia, holding near its daily low of 0.9051. The hourly chart shows price below a strongly bearish 20 SMA while indicators head again south after correcting oversold readings. In the 4 hours chart technical readings are also bearish, with scope for break below 0.9000 over the upcoming sessions.

    Support levels: 0.9050 0.9020 0.8970
    Resistance levels: 0.9070 0.9110 0.9150*


    More...

  6. #146
    member TechnoMeter's Avatar
    Join Date
    Apr 2013
    Posts
    1,636
    Blog Entries
    425

    Daily Chart Art - July 4, 2013


    EUR/USD: 4-hour

    Euro bears watch out! EUR/USD just bounced from the bottom of a risingchannel on the 4-hour time frame and it looks like the bulls are ready to pushit higher. Of course, it doesn’t hurt that the euro is currently sitting at big1.3000 handle. A stop loss below yesterday’s lows could still get you a tightrisk ratio if you believe that this baby would reach the top of the channel.Euro bears watch out! EUR/USD just bounced from the bottom of a risingchannel on the 4-hour time frame and it looks like the bulls are ready to pushit higher. Of course, it doesn’t hurt that the euro is currently sitting at big1.3000 handle. A stop loss below yesterday’s lows could still get you a tightrisk ratio if you believe that this baby would reach the top of the channel.


    More...

  7. #147
    member TechnoMeter's Avatar
    Join Date
    Apr 2013
    Posts
    1,636
    Blog Entries
    425

    Daily Chart Art - July 5, 2013


    EUR/AUD: 4-hour

    If you wanna steer clear of the dollar this NFP Friday, you may want to take a look at this sexy setup on EUR/AUD. On the 4-hour chart, we see that price is currently testing support at the rising trend line. Stochastic already indicates oversold conditions too! A bounce off 1.4100 could mean that we'll soon see the pair rally up to 1.4400. But be careful! A close below this week's low at around 1.4050 could mean that we'll see a drop to 1.3800!


    More...

  8. #148
    member TechnoMeter's Avatar
    Join Date
    Apr 2013
    Posts
    1,636
    Blog Entries
    425

    Central banks and the NFP mix it up

    Polish Zloty (EUR/PLN) – MPC cuts rates to lowest level in history

    For weeks like the ending one, traders wait for a long time. We experienced a lot of action from central banks (ECB and BoE) and the NFP report. The beginning of the week was rather calm as all of us were waiting for Thursday and Friday, and we are not disappointed. Statements made by Mario Draghi, Mark Carney and the better than expected NFP reading had impact on emerging and they also set up a path for the upcoming weeks. The Zloty was under the influence of the factors mentioned above although some crucial macro data was published from the Polish economy. The PMI index declined to 48.2 points while the unemployment rate dropped to 13.2%. The main event of the week was the MPC’s monetary policy meeting, on which interest rates were cut by 25bp to its historic low of 2.5%. The reaction of the market was mild as it was already discounted. Marek Belka, MPC’s President, signaled this ends the cycle of interest rates cut but I would not rule out one more if the situation worsens or inflation drops close to 0%.For the last two weeks the EUR/PLN traded in a narrow 4.30 – 4.34 range and it broke the support on Thursday after the ECB and BoE statements. The downward movement was stopped at 4.26, not only 38.2% retracement level of the whole upward move, but also where the upward trendline runs. The rebound took the market back to 4.30 and currently is fighting at this resistance. Breaking the support would probably trigger a downward movement towards 4.23 (50% retracement level). It seems though there is a higher chance for an upward move. The stochastic oscillator is showing the market is oversold but also the gaining USD should make it difficult for the PLN to appreciate in the upcoming weeks.


    Hungarian Forint (EUR/HUF) – expecting EUR/HUF to fly higher

    Amid political crisis in Portugal and renewed concerns Greece can meet obligations concerning budget diet Hungarian forint continued to gain strenght and touched a two-week low against the euro. Levels below 293 were hit on Thursday after Mario Draghi came out with new communicational style and pledged to keep monetary policy accommodative for an “extensive period”. Investors were able to hear mainly good news from the economic publications, especially about the trade balance that continues to increase and in June surpassed 717 million euros. The positive trend in the trade surplus supports the Forint on medium to long term scale but for the day-to-day followers of Hungarian instruments positive comments from the City caused pleasant surprise. Standard Bank followed JP Morgan and came out with an optimistically tuned recommendation about Hungarian sovereign debt and government bonds suggesting to overweight them in portfolios. Despite some undeniable achievements Hungarian credit ratings are is still kept in the junk category thus holding back part of large institutional investors to buy.


    Technical trading on the EUR/HUF was relatively simple as closing short positions around the 200 DMA level was more than reasonable. After taking profit on short positions a swing to higher levels is more probable with a resistance set by the descending trendline around the 298 price levels. Risk reward driven trading also suggest favoring long positions over short ones on the daily chart.

    Romanian Leu (EUR/RON) – Rate cut to 5% has been priced in

    The National Bank cut rates to 5%, following an almost two-year pause, in the hope the credit flows will start oiling the pipes of the economy again. It has enough room to maneuver because inflation, now at around 5.32%, is projected to come towards the 3.5% upper limit of the targeted interval in the second half of the year. The move has apparently been priced in, with EUR/RON stable after the cut. The unemployment rate was at 7.5%, in May a 0.3 pp increase over April. But GDP managed to post a 0.6% q/q increase in Q1 2013 and estimates for 2013 growth have turned more optimistic, with some seeing a figure of more than 2%. The summer will be more interesting than usual, as the governing alliance may suffer internal divisions, and the global risk appetite is likeley to transfer its swings in a more pronounced manner than usual toward EURRON. For the time being, a consolidation would possibly be the most likely outcome.Technical analysis perspective is now a little more quiet. There is a lateral development that could lead to a full-scale rectangle, with its respective targets. Therefore levels to watch are 4.4198 on the downside, with a break possibly leading to a test of the 4.3965 support, followed by the full target of the anticipated consolidation, around 4.3754. On the upside, any close above 4.4655 may provide fuel for a test of 4.5111, while the strong resistance is at 4.5449, mid-June local high.


    More...

  9. #149
    member TechnoMeter's Avatar
    Join Date
    Apr 2013
    Posts
    1,636
    Blog Entries
    425

    What I See in FX Market

    EURUSD

    What Forex Target Traders See: We are currently sitting @ 1.2830 on the S6 form the pivot point and a double bottom. We are waiting to see if we get a bounce back to the 1.2900 and then a move back down to the 1.2700 area. The average (14 day) daily true range (ATR) for the pair currently is 108 pips.*


    ——————————————————————————–

    USDJPY

    What Forex Target Traders See: We are currently @ 101.27 in a channel which is bullish for the pair. Looking for a move all the way to the day chart top 103.75. stalls at the resistance cluster @ 101.84-102.26. Dips will give a great opportunity on the way. average (14 day) daily true range (ATR) for the pair currently is 129 pips.


    ——————————————————————————–

    GBPUSD

    What Forex Target Traders See: Cable is currently @ 1.4901. Watch for a bounce back to the .786 fibo @ 1.5051 then a move down to the S7 @ 1.4785 and that is another bounce point. The average (14 day) daily true range (ATR) for the pair currently is 146 pips.


    ——————————————————————————–

    AUDUSD – A great smooth currency for Newbie’s!

    What Forex Target Traders See: Aussie is currently @ 0.9060 in a foiling wedge which continues the bearish view but warns of an end. Look to the 1.618 Fibo first @ 0.8978with the S8/2.270 and day chart bottom at 0.8792-0.8835. The average (14 day) daily true range (ATR) for the pair currently is 135 pips.


    More...

  10. #150
    member TechnoMeter's Avatar
    Join Date
    Apr 2013
    Posts
    1,636
    Blog Entries
    425

    US Dollar Crumbles as S&P 500 Pushes Toward May Top

    THE TAKEAWAY: The US Dollar dove lower to overturn the rising trend from mid-June while the S&P 500 pushed higher, setting its sights on the May swing high.

    US DOLLAR TECHNICAL ANALYSIS – Prices turned lower as expected, with sellers testing below support at 10803, the 38.2% Fibonacci retracement. A break downward on a daily closing basis exposes the 50% level at 10739. Near-term resistance is at 10882, the 23.6% level, with a move back above that eyeing the July 8 swing high at 11009.


    S&P 500 TECHNICAL ANALYSIS – Prices moved higher as expected after putting in a bullish Piercing Line candlestick pattern. The bulls are now poised to challenge the 76.4% Fibonacci expansion at 1675.10, with a break above that targeting the May 22 high at 1687.40 and the 100% level at 1710.90. Near-term support is at 1652.90, the 61.8% Fib.


    GOLD TECHNICAL ANALYSIS – Prices are moving higher after putting in a Bullish Engulfing candlestick pattern, taking out resistance at the 23.6% Fibonacci retracement (1252.80) to expose the 38.2% level at 1297.75. A further push above that aims for the 50% Fib at 1334.08. The 1252.80 mark has been recast as near-term support.


    CRUDE OIL TECHNICAL ANALYSIS– Prices advanced as expected after putting in a bullish Piercing Line candlestick pattern above trend line support. The bulls are now testing above resistance at 106.26, the 100% Fibonacci retracement, with a break higher targeting the 123.6% level at 109.46. Near-term support is at 103.35, the 78.6% Fib.


    --- Written by Ilya Spivak, Currency Strategist for Dailyfx.com

    More...

Page 15 of 81 FirstFirst ... 5 13 14 15 16 17 25 65 ... LastLast

Tags for this Thread

Bookmarks

Posting Permissions

  • You may not post new threads
  • You may not post replies
  • You may not post attachments
  • You may not edit your posts
  •