
 7Likes
 LinkBack URL
 About LinkBacks


Talking Points:
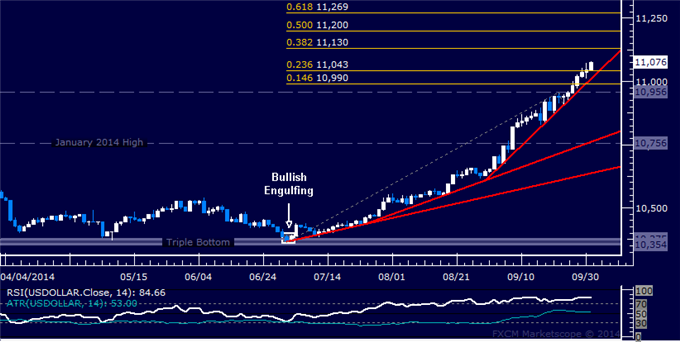
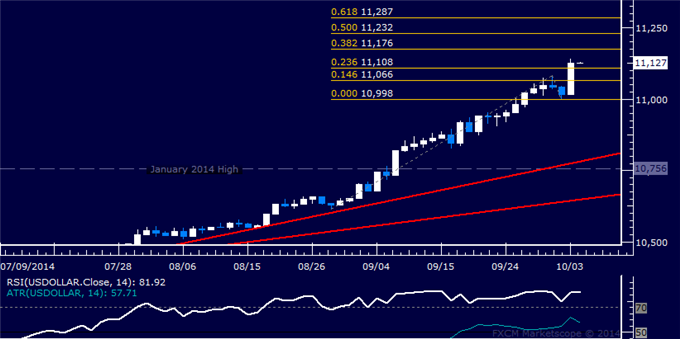
points to ebbing bullish momentum. Near-ter
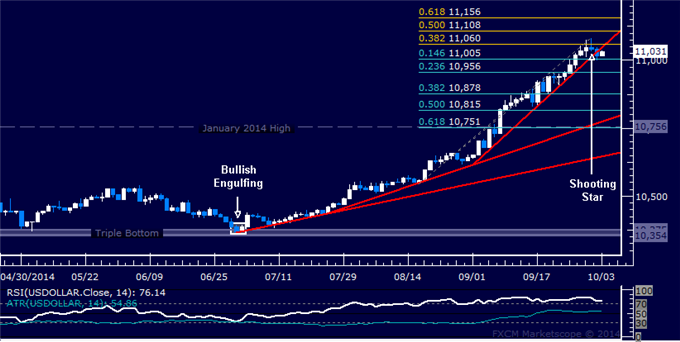
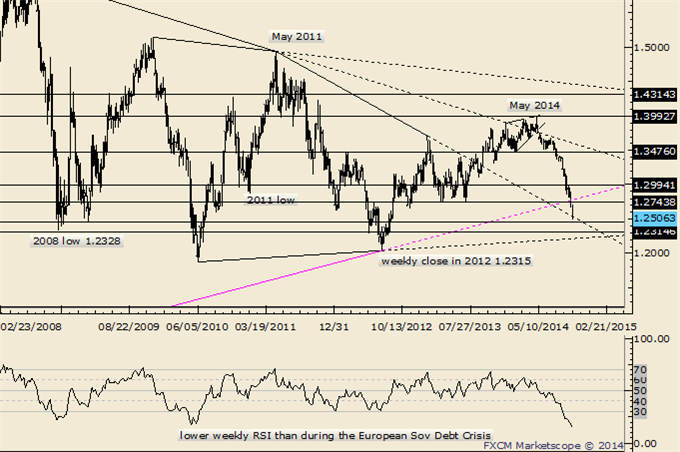
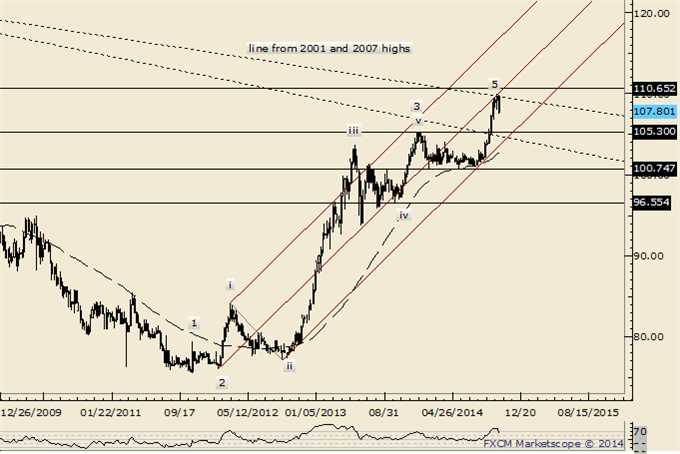
- US Dollar Chart Setup Warns of Losses as Upside Momentum Ebbs
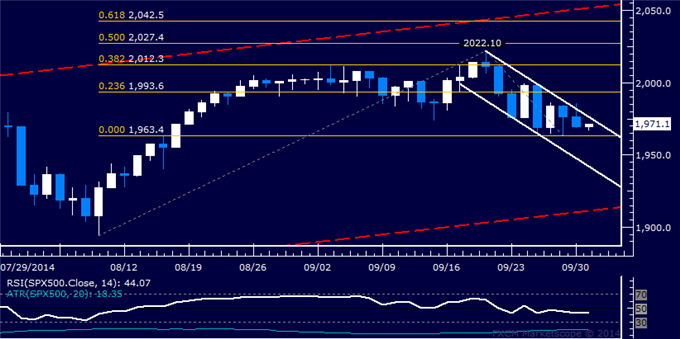
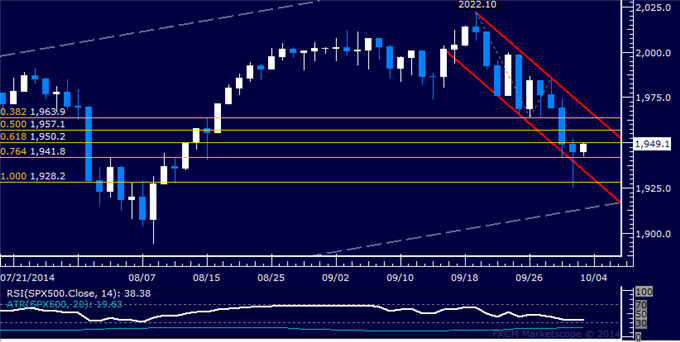
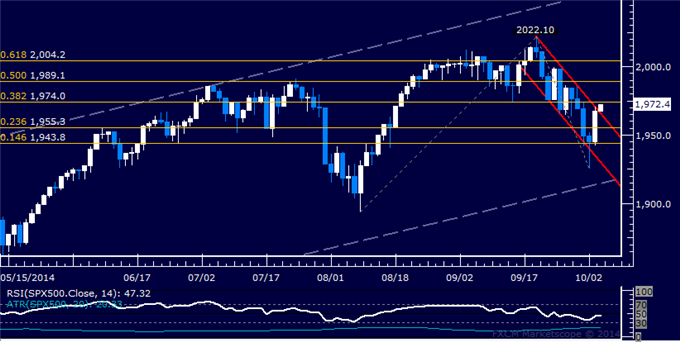
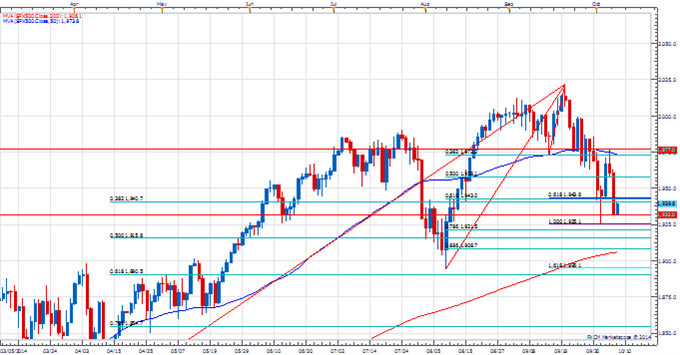
- S&P 500 Recoils Higher from Support But Topping Pattern Intact
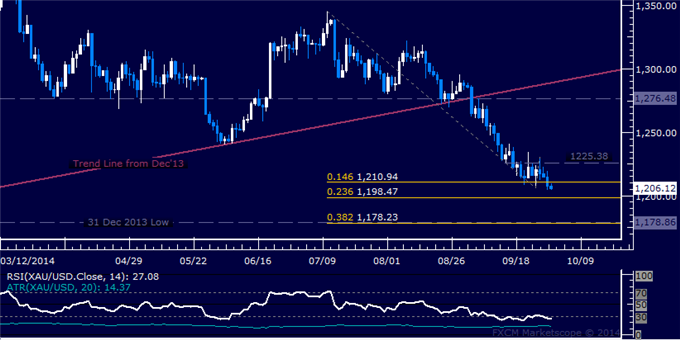
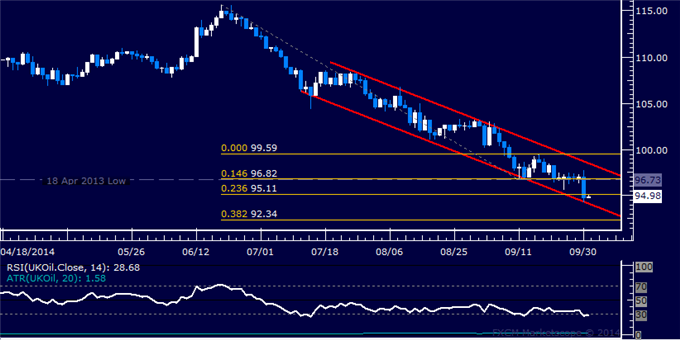
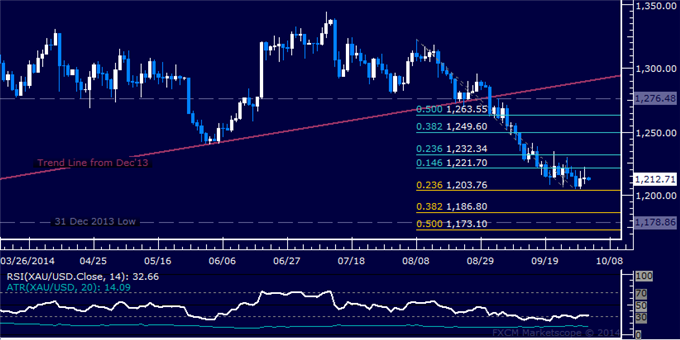
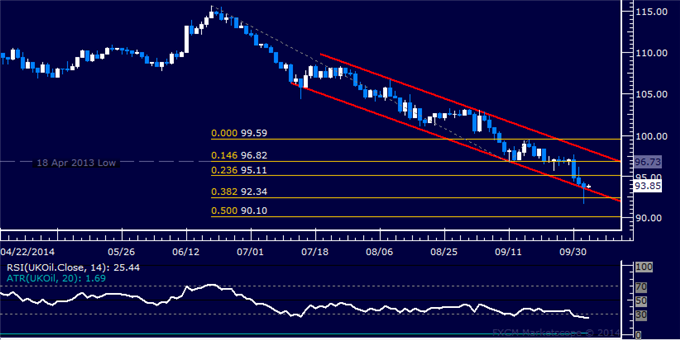
- Crude Oil Sinks to 26-Month Low, Gold May Be Readying a Bounce
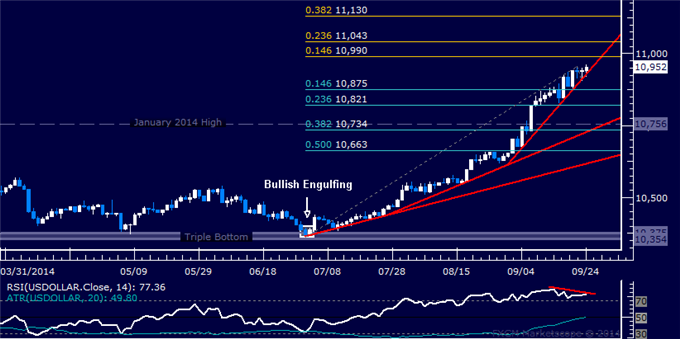
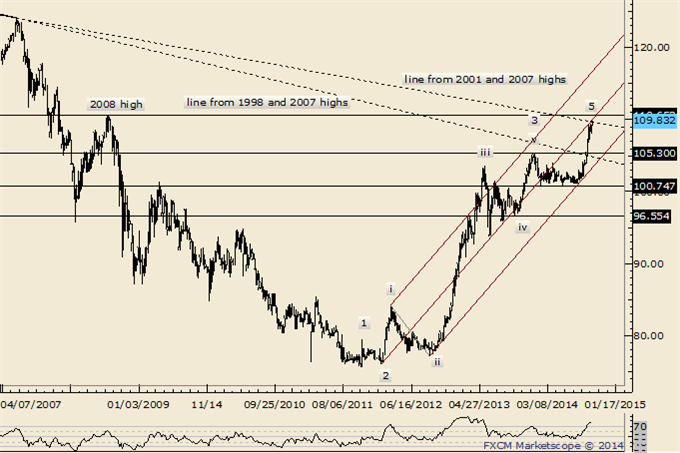
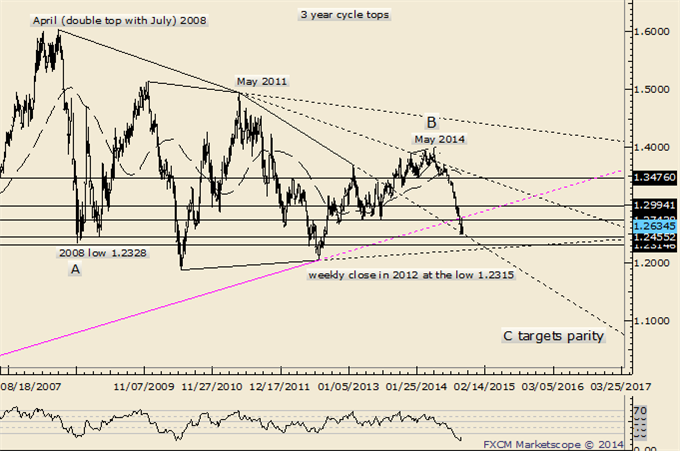
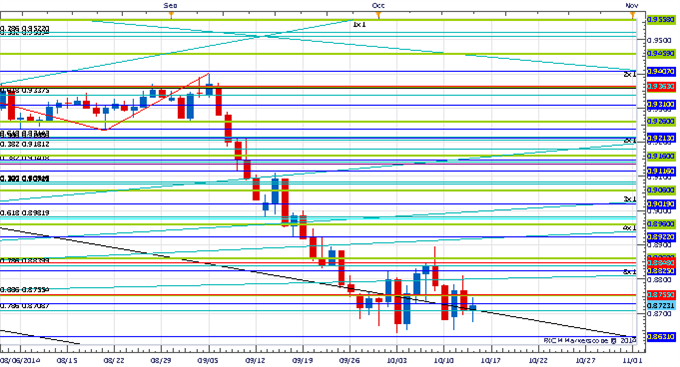
US DOLLAR TECHNICAL ANALYSIS – Prices may be on the verge of a correction lower as negative RSI divergence m support is at 10931, marked by a rising trend line set from set from late August, with a break below that on a daily closing basis exposing the 14.6% Fibonacci retracement at 10875. Alternatively, a turn above the 14.6% Fib expansion at 10990 opens the door for a challenge of the 23.6% threshold at 11043.
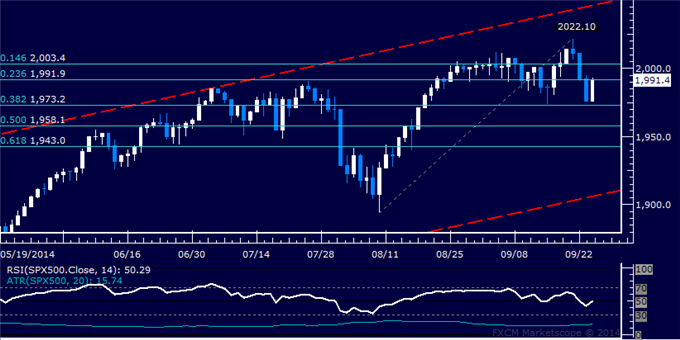
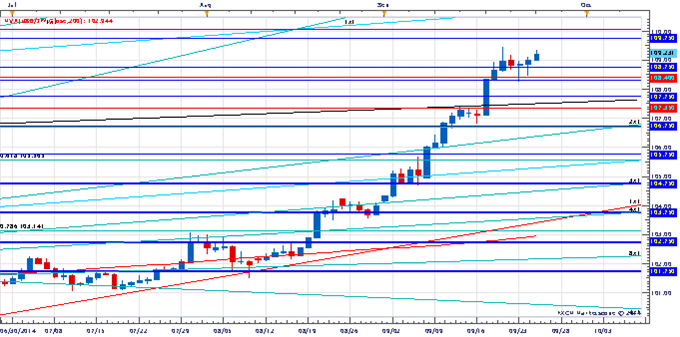
S&P 500 TECHNICAL ANALYSIS – Prices rebounded from support at 1973.20, the 38.2% Fibonacci retracement. A reversal back above the 23.6% Fib at 1991.90 targets the 14.6% expansion at 2003.40. Alternatively, a break below support on a daily closing basis exposes the 50% level at 1958.10.
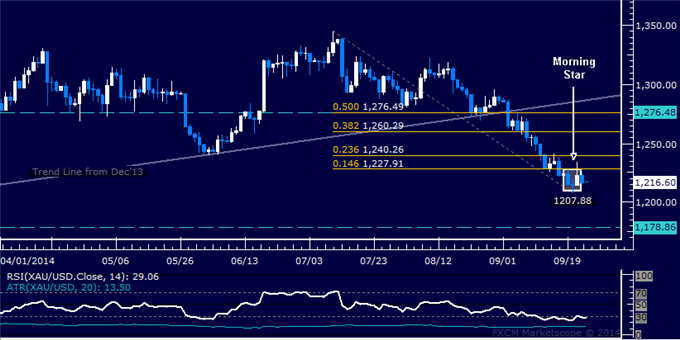
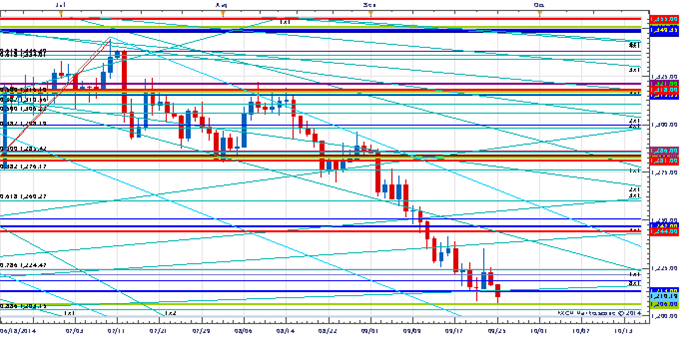
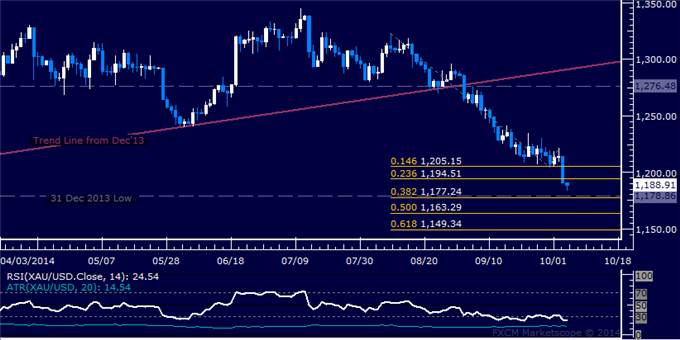
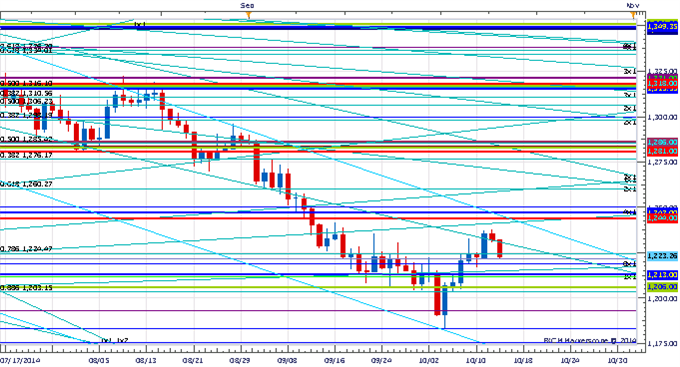
GOLD TECHNICAL ANALYSIS – Prices put in a bullish Morning Star candlestick pattern, hinting a move higher may be ahead. A break above the 14.6% Fibonacci retracement at 1227.91 on a daily closing basis exposes the 23.6% level at 1240.26. Near-term support is at 1207.88, the September 22 low.
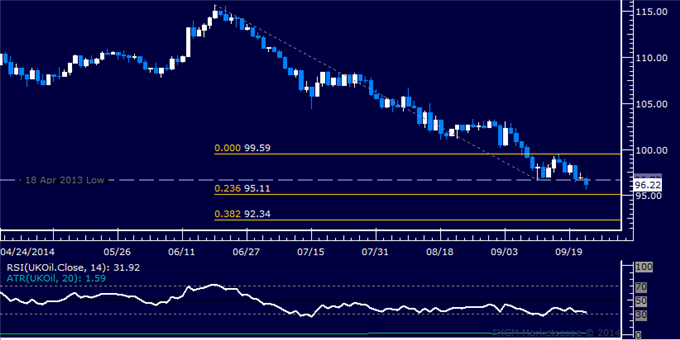
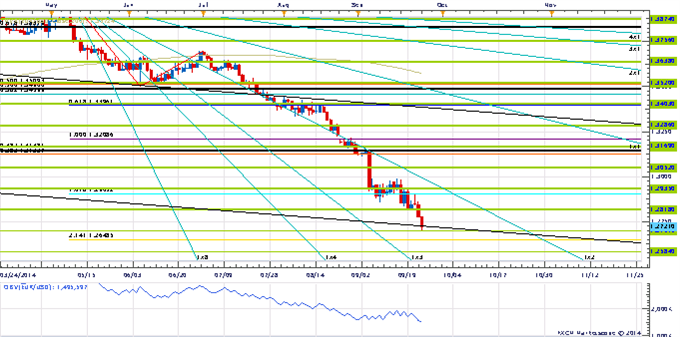
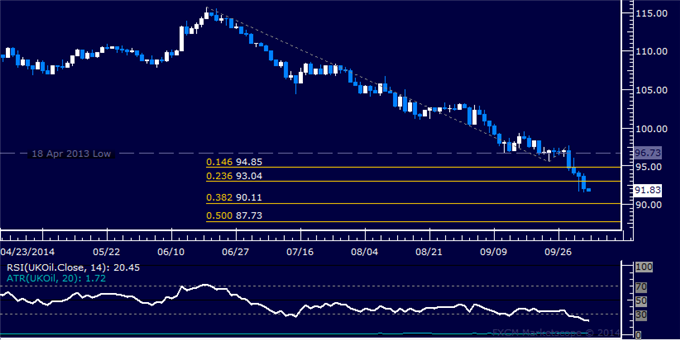
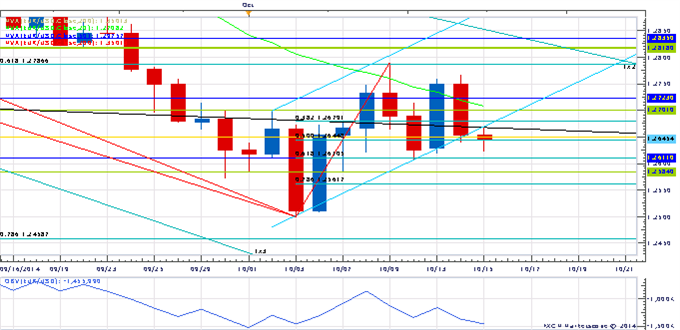
CRUDE OIL TECHNICAL ANALYSIS – Prices edged below support at 96.73, the April 2013 low, exposing the 23.6% Fibonacci expansion at 95.11. A further push below that targets the 38.2% level at 92.34. Alternatively, a reversal back above 96.73 aims for the September 17 high at 99.59
--- Written by Ilya Spivak, Currency Strategist for DailyFX.com
More...


 Reply With Quote


Bookmarks