
 7Likes
 LinkBack URL
 About LinkBacks


Talking Points
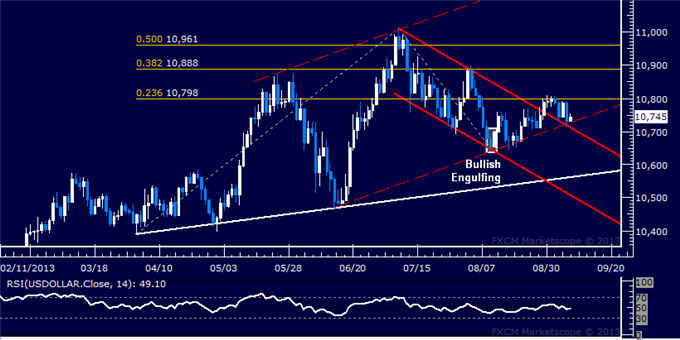
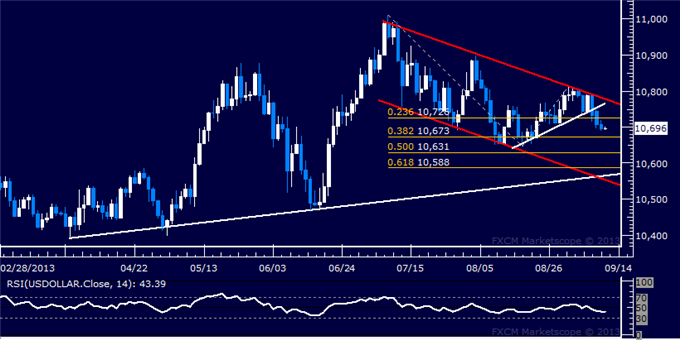
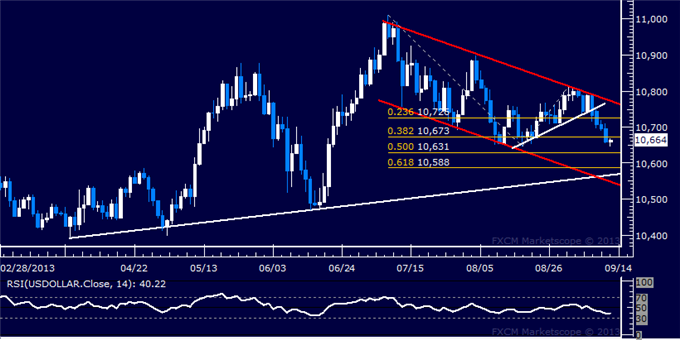
- US Dollar May Be Set to Resume Uptrend After Pullback
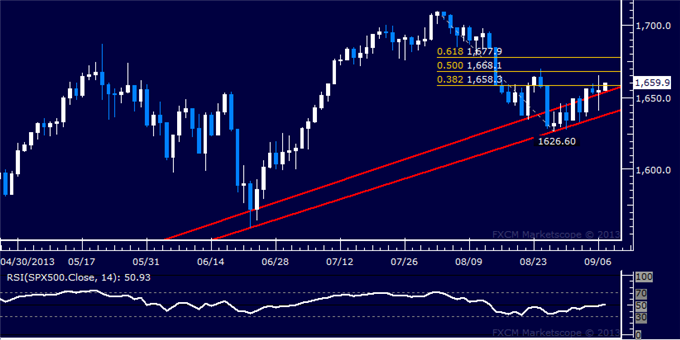
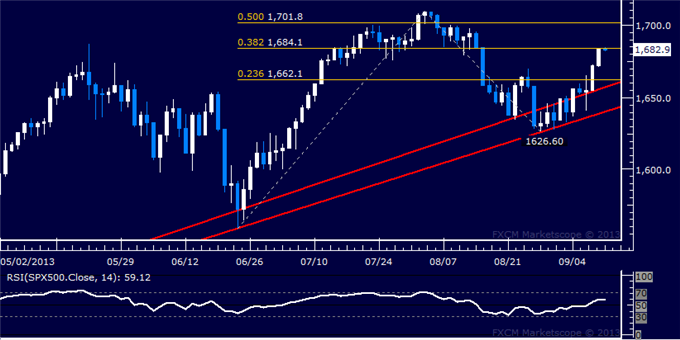
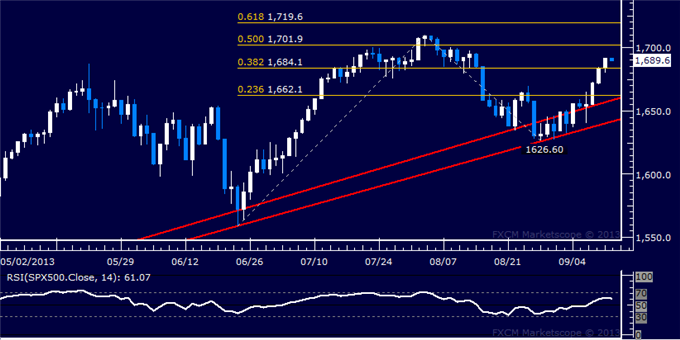
- S&P 500 Attempting to Carve Out Base at Key Support
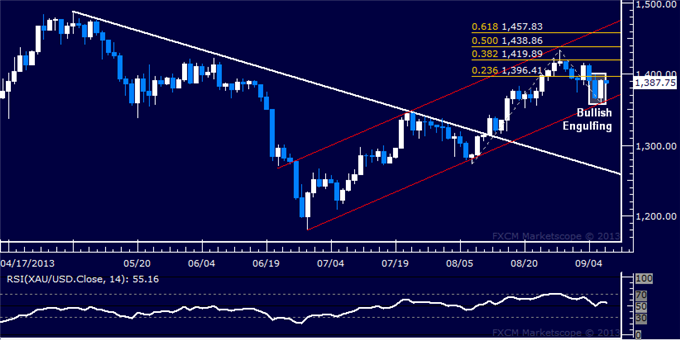
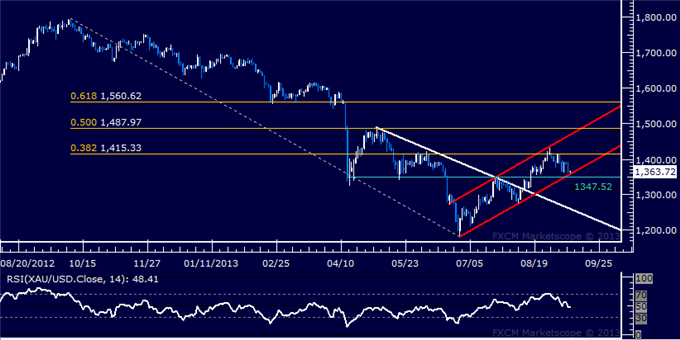
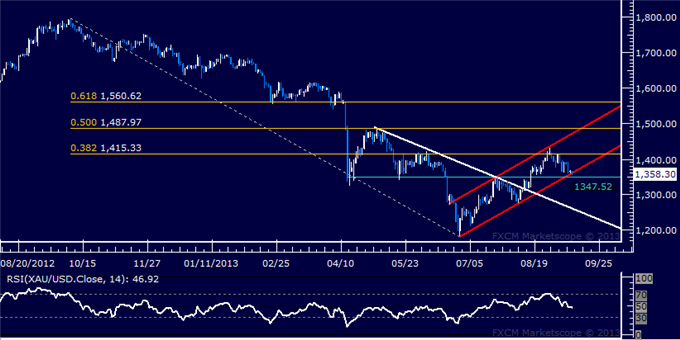
- Gold Prices Poised to Overtake $1400/oz Figure Again
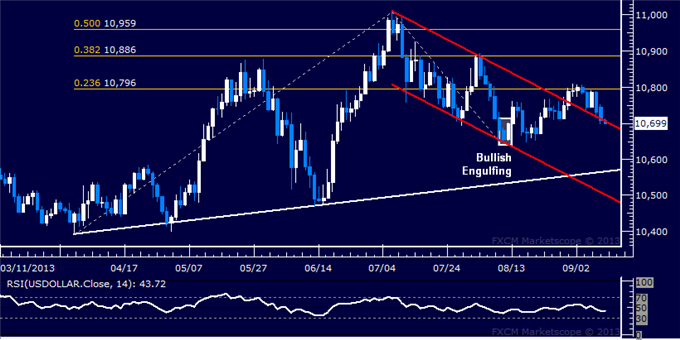
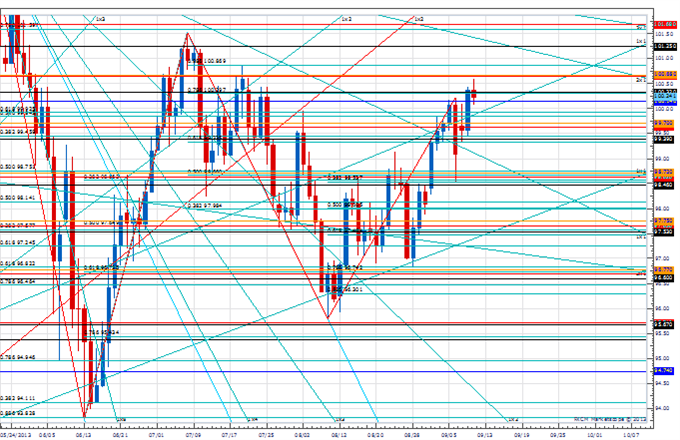
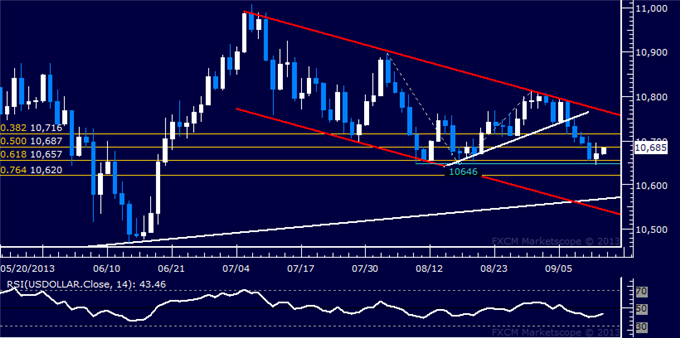
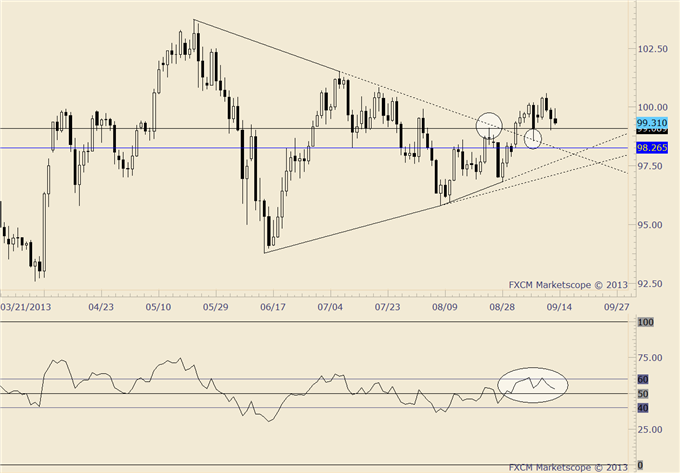
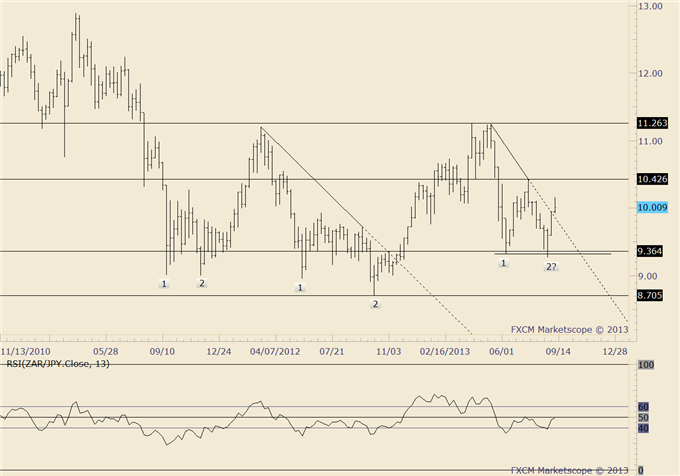
US DOLLAR TECHNICAL ANALYSIS – Prices appeared to have overturned a two-month down trend last week with a break above channel top resistanceset from July’s swing high. Initial resistance was met at 10798, the 23.6% Fibonacci expansion, with a pullback from this barrier now producing a retest of the channel top (10711). A push below that exposes the August 12 low at 10652. Alternatively, a reversal back above resistance aims for the 38.2% Fib at 10888
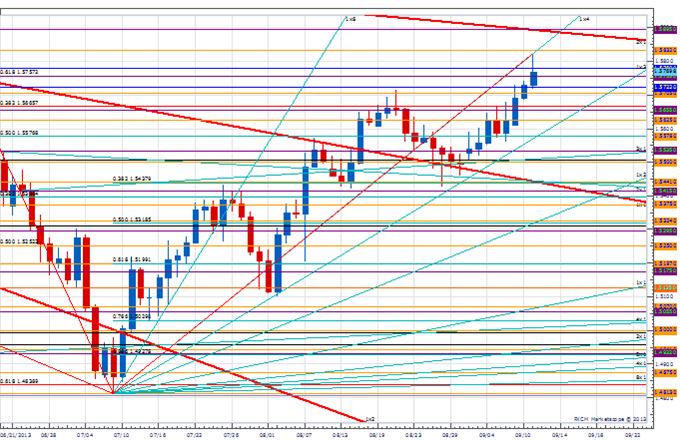
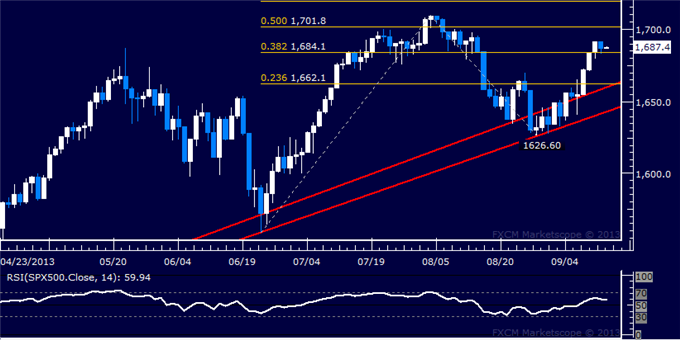
S&P 500 TECHNICAL ANALYSIS – An attempt to build meaningfully higher from a support region bracketed by a pair of trend lines set from the November 2012 continues. Near-term resistance is at 1658.30, the 38.2% Fibonacci retracement, with a break above that targeting the 50% level at 1668.10. Initial trend line support is now at 1653.80, followed by the outer barrier at 1637.70.
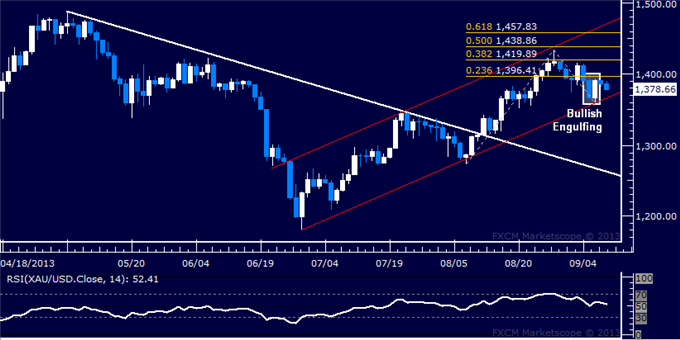
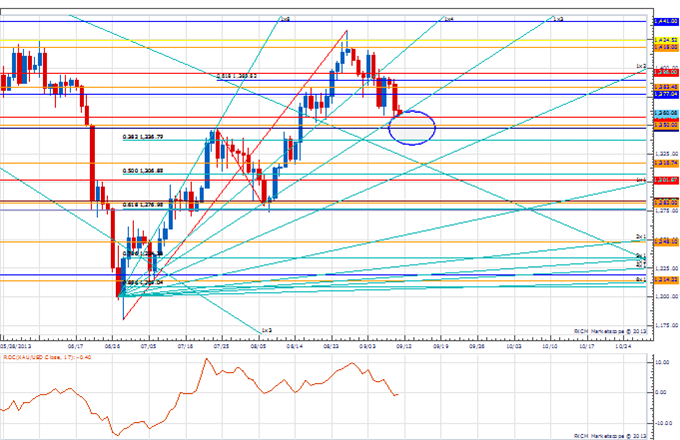
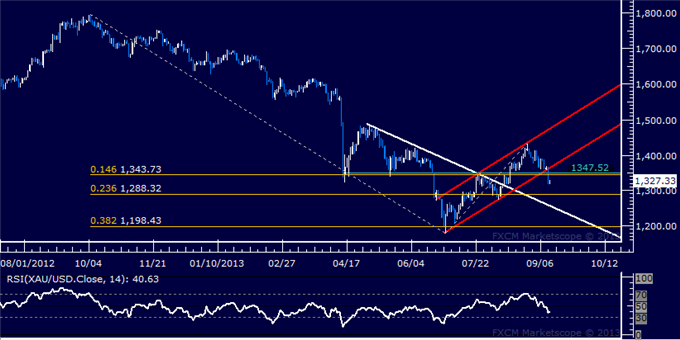
GOLD TECHNICAL ANALYSIS – The formation of a Bullish Engulfing candlestick pattern above support marked by the bottom of a rising channel set from late June hints at gains ahead. Initial resistance is at 1396.41, the 23.6% Fibonacci expansion, with a break above that exposing the 38.2% level at 1419.89. Channel support is now at 1363.03.
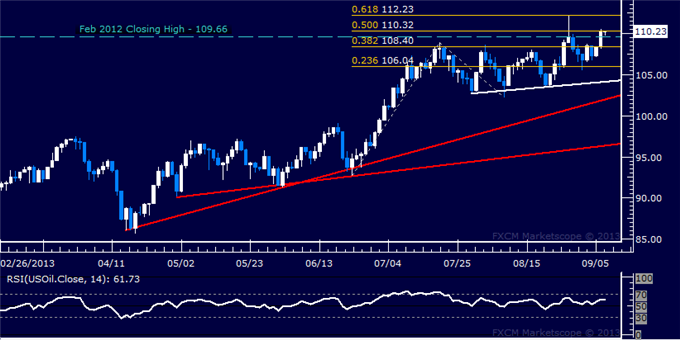
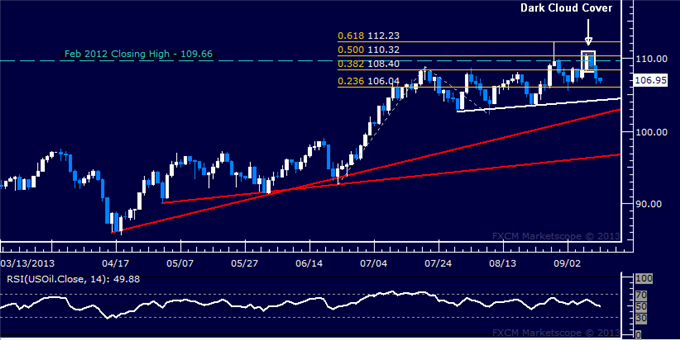
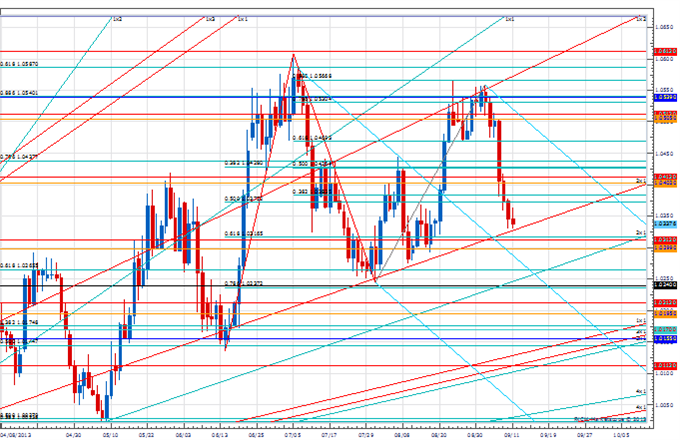
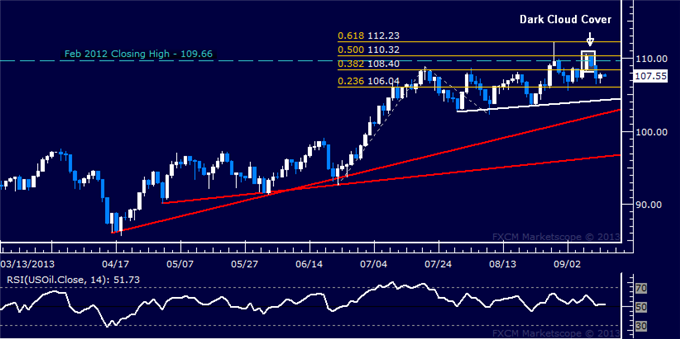
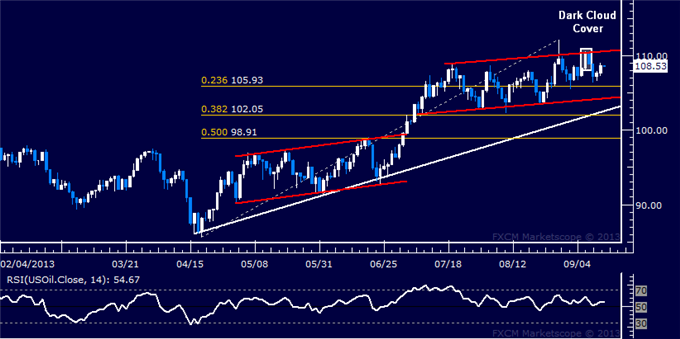
CRUDE OIL TECHNICAL ANALYSIS– Prices are testing resistance in the 109.66-110.32 area, marked by the February 2012 closing high and the 50% Fibonacci expansion. A break above that exposes the 61.8% level at 112.23. Near-term support is at 108.40, the 38.2% Fib, followed by the 23.6% expansion at 106.04.
--- Written by Ilya Spivak, Currency Strategist for Dailyfx.com
More...


 Reply With Quote
 See the


Bookmarks