
 7Likes
 LinkBack URL
 About LinkBacks


EUR/USD is challenging a key support level at month-end while Gold pauses after reaching its highest level since mid-May. USD/JPY remains in consolidation mode.
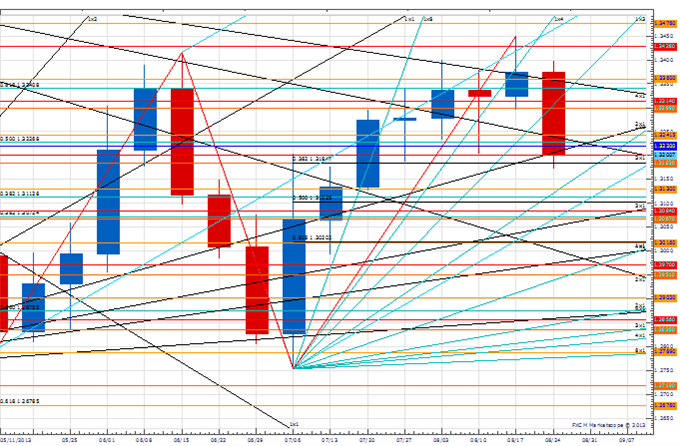
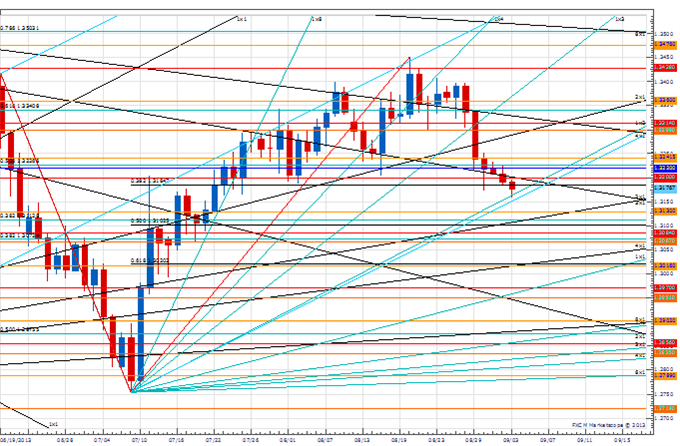
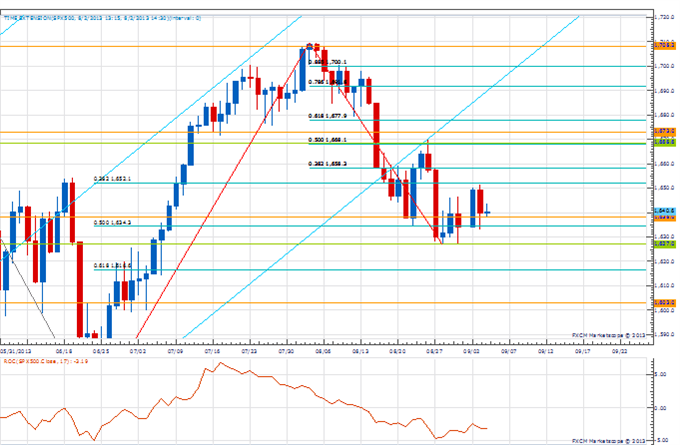
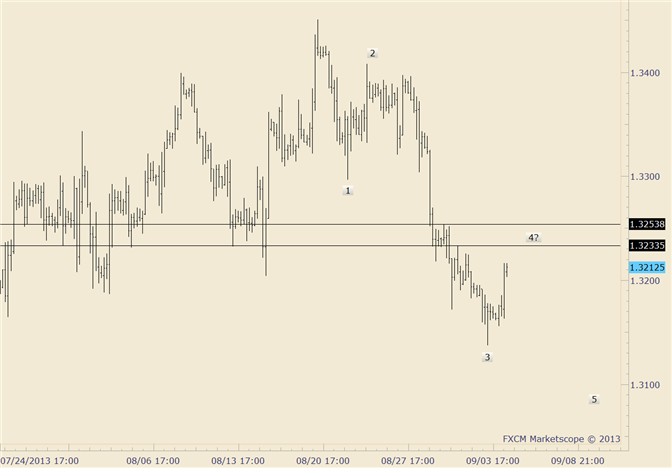
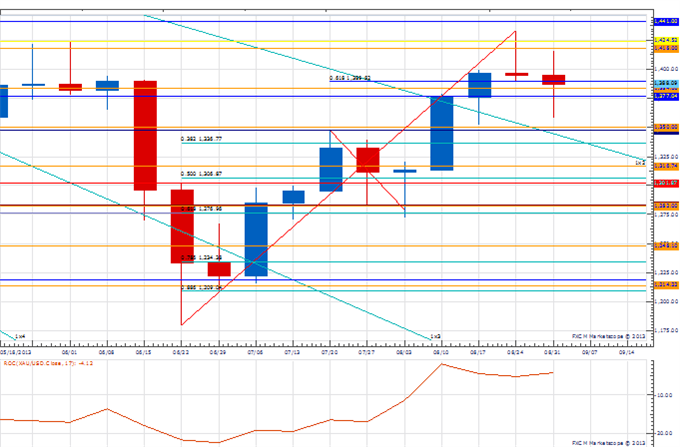
Weekly Price & Time Analysis: EUR/USD
- EUR/USD failed last week to close above the 1.3415 2Q13 high on a weekly basis
- While below this level our broader trend bias will remain lower
- The 2nd square root progression of the year-to-date high at 1.3220 is key support and a weekly close below this level is needed to signal a downside trend resumption
- A long-term cycle turn window is in effect for a few days
- A weekly close over 1.3415 will confirm a trend reversal and open the way for a much more important move higher in the weeks ahead
Tactical EUR/USD Strategy: Still short against a weekly close over 1.3415.
Instrument Support 2 Support 1 Spot Resistance 1 Resistance 2 EUR/USD 1.3110 *1.3220 1.3220 1.3335 *1.3415
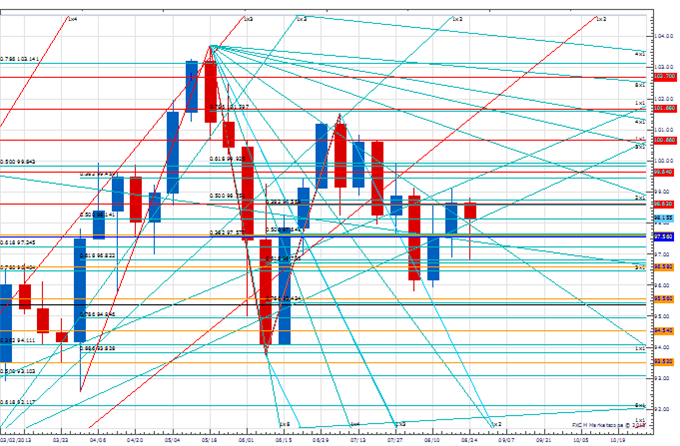
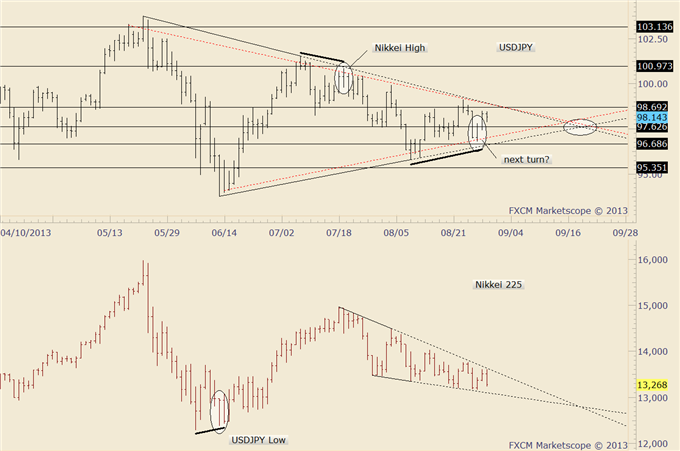
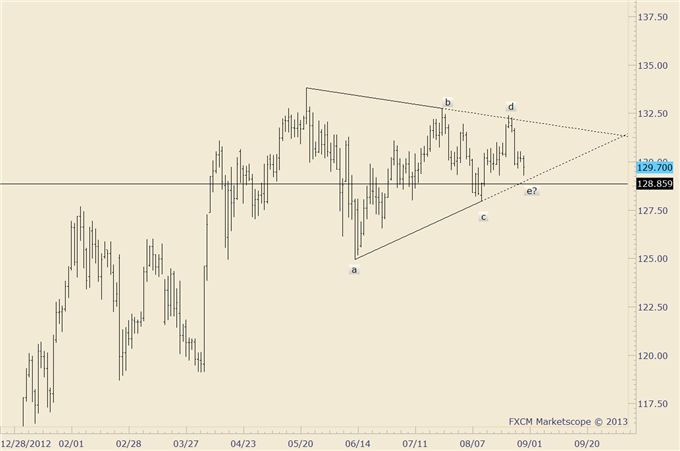
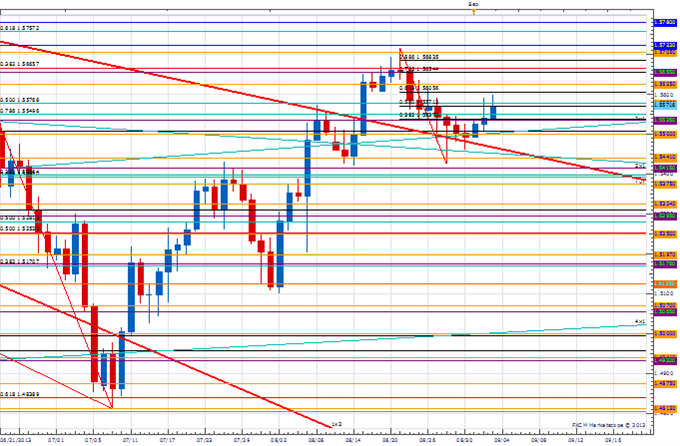
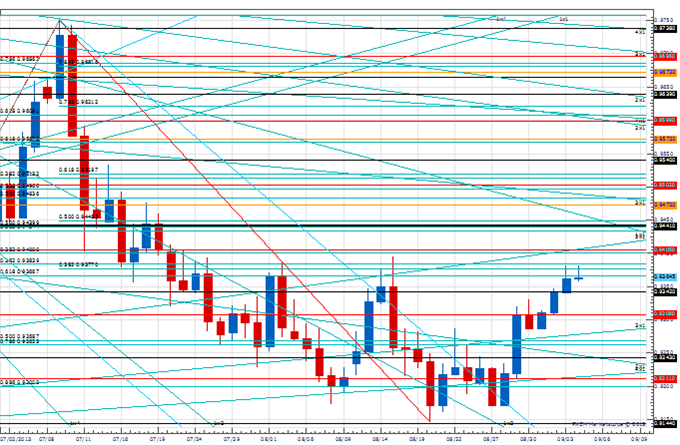
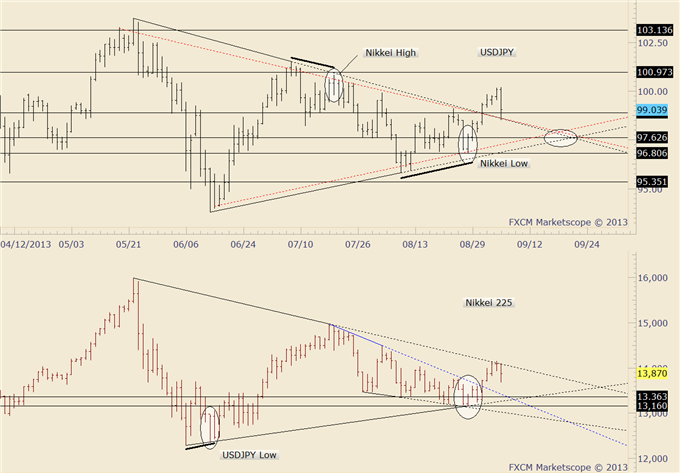
Weekly Price & Time Analysis: USD/JPY
- USD/JPY has been unable to gain any real traction over the 5th square root progression of this year’s high in the 98.60 area
- While over the 2Q13 low near .9375 our longer-term trend bias will remain higher in the rate
- A close over 98.60 and then 99.65 on a weekly basis is needed to confirm that an upside resumption of the broader trend is indeed underway
- The next few days are a turn window in the rate
- The 97.50 retracement confluence remains intermediate support, but only aggressive weakness below the 2Q13 low on a multi-day closing basis would turn the broader outlook negative
Tactical USD/JPY Strategy: Tactical longs favored against .9375.
Instrument Support 2 Support 1 Spot Resistance 1 Resistance 2 USD/JPY *93.75 97.60 98.55 *98.60 99.55
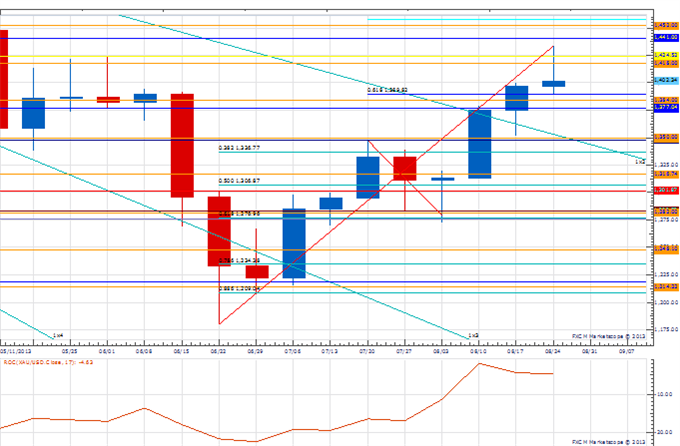
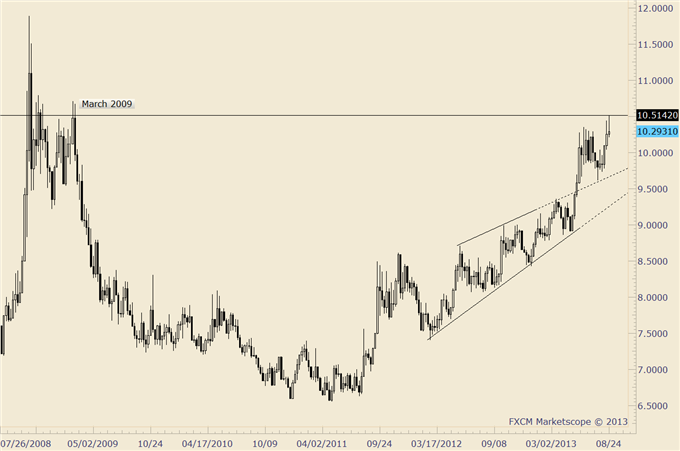
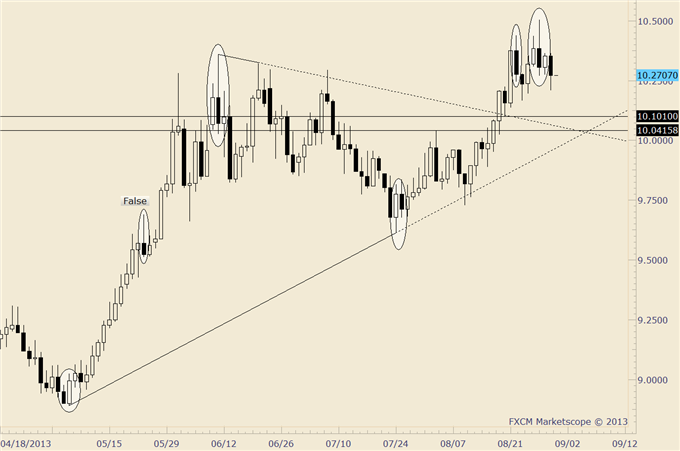
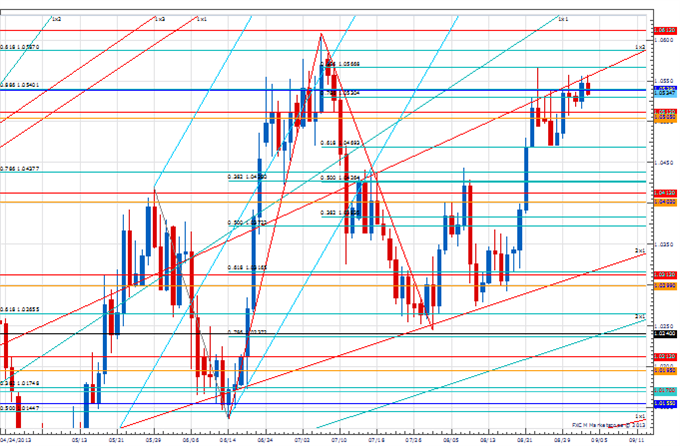
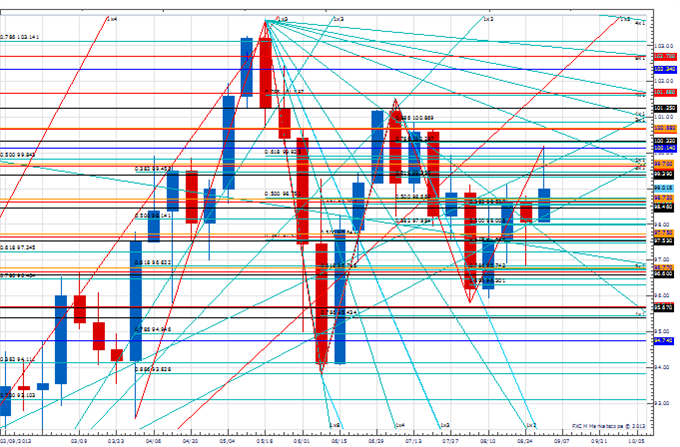
Weekly Price & Time Analysis: Gold
- XAU/USD traded to its highest level since mid-May before finding resistance on a closing basis at the 7th square root progression of the year-to-date low at 1419
- While abvoe the 3rd square root progression of the year-to-date low in the 1280 area our broader trend bias is positive on the metal
- A weekly close over 1419 and then the 100% projection of the July advance at 1441 is needed to trigger the next leg higher in the metal
- A medium-term turn window was seen around the middle of the week
- The 4th square root progression of the year’s low near 1350 is important support, but only aggressive weakness below 1280 would turn the broader technical outlook negative
Tactical Gold Strategy: We like tactical long positions in Gold while above 1280.
Instrument Support 2 Support 1 Spot Resistance 1 Resistance 2 XAU/USD *1280 1350 1401 1419 *1441
--- Written by Kristian Kerr, Senior Currency Strategist for DailyFX.com
More...


 Reply With Quote


Bookmarks