
 LinkBack URL
 About LinkBacks


EUR/USD Reverses Gains While USD/JPY Aims Higher
EUR/USD is correcting lower and trading below 1.0800. USD/JPY is rising and might aim more upsides if it stays above the 130.20 support.
Important Takeaways for EUR/USD and USD/JPY
- The Euro started a downside correction from the 1.1035 resistance zone.
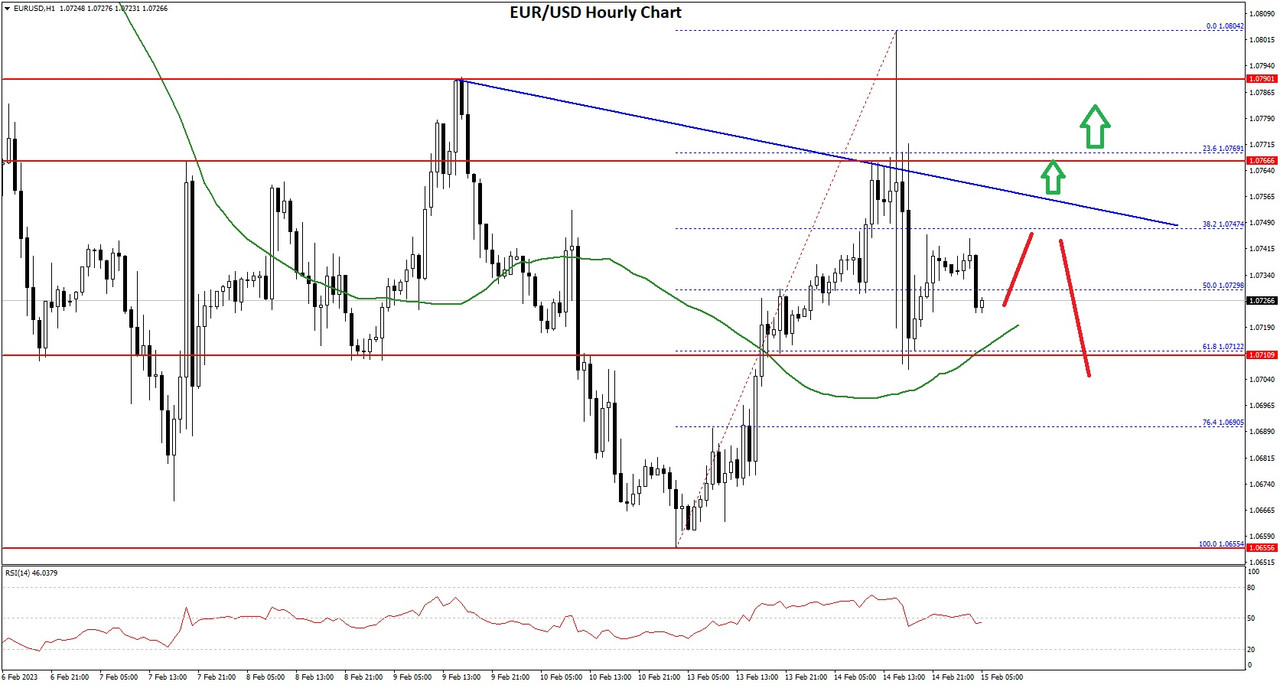
- There is a key bearish trend line forming with resistance near 1.0750 on the hourly chart of EUR/USD.
- USD/JPY is attempting a fresh increase above the 131.00 support zone.
- There was a break above a major contracting triangle with resistance near 130.00 on the hourly chart.
EUR/USD Technical Analysis
This past week, the Euro gained pace above the 1.0950 resistance against the US Dollar. The EUR/USD pair even broke the 1.1000 and 1.1020 resistance levels.
However, the pair failed to surpass the 1.1035 level. A high was formed near 1.1033 and the pair started a fresh decline. There was a clear move below the 1.0950 support zone and the 50 hourly simple moving average.
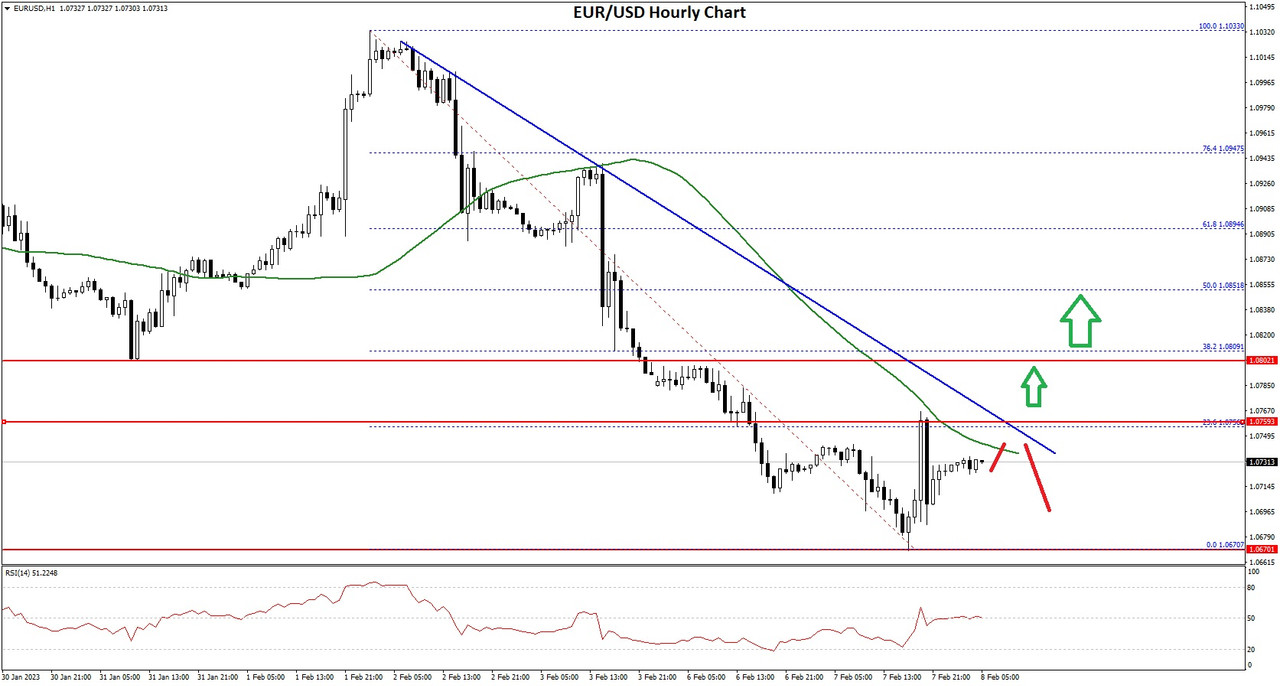
EUR/USD Hourly Chart
The pair even broke the 1.0850 support level. A low is formed near 1.0670 on FXOpen and the pair is now correcting losses. There was a move above the 1.0700 level.
On the upside, an immediate resistance is near the 1.0750 level. There is also a key bearish trend line forming with resistance near 1.0750 on the hourly chart of EUR/USD. The trend line is close to the 23.6% Fib retracement level of the downward move from the 1.1033 swing high to 1.0670 low.
The next major resistance is near the 1.0800 level. An upside break above 1.0800 could set the pace for another increase. In the stated case, the pair might visit 1.0850 or the 50% Fib retracement level of the downward move from the 1.1033 swing high to 1.0670 low.
Any more gains might send the pair towards 1.0920. If not, it could continue to move down. An initial support on the downside is near the 1.0700 level. The first major support is near the 1.0670 level.
The main support sits near the 1.0650 zone, below which the pair could start a major decline. In the stated case, the pair might dive towards the 1.0520 support zone.
VIEW FULL ANALYSIS VISIT - FXOpen Blog...
Disclaimer: This Forecast represents FXOpen Companies opinion only, it should not be construed as an offer, invitation or recommendation in respect to FXOpen Companies products and services or as Financial Advice.


 Reply With Quote


Bookmarks