Page 21 of 164 FirstFirst ... 11 19 20 21 22 23 31 71 121 ... LastLast
Results 201 to 210 of 1639

Daily Market Analysis By FXOpen

This is a discussion on Daily Market Analysis By FXOpen within the Analytics and News forums, part of the Trading Forum category; GBP/USD Faces Resistance While GBP/JPY Dives Below 152.00 GBP/USD started a fresh increase after a drop to 1.3800. Conversely, GBP/JPY ...


  1. #201
    Junior Member FXOpen Trader's Avatar
    Join Date
    Dec 2020
    Location
    Asia
    Posts
    2,040
    GBP/USD Faces Resistance While GBP/JPY Dives Below 152.00


    GBP/USD started a fresh increase after a drop to 1.3800. Conversely, GBP/JPY is declining and it broke the key 152.00 support zone.

    Important Takeaways for GBP/USD and GBP/JPY

    • The British Pound traded as low as 1.3790 before it started an upside correction against the US Dollar.
    • There was a break above a key bearish trend line with resistance near 1.3855 on the hourly chart of GBP/USD.
    • GBP/JPY topped near 153.30 and started a major decline.
    • There was a break below a major bullish trend line with support near 153.00 on the hourly chart.


    GBP/USD Technical Analysis


    This past week, there was a steady decline in the British Pound below the 1.3900 level against the US Dollar. The GBP/USD pair even broke the 1.3850 and 1.3820 support levels.

    It traded as low as 1.3790 on FXOpen before it started an upside correction. There was a decent recovery wave above the 1.3800 level. The price surpassed the 1.3850 resistance level and the 50 hourly simple moving average.

    There was also a break above a key bearish trend line with resistance near 1.3855 on the hourly chart of GBP/USD. The pair is now trading nicely above the 1.3850 level.

    It traded as high as 1.3874 and it is now consolidating gains. An immediate support is near the 1.3855 level. It is close to the 23.6% Fib retracement level of the recent increase from the 1.3790 low to 1.3874 high.

    The next major support is near the 1.3840 level and the 50 hourly simple moving average. The 50% Fib retracement level of the recent increase from the 1.3790 low to 1.3874 high is also near 1.3832. If there is a break below the 1.3830 support, the pair could test the 1.3800 support. If there are additional losses, the pair could decline towards the 1.3660 level.

    On the upside, the pair is facing a major resistance near the 1.3880 and 1.3900 levels. A clear break above the 1.3900 resistance could set the pace for a larger increase. The next key resistance is near 1.4000.

    Read Full on FXOpen Company Blog...

  2. #202
    Junior Member FXOpen Trader's Avatar
    Join Date
    Dec 2020
    Location
    Asia
    Posts
    2,040
    EUR/USD and EUR/JPY: Euro Eyes Recovery


    EUR/USD extended its decline and tested the 1.1700 support zone. EUR/JPY is currently attempting an upside correction above the 128.40 resistance.

    Important Takeaways for EUR/USD and EUR/JPY

    • The Euro extended its decline below the 1.1750 and 1.1720 support levels.
    • There was a break below a key contracting triangle with support near 1.1765 on the hourly chart.
    • EUR/JPY also gained bearish momentum below the 129.00 support zone.
    • There is a major bearish trend line forming with resistance near 128.40 on the hourly chart.


    EUR/USD Technical Analysis


    The Euro started a major decline after it struggled to clear the 1.1800 resistance against the US Dollar. The EUR/USD pair broke the 1.1750 support zone to move into a bearish zone.

    There was also a break below a key contracting triangle with support near 1.1765 on the hourly chart. The pair traded below the 1.1720 support and settled below the 50 hourly simple moving average.

    A low is formed near 1.1702 on FXOpen and the pair is now correcting losses. There was a break above the 1.1715 level. An immediate resistance is near the 1.1725 level. It is near the 23.6% Fib retracement level of the recent decline from the 1.1804 high to 1.1702 low.

    The main resistance is still forming near the 1.1740 and 1.1750 levels. It is near the 50% Fib retracement level of the recent decline from the 1.1804 high to 1.1702 low.

    A clear break above the 1.1750 resistance could push EUR/USD towards 1.1800. On the downside, the 1.1700 level is a major support. Any more losses might lead EUR/USD towards the 1.1650 support zone. The next major support sits near the 1.1620 level.

    Read Full on FXOpen Company Blog...

  3. #203
    Junior Member FXOpen Trader's Avatar
    Join Date
    Dec 2020
    Location
    Asia
    Posts
    2,040
    Gold Price Eyes More Gains, Crude Oil Price Faces Hurdles


    Gold price started a fresh increase after it tested the $1,680 support. Crude oil price declined and tested the $62.50 support zone.

    Important Takeaways for Gold and Oil

    • Gold price started a major increase after a sharp decline to $1,680 against the US Dollar.
    • A key bullish flag is forming with resistance near $1,790 on the hourly chart of gold.
    • Crude oil price started a fresh decline from well above the $70.00 zone.
    • There is a major bearish trend line forming with resistance near $66.00 on the hourly chart of XTI/USD.


    Gold Price Technical Analysis


    Recently, gold price saw a sharp decline below the $1,750 support against the US Dollar. The price even broke the $1,720 and $1,700 support levels.

    However, the bulls were active near the $1,680 zone. A support base was formed above $1,680 and the price started a strong increase. There was a clear break above the $1,720 resistance zone.

    The bulls were able to push the price above the $1,750 level and the 50 hourly simple moving average. A high was formed near $1,795 on FXOpen and the price is now consolidating gains. It traded below the $1,780 level.

    However, the bulls are protecting the 23.6% Fib retracement level of the upward move from the $1,717 swing low to $1,795 high. There is also a key bullish flag forming with resistance near $1,790 on the hourly chart of gold.

    If there is an upside break above the channel resistance, the price could even surpass the $1,800 resistance. The next major resistance could be near the $1,825 level.

    Conversely, the price might correct lower further below $1,778. An initial support on the downside is near the $1,765 level. The first major support is near the $1,758 level. It is near the 50% Fib retracement level of the upward move from the $1,717 swing low to $1,795 high.

    Read Full on FXOpen Company Blog...

  4. #204
    Junior Member FXOpen Trader's Avatar
    Join Date
    Dec 2020
    Location
    Asia
    Posts
    2,040
    AUD/USD Technical Analysis 23rd August 2021


    The Aussie Dollar extended its decline and it tested the 0.7100 zone against the US Dollar. The AUD/USD pair traded as low as 0.7106 and it is now attempting an upside correction.

    It recovered above the 0.7130 level, but it is facing many hurdles near the 50 hourly simple moving average. There is also a key bearish trend line forming with resistance near 0.7165 on the hourly chart.


    A clear break above the trend line resistance could lead the pair towards the 0.7200 resistance. The next major resistance for the bulls could be 0.7220.

    If the pair fails to clear the trend line resistance, it could start a fresh decline below 0.7130. The next major support is near the 0.7100 level, below which there is a risk of a larger decline in the near term.

    FXOpen Blog

  5. #205
    Junior Member FXOpen Trader's Avatar
    Join Date
    Dec 2020
    Location
    Asia
    Posts
    2,040
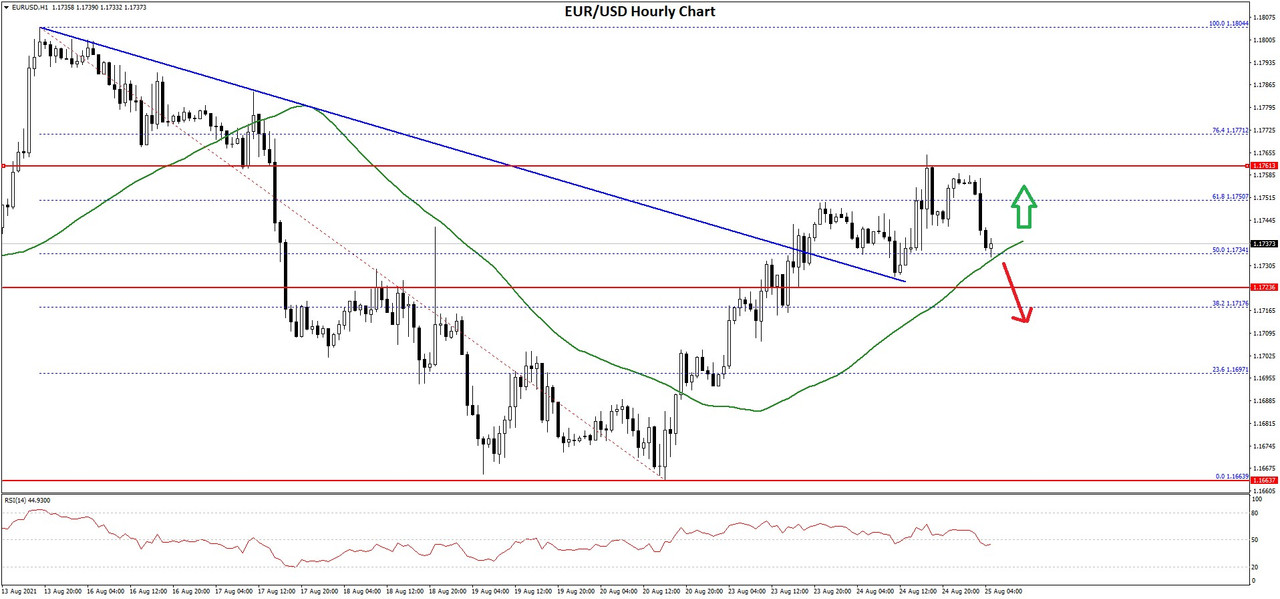
    EUR/USD Aims Higher While USD/JPY Faces Hurdles


    EUR/USD found support near 1.1665 and started an upside correction. USD/JPY is facing a major resistance near 109.85, followed by 110.00.

    Important Takeaways for EUR/USD and USD/JPY

    • The Euro started an upside correction above 1.1700 and 1.1720.
    • There was a break above a key bearish trend line with resistance near 1.1735 on the hourly chart of EUR/USD.
    • USD/JPY started a fresh increase, but it is struggling to clear the 110.00 resistance.
    • There is a major bullish trend line forming with support near 109.60 on the hourly chart.


    EUR/USD Technical Analysis


    This past week, the Euro saw a major decline below 1.1800 against the US Dollar. The EUR/USD pair broke the 1.1750 support zone to move into a bearish zone.

    The pair settled below the 1.1750 level and the 50 hourly simple moving average. It even broke the 1.1700 support level and traded as low as 1.1663 on FXOpen. It is now correcting higher above the 1.1700 resistance level.

    There was a break above the 50% Fib retracement level of the key decline from the 1.1804 swing high to 1.1663 low. There was also a break above a key bearish trend line with resistance near 1.1735 on the hourly chart of EUR/USD.

    The pair is now consolidating above 1.1730 and the 50 hourly simple moving average. An immediate resistance is near the 1.1760 level. The first key resistance is near the 1.1770 level. It is near the 76.4% Fib retracement level of the key decline from the 1.1804 swing high to 1.1663 low.

    The main resistance is near the 1.1800 level. A close above 1.1800 could open the doors for a steady increase towards 1.1850. If there is no break above 1.1760, the pair might continue to move down below 1.1720.

    An intermediate support is near the 1.1700 level. The next major support is near the 1.1665 level, below which the pair could drop towards the 1.1600 support in the near term.

    Read Full on FXOpen Company Blog...

  6. #206
    Junior Member FXOpen Trader's Avatar
    Join Date
    Dec 2020
    Location
    Asia
    Posts
    2,040
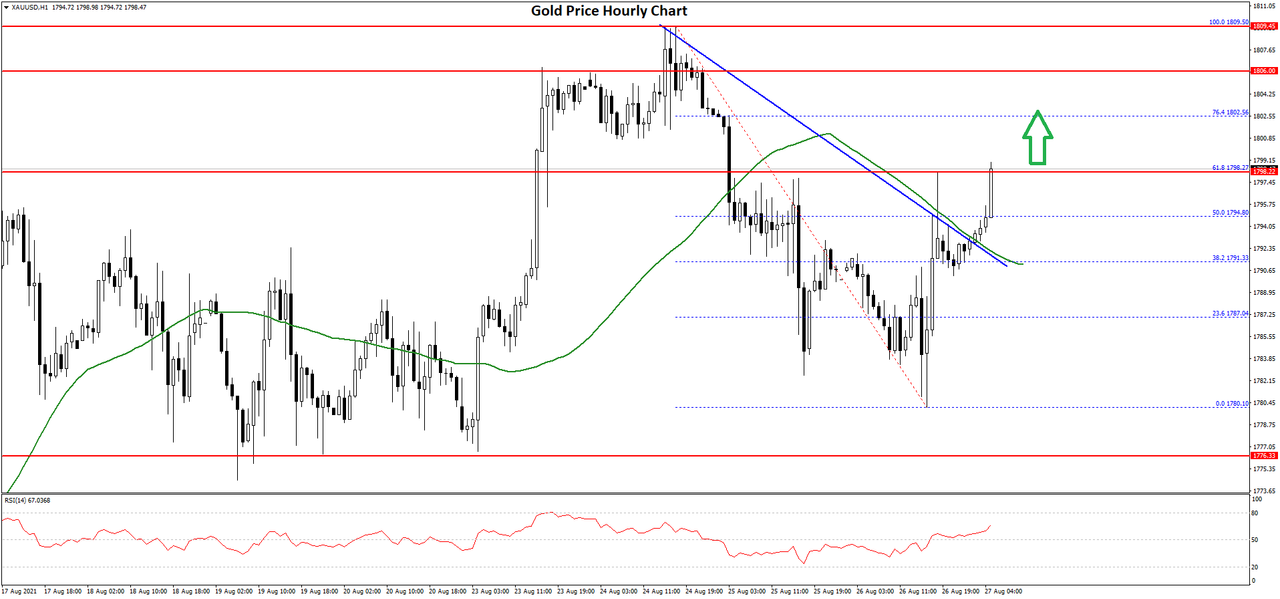
    Gold Price and Crude Oil Price Extend Gains


    Gold price started a fresh increase after it tested the $1,780 support. Crude oil price is rising and it is trading above the $65.00 support zone.

    Important Takeaways for Gold and Oil

    • Gold price started a decent increase from the $1,780 support zone against the US Dollar.
    • There was a break above a key bearish trend line with resistance near $1,792 on the hourly chart of gold.
    • Crude oil price started a fresh increase from the $61.50 support zone.
    • There is a major contracting triangle forming with resistance near $68.00 on the hourly chart of XTI/USD.


    Gold Price Technical Analysis


    Gold price formed a strong support base above the $1,780 zone against the US Dollar. As a result, the price started a fresh increase above the $1,785 and $1,790 resistance levels.

    There was a break above a key bearish trend line with resistance near $1,792 on the hourly chart of gold. The price surpassed the 50% Fib retracement level of the downward move from the $1,809 swing high to $1,780 swing low (formed on FXOpen).

    The price is now trading above $1,790 and the 50 hourly simple moving average. An immediate resistance is near the $1,798 and $1,800 levels.

    The 50% Fib retracement level of the downward move from the $1,809 swing high to $1,780 swing low is also near the $1,798 level. A close above the $1,798 and $1,800 levels could open the doors for a steady increase towards $1,820.

    Conversely, the price might correct lower below $1,795. An initial support on the downside is near the $1,790 level and the 50 hourly simple moving average. The first major support is near the $1,780 level.

    A downside break below the $1,780 support zone may possibly spark a sharp decline. In the stated case, the price could test the $1,750 support.

    Read Full on FXOpen Company Blog...

  7. #207
    Junior Member FXOpen Trader's Avatar
    Join Date
    Dec 2020
    Location
    Asia
    Posts
    2,040
    NO SIGNIFICANT RESISTANCE ON BITCOIN’S PATH TO $100,000


    Bitcoin will continue the rally that started in August, and after successfully breaking through the psychological resistance level of $50,000, it could further grow to reach $100,000 with minimal resistance, says Bloomberg's analyst and strategist Mike McGlone.

    “After enduring a gut-wrenching correction, we see the crypto market more likely to resume its upward trajectory than drop below the 2Q lows. What could stop Bitcoin and Ethereum from achieving record highs in 2H may be the more elusive question. Increasing demand and adoption are facing diminishing supply,” McGlone wrote in his report.

    Meanwhile, JPMorgan analysts have warned the investors about the “frothy-looking” crypto markets and unstable prices over the long term. They have also noted that the factors boosting the BTC price include continued interest from institutional investors and the general public.

    The chart seems to confirm this optimism. An inside bar with low volumes was formed on Saturday, and on Sunday, the price rose paired with increasing volumes. Taking into account the decline in activity typical for a weekend, we see an indication that the market is more interested in rallying than balancing around the 50k level.

    FXOpen Telegram Channel

  8. #208
    Junior Member FXOpen Trader's Avatar
    Join Date
    Dec 2020
    Location
    Asia
    Posts
    2,040
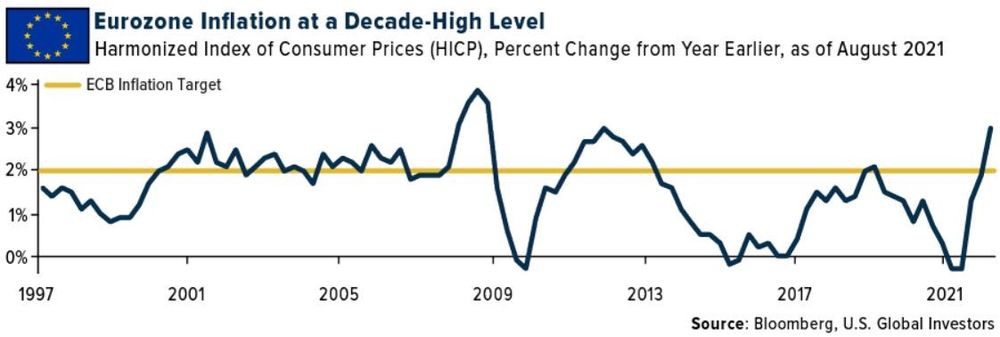
    Eurozone Inflation at 10-Year High Ahead of the September ECB Meeting


    Inflation is running hot all over the world, and the Eurozone could not differ. Ahead of the ECB meeting scheduled this Thursday, the inflation rate in the Euro area reached a 10-year high.

    Unlike the Federal Reserve of the United States, the ECB has only one mandate – price stability. The ECB measures price stability by bringing inflation below but close to 2%. It recently adjusted its target to a more symmetrical one, something similar to the average inflation targeting in the United States.


    But the bottom line is that the ECB only looks at inflation before changing its monetary policy. The Fed, on the other hand, looks at inflation and job creation. Therefore, while inflation is way above the target in the United States, the Fed will not act on rates until the job market recovers. As we saw last Friday, the last NFP report disappointed – the U.S. economy only created one-third the jobs the market expected.
    The Euro Trades with a Bid Tone Ahead of the ECB Meeting

    The common currency, the euro, bounced recently from its lows. The EUR/USD exchange rate is up from below 1.17 and traded briefly above 1.19 after last Friday’s NFP report in the United States.

    Similar to the EUR/USD, the EUR/JPY is in a bullish trend too. It regained the 130 level and trades with a bid tone.

    The market expects that the ECB will signal the removal of its monetary accommodation, and thus the euro is bid against its peers. However, the risk is that the ECB will do nothing and the recent strength in the euro pairs will vanish.

    All in all, an interesting week for financial markets lie ahead. Inflation is a problem in Europe, and the ECB will likely reiterate its view that inflation is transitory. If that is the case, and the ECB does nothing to address inflation fears, the euro bulls will be disappointed.

    FXOpen Blog

  9. #209
    Junior Member FXOpen Trader's Avatar
    Join Date
    Dec 2020
    Location
    Asia
    Posts
    2,040
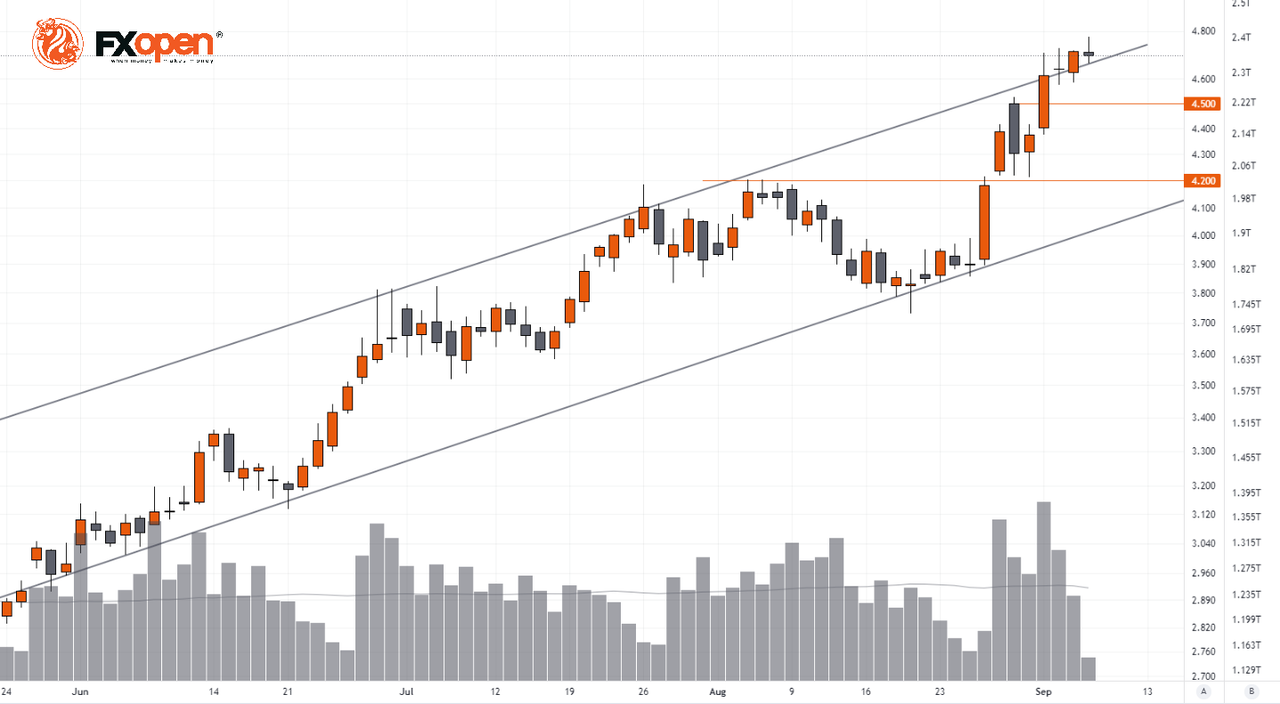
    NATURAL GAS SETTING NEW RECORDS IN THE US AND EUROPE


    On Monday, September 6, US natural gas futures reached the mark of $4.7 per million Btu. This is the highest index since December 2018.

    Such a hike in gas prices was triggered by Hurricane Ida: production in the Gulf of Mexico is not going according to plan. The demand for home air conditioning is likely to remain as strong, since it will be as hot in early September.

    In Europe, the gas price has climbed even higher due to shortage fears. The threat of shortage stems from the fact that Russia, the largest gas supplier to Europe, has refused to book large volumes of gas pumped through pipelines in Ukraine ahead of the completion of the Nord Stream 2 pipeline.

    From a technical point of view, the chart shows that gas prices have reached the overbought level and the line of the long-term upward channel. This increases the likelihood of a rollback.

    Whether you would like to take a risky position against an uptrend, or wait for a pullback (for example, closer to the strong support of 4.200 or 4.500) to enter a long position at the end of it, FXOpen is ready to be your reliable partner.

    FXOpen Telegram Channel

  10. #210
    Junior Member FXOpen Trader's Avatar
    Join Date
    Dec 2020
    Location
    Asia
    Posts
    2,040
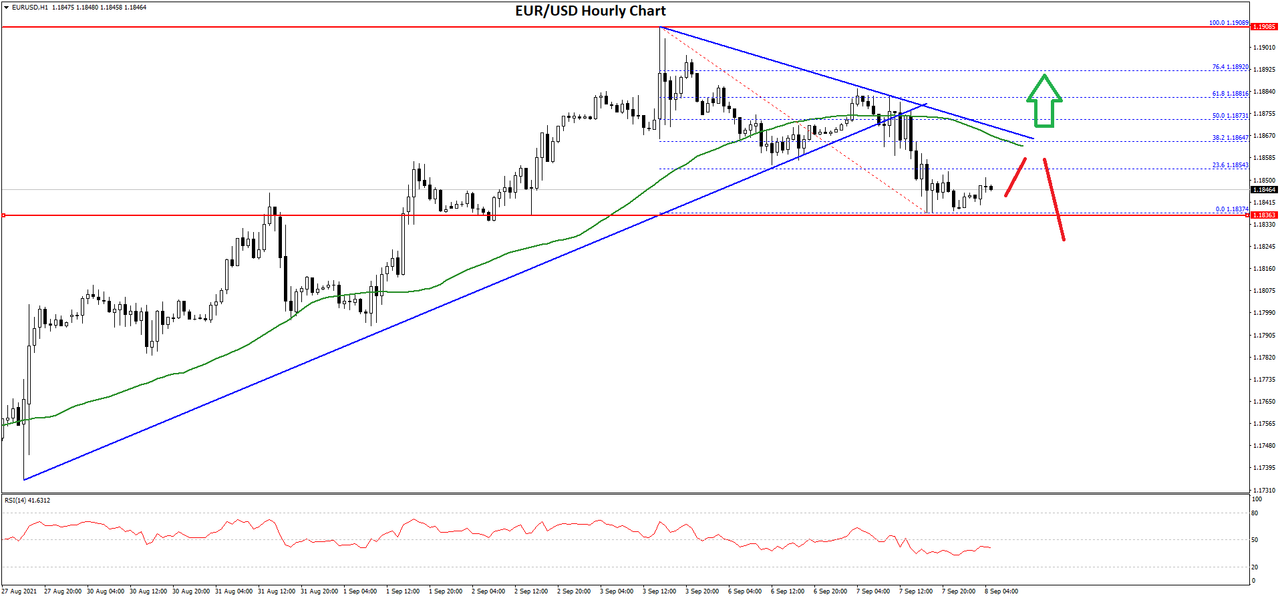
    EUR/USD Could Resume Decline While USD/JPY Aims Higher


    EUR/USD extended its increase before it faced sellers near 1.1910. USD/JPY is rising and it might revisit the 110.40 resistance zone.

    Important Takeaways for EUR/USD and USD/JPY

    • The Euro failed to gain pace above 1.1900 and started a downside correction.
    • There was a break below a major bullish trend line with support near 1.1875 on the hourly chart of EUR/USD.
    • USD/JPY started a fresh increase and it cleared the 110.00 resistance zone.
    • There was a break above a key bearish trend line with resistance near 109.95 on the hourly chart.


    EUR/USD Technical Analysis


    This past week, the Euro saw a steady increase above the 1.1800 zone against the US Dollar. The EUR/USD pair broke the 1.1850 resistance to move into a positive zone.

    The pair even spiked above the 1.1900 level, but it failed to extend gains. A high was formed near 1.1908 on FXOpen before the pair started a fresh decline.

    There was also a break below a major bullish trend line with support near 1.1875 on the hourly chart of EUR/USD. The pair traded as low as 1.1837 and it is now consolidating losses.

    An immediate resistance is near the 1.1855 level. It is near the 23.6% Fib retracement level of the recent decline from the 1.1908 swing high to 1.1837 low. The first key resistance is near the 1.1865 level and the 50 hourly simple moving average.

    The 50% Fib retracement level of the recent decline from the 1.1908 swing high to 1.1837 low is also near 1.1865. A close above 1.1865 could open the doors for a steady increase towards 1.1900.

    If there is no break above 1.1865, the pair might continue to move down. An immediate support is near the 1.1840. The next major support is near 1.1820, below which the pair could drop towards the 1.1750 support in the near term.

    Read Full on FXOpen Company Blog...

Page 21 of 164 FirstFirst ... 11 19 20 21 22 23 31 71 121 ... LastLast

Bookmarks

Posting Permissions

  • You may not post new threads
  • You may not post replies
  • You may not post attachments
  • You may not edit your posts
  •