Gold Price and Crude Oil Price Eye Additional Gains
Gold price started a fresh increase above the $1,820 resistance. Crude oil price is also rising and it is showing positive signs above $70.00.
Important Takeaways for Gold and Oil
- Gold price started a fresh upward move after forming a base above $1,780 against the US Dollar.
- There was a break above a key bearish trend line with resistance near $1,805 on the hourly chart of gold.
- Crude oil price also gained pace and it broke the key $70.00 resistance zone.
- There is a major bullish trend line forming with support near $72.30 on the hourly chart of XTI/USD.
Gold Price Technical Analysis
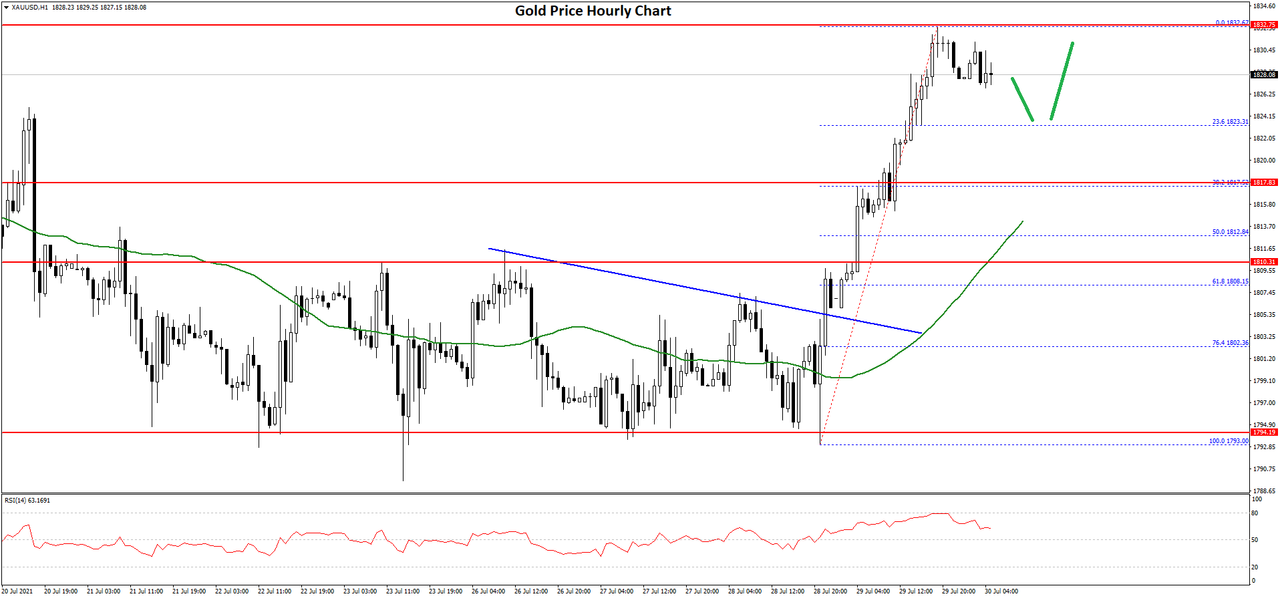
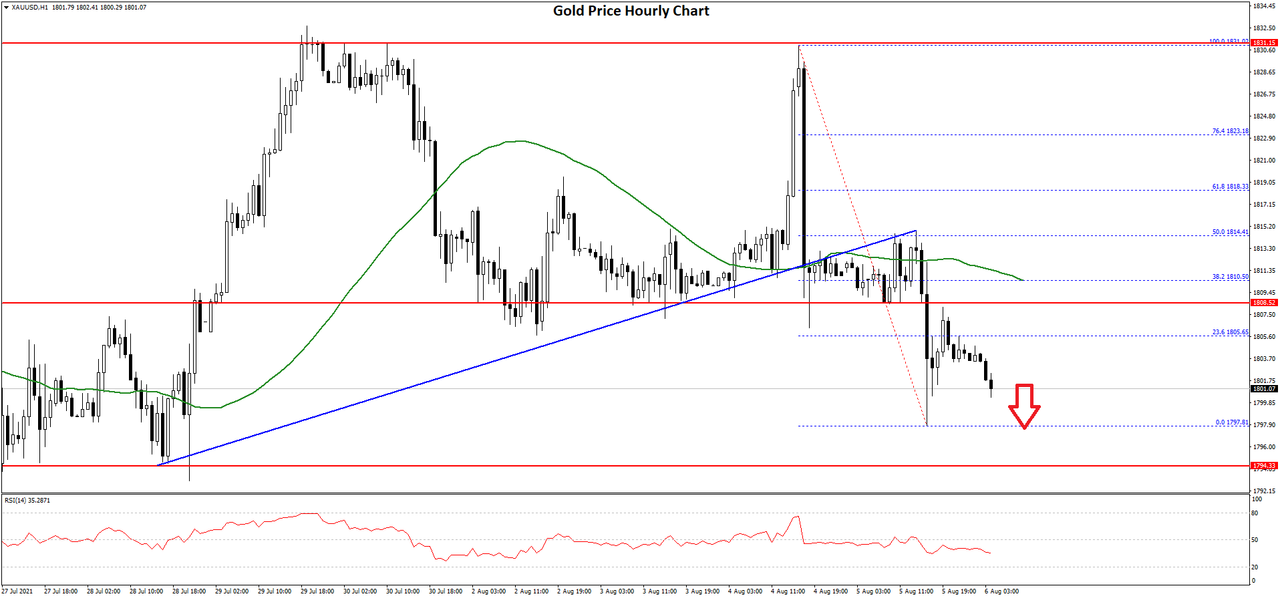
This week, gold price formed a decent support base above the $1,792 zone against the US Dollar. The price started a fresh upward move and it surpassed the $1,800 resistance zone.
The price even settled above the $1,820 level and the 50 hourly simple moving average. Besides, there was a break above a key bearish trend line with resistance near $1,805 on the hourly chart of gold.
Finally, the price spiked above the $1,830 resistance and it traded as high as $1,832 on FXOpen. The price is now consolidating gains near $1,828. An initial support on the downside is near the $1,823 level. It is near the 23.6% Fib retracement level of the upward move from the $1,793 low to $1,832 high.
The first major support is near the $1,818 level. The main support is now forming near the $1,810 level and the 50 hourly SMA. The 50% Fib retracement level of the upward move from the $1,793 low to $1,832 high is also near $1,812.
If there is a downside break, the price could test the $1,790 support. An immediate resistance on the upside is near the $1,832 level. The first major resistance is near the $1,840 level. If the price breaks the $1,840 level, it could accelerate higher. In the stated case, the price could rise towards the $1,850 zone.
Read Full on FXOpen Company Blog...


 LinkBack URL
 About LinkBacks




 Reply With Quote







Bookmarks