
 LinkBack URL
 About LinkBacks


BTCUSD and XRPUSD Technical Analysis 31st JAN 2023
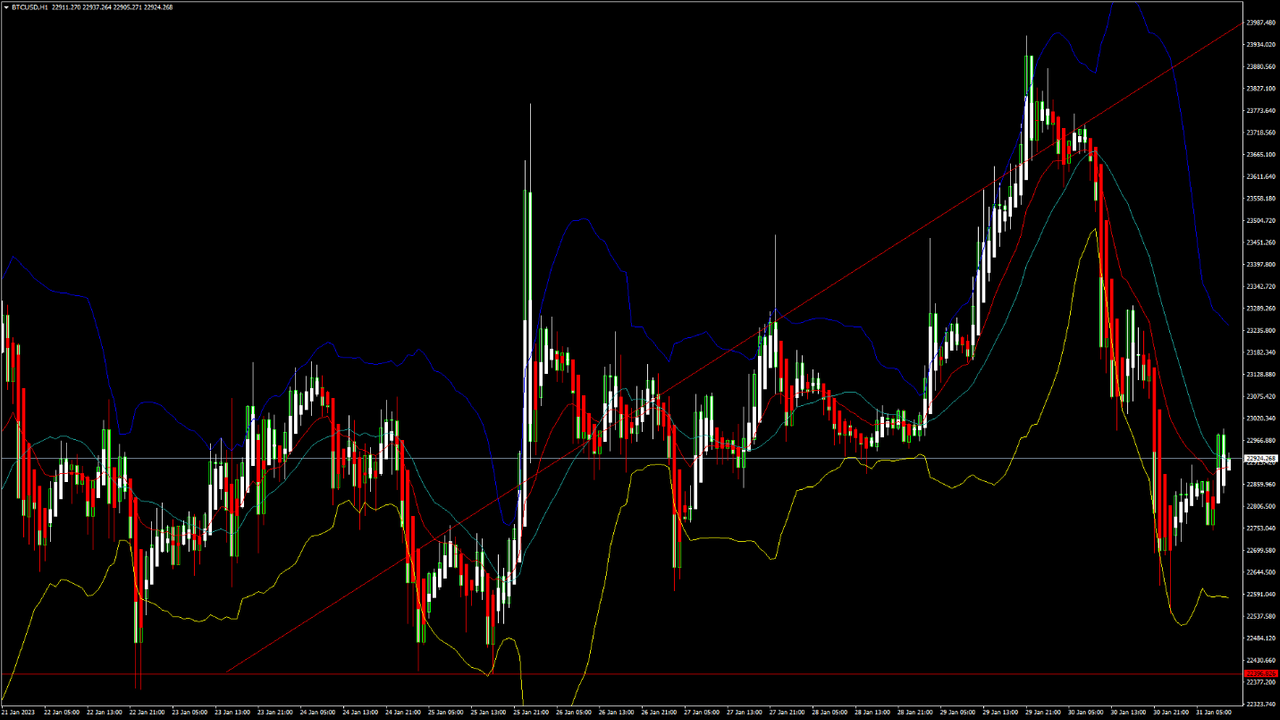
BTCUSD: Double Bottom Pattern Above $22396
Bitcoin continues its bullish momentum from last week and after touching a low of $22396 on 25th Jan, the prices started to correct upwards against the US dollar and are now ranging above the $22500 handle in the European trading session today.
We have seen a bullish opening of the markets this week.
We can clearly see a double bottom pattern above the $22396 handle which is a bullish reversal pattern because it signifies the end of a downtrend and a shift towards an uptrend.
Bitcoin touched an intraday low of 22543 in the Asian trading session and an intraday high of 22992 in the European trading session today.
The price of bitcoin is ranging near a new record high of 1 month.
We can see the formation of a bullish harami and bullish harami cross pattern in the daily time frame.
Both the STOCH and Williams percent range are indicating overbought levels which means that in the immediate short term, a decline in the prices is expected.
We have also detected a bullish doji star pattern in the 30-minute time frame indicating bullish trends.
The relative strength index is at 56.23 indicating a strong demand for bitcoin, and the continuation of the buying pressure in the markets.
Bitcoin is now moving below its 100 hourly simple moving average and above its 100 hourly exponential moving averages.
Most of the major technical indicators are giving a buy signal, which means that in the immediate short term, we are expecting targets of 23000 and 24500.
The average true range is indicating high market volatility with a mildly bullish momentum.
- Bitcoin: bullish continuation seen above $22396
- The commodity channel index is indicating a neutral level
- The price is now trading just below its pivot level of $22884
- The short-term range is mildly bullish
Bitcoin: Bullish Continuation Seen Above $22396
The price of bitcoin witnessed a downwards correction after touching $23926 as the target of $24K was rejected by the bulls. Now the markets are ranging into a consolidation channel above the $22500 handle.
After the consolidation phase is over, we are expecting upside moves in the range of $23500 to $24000 levels.
The resistance of the channel is broken in the 15-minute time frame.
We can see the formation of a bullish trend reversal pattern with the moving average MA20 in the 15-minute time frame.
The immediate short-term outlook for bitcoin is mildly bullish, the medium-term outlook has turned bullish, and the long-term outlook remains neutral under present market conditions.
Bitcoins support zone is located at $20780 at which the price crosses 9-day moving average stalls, and at $21091 which is a 38.2% retracement from a 4-week high.
The price of BTCUSD is now facing its classic resistance level of 22928 and Fibonacci resistance level of 22950 after which the path towards 23000 will get cleared.
In the last 24hrs BTCUSD has decreased by 1.85% by 432.62$ and has a 24hr trading volume of USD 25.925 billion. We can see a decrease of 5.10% in the trading volume compared to yesterday, which appears to be normal.
The Week Ahead
Bitcoin has reached its highest level this month at $23956 which is a positive sign after the harsh crypto winter season seen last year.
The daily RSI is printing at 69.281 which indicates a very strong demand for bitcoin and the continuation of the bullish phase present in the markets in the short-term range.
We can see the formation of a bullish trend line from $22396 towards the $23983 level.
The price of BTCUSD is now facing its resistance zone located at $23098 which is a pivot point, and at $23527 which is a 3-10 day MACD oscillator stalls.
The weekly outlook is projected at $24000 with a consolidation zone of $23500.
Technical Indicators:
The moving averages convergence divergence (12,26): is at 1256.90 indicating a BUY
The ultimate oscillator: is at 52.29 indicating a BUY
The rate of price change : is at 8.37 indicating a BUY
Bull/bear power (13): is at 856.36 indicating a BUY
VIEW FULL ANALYSIS VISIT - FXOpen Blog...
Disclaimer: This Forecast represents FXOpen Companies opinion only, it should not be construed as an offer, invitation or recommendation in respect to FXOpen Companies products and services or as Financial Advice.


 Reply With Quote


Bookmarks