
 LinkBack URL
 About LinkBacks


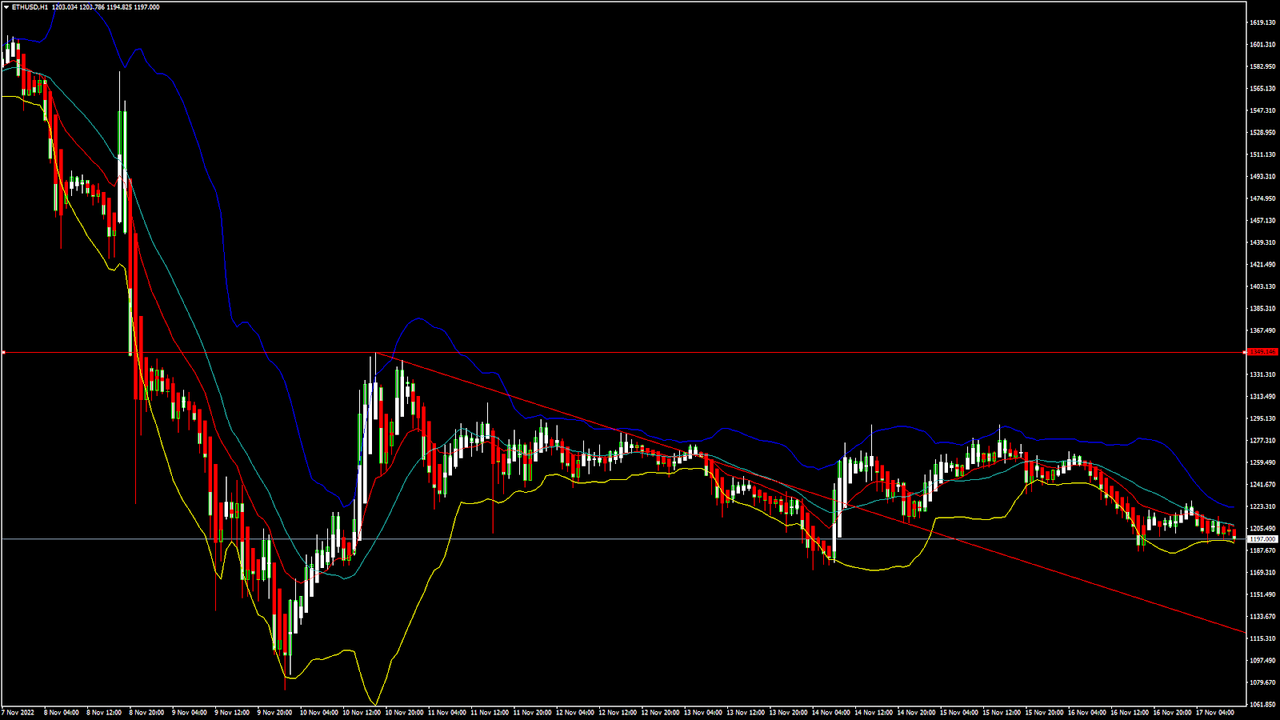
ETHUSD and LTCUSD Technical Analysis 10th NOV, 2022
ETHUSD: Hammer Pattern Above $1072
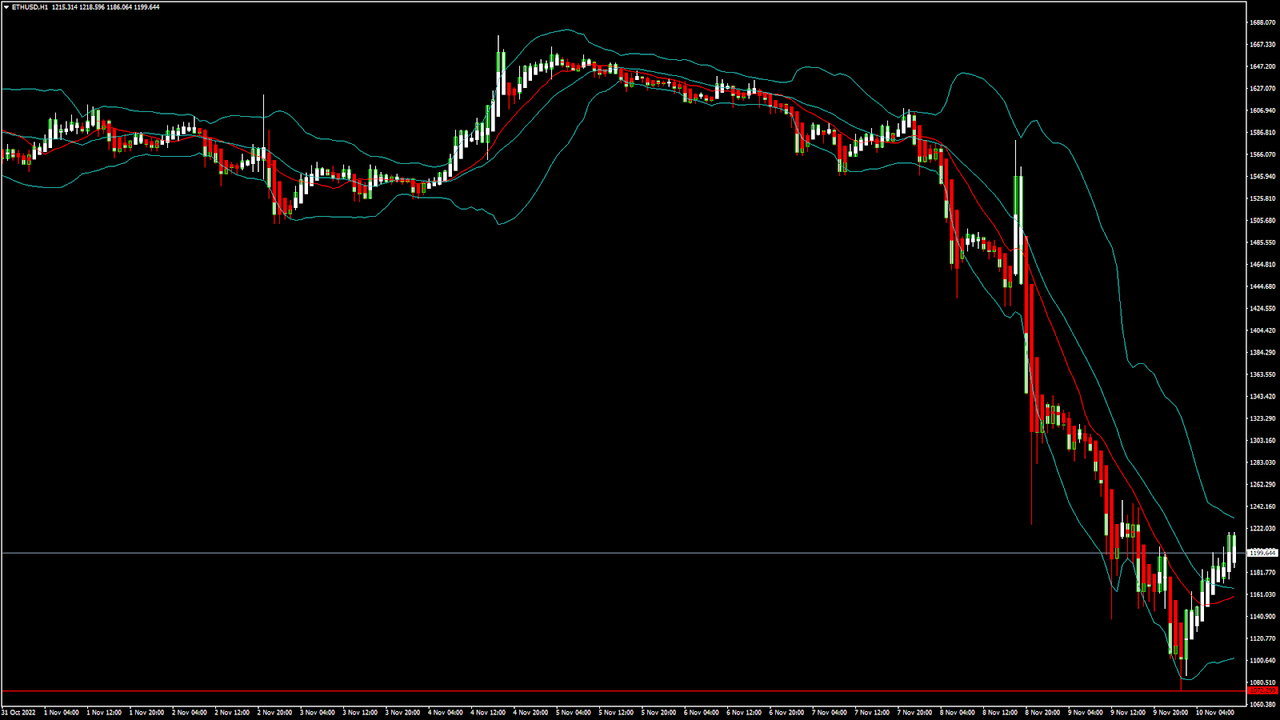
Ethereum was unable to sustain its bullish momentum, and after touching a high of 1654 on 05th Nov, the price started to decline against the US dollar touching a low of 1079 on 10th Nov, 2022.
Today we can see some upwards correction in the price of Ethereum which has touched $1200 handle in the European trading session.
We have seen a bullish opening of the markets this week.
We can clearly see a hammer pattern above the $1072 handle which is a bullish pattern and signifies the end of a bearish phase and the start of a bullish phase in the markets.
ETH is now trading just below its pivot level of 1203 and moving into a mildly bullish channel. The price of ETHUSD is now testing its classic resistance level of 1230 and Fibonacci resistance level of 1246 after which the path towards 1300 will get cleared.
The relative strength index is at 47 indicating a neutral market and a shift towards the correction and consolidation phase in the markets.
We can see that the price is back over the pivot point indicating a bullish scenario in the daily time frame.
The STOCHRSI is indicating an overbought market, which means that the prices are expected to decline in the short-term range.
Most of the technical indicators are giving a BUY market signal.
Some of the moving averages are giving a BUY signal and we are now looking at the levels of $1350 to $1400 in the short-term range.
ETH is now trading below both the 100 & 200 hourly simple and exponential moving averages.
- Ether: bullish reversal seen above the $1072 mark
- Short-term range appears to be mildly bullish
- ETH continues to remain above the $1100 level
- The average true range is indicating LESS market volatility
Ether: Bullish Reversal Seen Above $1072
ETHUSD is now moving into a mildly bullish channel with the price trading above the $1150 handle in the European trading session today.
ETH touched an intraday low of 1127 in the Asian trading session and an intraday high of 1217 in the European trading session today.
We can see a bullish trend reversal signal with moving average MA50 in the 15-minute time frame.
Some of the technical indicators still continue to give bearish signals including the rate of price change.
The price of Ethereum is marching towards a nullish zone against the US dollar and bitcoin. ETHUSD could continue to move higher back towards the $1400 level.
The daily RSI is printing at 36 indicating a very weak demand for Ether in the long-term range.
The key support levels to watch are $1077 which is a 1-month low, and 1184 which is a pivot point.
ETH has increased by 1.79% with a price change of 20.91$ in the past 24hrs and has a trading volume of 36.854 billion USD.
We can see a decrease of 13.76% in the total trading volume in the last 24 hrs which appears to be normal.
The Week Ahead
The price of ETH continues to remain in a bullish zone against the US dollar and bitcoin. ETHUSD is expected to move higher towards the $1300 and $1400 levels this week.
On the upside, we are now looking at the immediate targets of 1303 which is a 38.2% retracement from a 4-week low, and 1372 which is a 50% retracement from 4-week high/low.
The immediate short-term outlook for Ether has turned mildly bullish, the medium-term outlook has turned neutral, and the long-term outlook for Ether is neutral in present market conditions.
The price of ETHUSD will need to remain above the important support levels of $1188 which is the last support point.
The weekly outlook is projected at $1450 with a consolidation zone of $1350.
Technical Indicators:
The average directional index ADX (14): is at 37.20 indicating a BUY
The rate of price change: is at 3.057 indicating a BUY
The bull/bear power (13): is at 37.90 indicating a BUY
High/lows (14): is at 25.17 indicating a BUY
VIEW FULL ANALYSIS VISIT - FXOpen Blog...
Disclaimer: CFDs are complex instruments and come with a high risk of losing your money.


 Reply With Quote


Bookmarks