Page 10 of 164 FirstFirst ... 8 9 10 11 12 20 60 110 ... LastLast
Results 91 to 100 of 1639

Daily Market Analysis By FXOpen

This is a discussion on Daily Market Analysis By FXOpen within the Analytics and News forums, part of the Trading Forum category; BTC and XRP – Correction possibly over BTC/USD The price of Bitcoin has been moving sideways from the 17th of ...


  1. #91
    Junior Member FXOpen Trader's Avatar
    Join Date
    Dec 2020
    Location
    Asia
    Posts
    2,040
    BTC and XRP – Correction possibly over


    BTC/USD

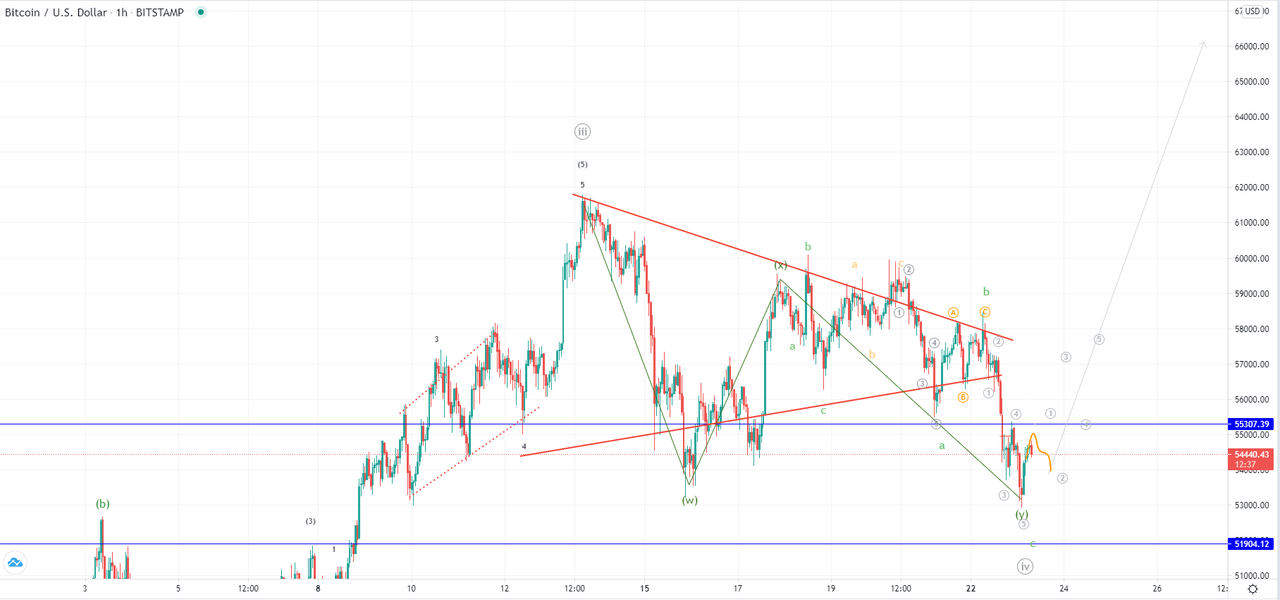
    The price of Bitcoin has been moving sideways from the 17th of March when it came up to $59,600 until the 20th when it paid another revisit to those levels. However, after a failure to break the $60,000 mark to the upside we have seen a rejection that caused a breakout from the symmetrical triangles and a low to $52,924.


    Now we are seeing a minor recovery with the price currently being traded at $54,528 and has bounced nicely forming a V shape. The descending move was a five-wave impulse which is why we could have seen the completion of the WXY correction.

    In that case, the price is now making its first attempts to establish an uptrend as the 1st wave from the next impulsive wave to the upside started. However, there could still be a possibility of another lower low to the significant $51,940 level.

    If we have seen the completion of the 4th wave correction, then the price of Bitcoin is now headed towards the new all-time high, potentially in the zone between $72,000 and $68,000.

    Read Full on FXOpen Company Blog...

  2. #92
    Junior Member FXOpen Trader's Avatar
    Join Date
    Dec 2020
    Location
    Asia
    Posts
    2,040
    EUR/USD Turns Red, USD/JPY Is Correcting Gains


    EUR/USD started a fresh decline and traded below the key 1.1880 support zone. USD/JPY is correcting gains and it is now trading below the 108.80 support.

    Important Takeaways for EUR/USD and USD/JPY

    • The Euro failed to continue higher above 1.1950 and started a fresh decline.
    • There is a key bearish trend line forming with resistance near 1.1915 on the hourly chart of EUR/USD.
    • USD/JPY started a downside correction from well above the 109.00 level.
    • There is a major bearish trend line forming with resistance near 108.65 on the hourly chart.


    EUR/USD Technical Analysis

    In the past few days, the Euro struggled to gain bullish momentum above 1.1950 against the US Dollar. The EUR/USD pair formed a swing high near 1.1946 on FXOpen and recently started a fresh decline.

    There was a break below a few important supports near the 1.1890 and 1.1880 levels. The pair even settled below the 1.1880 support zone and the 50 hourly simple moving average. A low is formed near 1.1836 and the pair is currently consolidating losses.


    An initial resistance is near the 1.1860 level. It is close to the 23.6% Fib retracement level of the recent decline from the 1.1946 swing high to 1.1836 low.

    The first major resistance is now forming near the 1.1890 and 1.1880 levels. The 50% Fib retracement level of the recent decline from the 1.1946 swing high to 1.1836 low is also near 1.1891. Moreover, there is a key bearish trend line forming with resistance near 1.1915 on the hourly chart of EUR/USD.

    Therefore, the pair must clear 1.1880 and 1.1920 to start a strong increase in the coming sessions. Conversely, the pair could continue to move down below the 1.1836 low. The first major support is near the 1.1820 level.

    If there is a downside break below the 1.1820 support, the pair could dive towards the 1.1750 support in the near term. Any more losses might call for a test of the 1.1715 support level.

    Read Full on FXOpen Company Blog...

  3. #93
    Junior Member FXOpen Trader's Avatar
    Join Date
    Dec 2020
    Location
    Asia
    Posts
    2,040
    LTC and EOS – Decrease seen but for how long?


    LTC/USD

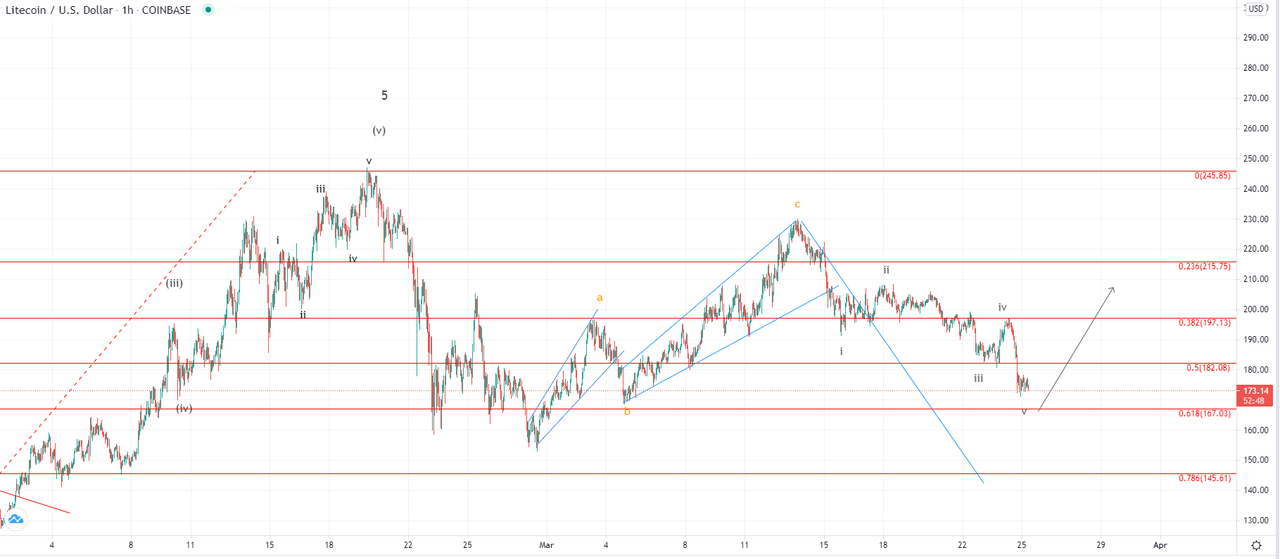
    From the start of the week, the price of Litecoin has been in a decline, coming from its Monday’s high at $197.68 to $170.92 at its lowest point today, which was a decrease of 13.53% It is now stabilizing around $173 after a steep downfall made from yesterday when the price decreased by 12.7% as the price recovered close to the levels of Monday’s high before moving to the downside again.


    Looking at the hourly chart, you can see that the bearish count has been validated in which from the start of March we have seen an ABC correction to the upside. In that case, the descending move from the 13th of March is the 3rd wave from the higher degree correction and is now forming as a five-wave move. It appears that could end very soon around the 0.618 Fibonacci level at tje $167 area, but there would be a possibility that the descending might continue to the 0.786 one.

    This is because by projecting the length of the first wave from the higher degree correction when the price of Litecoin was $245 and went to $155, we come up with a price target of $143.

    Read Full on FXOpen Company Blog...

  4. #94
    Junior Member FXOpen Trader's Avatar
    Join Date
    Dec 2020
    Location
    Asia
    Posts
    2,040
    Gold Price Stuck Below $1,750, Oil Price Facing Hurdles


    Gold price started consolidating in a range above the $1,720 support. Crude oil price is now trading below $60.00 and $60.50 resistance levels.

    Important Takeaways for Gold and Oil

    • Gold price is trading in a range above the $1,720 support against the US Dollar.
    • There are two connecting bearish trend lines forming with resistance near $1,738 on the hourly chart of gold.
    • Crude oil price is holding the key $57.50 and $57.40 support levels.
    • There is a major bearish trend line forming with resistance near $59.80 on the hourly chart of XTI/USD.


    Gold Price Technical Analysis


    Gold price made an attempt to surpass the $1,750 resistance against the US Dollar, but it failed. As a result, there was a fresh decline, but the bulls were active above the $1,720 support.

    It seems like the price is forming a strong support base above the $1,720 zone. The recent low was formed near $1,722 on FXOpen before the price started an upward move. It broke the 23.6% Fib retracement level of the recent decline from the $1,745 swing high to $1,722 low.

    An immediate resistance is near the $1,730 level and the 50 hourly simple moving average. The next key resistance is near the $1,733 level. It is close to the 50% Fib retracement level of the recent decline from the $1,745 swing high to $1,722 low.

    There are also two connecting bearish trend lines forming with resistance near $1,738 on the hourly chart of gold. To start a strong increase, the price must clear trend lines and $1,740.

    The main resistance is still near $1,750, above which the price could start a strong rally. Conversely, the price could fail to continue higher and it might decline below the $1,725 level.

    The main support is near the $1,720 zone. A clear break below the $1,720 support may possibly start a strong decline towards $1,700 or even $1,680 in the near term.

    Read Full on FXOpen Company Blog...

  5. #95
    Junior Member FXOpen Trader's Avatar
    Join Date
    Dec 2020
    Location
    Asia
    Posts
    2,040
    GBP/USD and GBP/JPY: British Pound Eyes Additional Gains


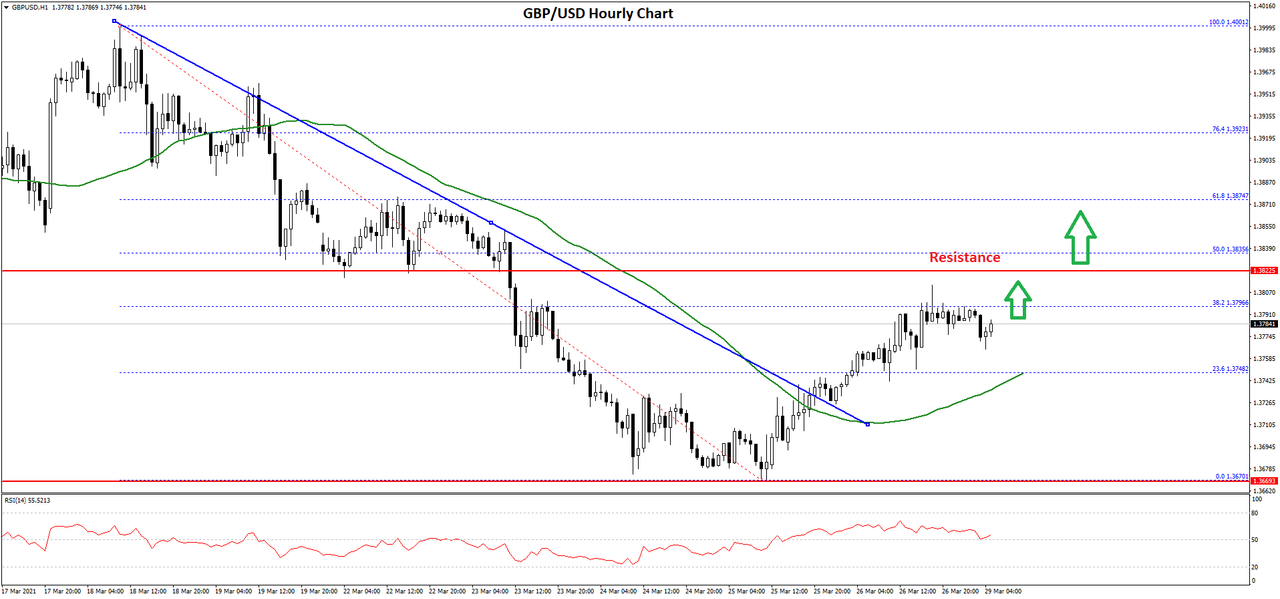
    GBP/USD found support near 1.3670 and it is now correcting higher. GBP/JPY is rising and it remains supported for more gains above 150.00

    Important Takeaways for GBP/USD and GBP/JPY

    • The British Pound declined below 1.3800, but it found support near 1.3670 against the US Dollar.
    • There was a break above a major bearish trend line with resistance near 1.3740 on the hourly chart of GBP/USD.
    • GBP/JPY is trading nicely above the 105.00 and 105.20 resistance levels.
    • There was also a break above a key bearish trend line with resistance near 149.20 on the hourly chart.


    GBP/USD Technical Analysis

    This past week, the British Pound saw a bearish wave below the 1.3850 support zone against the US Dollar. The GBP/USD pair even broke the 1.3720 support level.

    However, the pair found support near the 1.3670 zone. A low was formed near 1.3670 on FXOpen and the pair recently started a fresh increase. It broke the 1.3700 and 1.3720 resistance levels.


    There was also a break above a major bearish trend line with resistance near 1.3740 on the hourly chart of GBP/USD. The pair is now trading nicely above the 1.3750 level and the 50 hourly simple moving average.

    It is testing the 38.2% Fib retracement level of the key decline from the 1.4001 high to 1.3670 low. The first major resistance on the upside is near the 1.3825 level.

    The next major resistance is near 1.3835 level or the 50% Fib retracement level of the key decline from the 1.4001 high to 1.3670 low. A clear upside break above the 1.3825 and 1.3835 resistance levels could open the doors for a larger increase.

    If there is a fresh decline, the previous resistance near 1.3740 or the 50 hourly simple moving average might provide support. If there are additional losses, the pair could decline towards the 1.3700 level.

    Read Full on FXOpen Company Blog...

  6. #96
    Junior Member FXOpen Trader's Avatar
    Join Date
    Dec 2020
    Location
    Asia
    Posts
    2,040
    Strong Dollar Breaks the Reflation Theme – All Eyes on the U.S. Yields


    2020 proved to be a challenging year for currency traders looking to forecast how the U.S. dollar will react to the pandemic. The Federal Reserve of the United States (Fed) immediately lowered the fed funds rate to the lower boundary (i.e., close to zero) and vouched to leave it there for as long as necessary.

    On top of that, the Fed restarted the quantitative easing program, buying bonds to lower the yields on the short and long end of the curve. Furthermore, it opened USD swap lines with other central banks in the advanced world to provide liquidity and advert the strong dollar theme.

    It worked.

    The dollar initially appreciated as the world looked for safety in the face of the pandemic, but then the Fed’s plan entered into effect. Slowly at first, more aggressively after, the dollar started to lose ground across the dashboard.

    Everything appreciated in dollar terms – the euro, the Australian dollar, the British pound, equities, and commodities alike. The bearish trend on the dollar was so strong that all investment houses forecasted an even lower dollar in 2021.


    They were right.

    The so-called reflation trade, where U.S. equities advance, the dollar declines, and risk-on dominates, was the theme for most of the first quarter of the year. However, the dollar started to show some strength recently on the back of a faster economic recovery, impressive vaccination campaign, and a U.S. administration that delivers.

    What’s Next for the U.S. Dollar?

    As we head into the second quarter of the year, the dollar trades with a mixed tone. On the one hand, it gained against the euro since the year started.

    At the start of January, the EURUSD pair traded above 1.23, and last Friday closed below 1.18. Because the euro has the biggest weight in the dollar index, the move lower in the EURUSD exchange rate led to a reversal in the DXY.


    Gold made a new all-time high in 2020 – it traded above $2,000 last summer but is in retreat ever since. It is barely holding above $1,700 at the moment, and fears of higher inflation in the United States and the developed world are not enough to fuel a rally in the yellow metal.

    The problem for the reflation trade and gold comes from the fixed-income market. The U.S. yields are rising, and whenever this happened in the past, gold weakened.

    Put it simply, rising yields mean that investors flee the safety of bonds in search of higher returns in riskier assets. Effectively, it means that confidence is back and, thus, gold suffers as investors do not look for protection anymore.

    Higher yields also bode well for the dollar. Hence, before betting on a lower dollar, investors should first monitor the fixed-income market and interpret where the yields will go.

    All in all, the second quarter will be extremely interesting. If the yields continue to rise, the dollar will have a hard time weakening.

    FXOpen Blog

  7. #97
    Junior Member FXOpen Trader's Avatar
    Join Date
    Dec 2020
    Location
    Asia
    Posts
    2,040
    BTC and XRP – Looking bullish


    BTC/USD

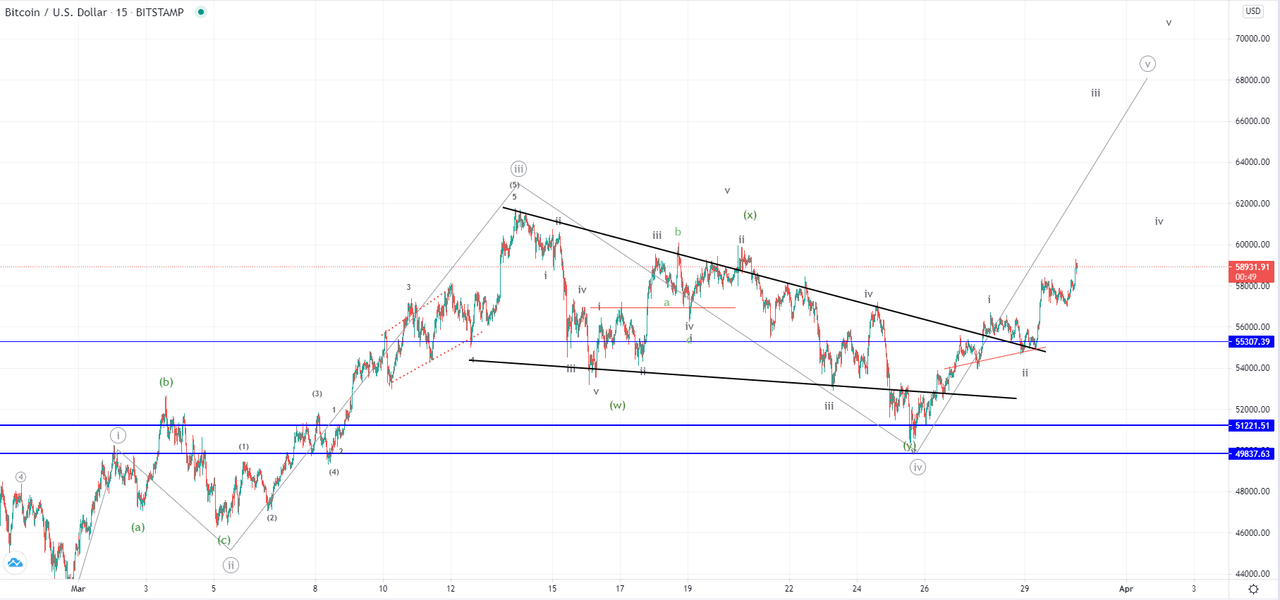
    The price of Bitcoin has been on the rise since the 25th of March when it fell to $50,420 level. From there a recovery of 17.38% was measured to its highest point so far at $59,236. Currently, it is being traded slightly lower but is still on an upward trajectory.


    The low on the 25th was the end of the corrective stage in which the price was since the 13th of March and as the third wave ended we have seen the start of the next impulsive move to the upside.

    As its first wave looks like it has already developed now we could be already seeing the start of 3rd sub-wave from the five-wave impulse. The price would be now expected to continue moving upward above its last all-time high and potential somewhere around $68,000-$72,000 zone.

    It is still soon to project the ending point so we are going to watch closely how the price action develops and reevaluate our projection accordingly. There could be a possibility that we are seeing an even higher degree impulse wave, increasing the room for growth.

    Read Full on FXOpen Company Blog...

  8. #98
    Junior Member FXOpen Trader's Avatar
    Join Date
    Dec 2020
    Location
    Asia
    Posts
    2,040
    EUR/USD Dives, USD/CHF Likely To Continue Higher


    EUR/USD started a fresh decline below the 1.1800 and 1.1780 support levels. USD/CHF is rising and it is likely to continue higher above 0.9450.

    Important Takeaways for EUR/USD and USD/CHF

    • The Euro started a fresh drop below the 1.1850 and 1.1800 support levels against the US Dollar.
    • There is a major bearish trend line forming with resistance near 1.1755 on the hourly chart of EUR/USD.
    • USD/CHF is trading in a bullish zone above the 0.9350 resistance zone.
    • There is a key ascending channel forming with support near 0.9405 on the hourly chart.


    EUR/USD Technical Analysis


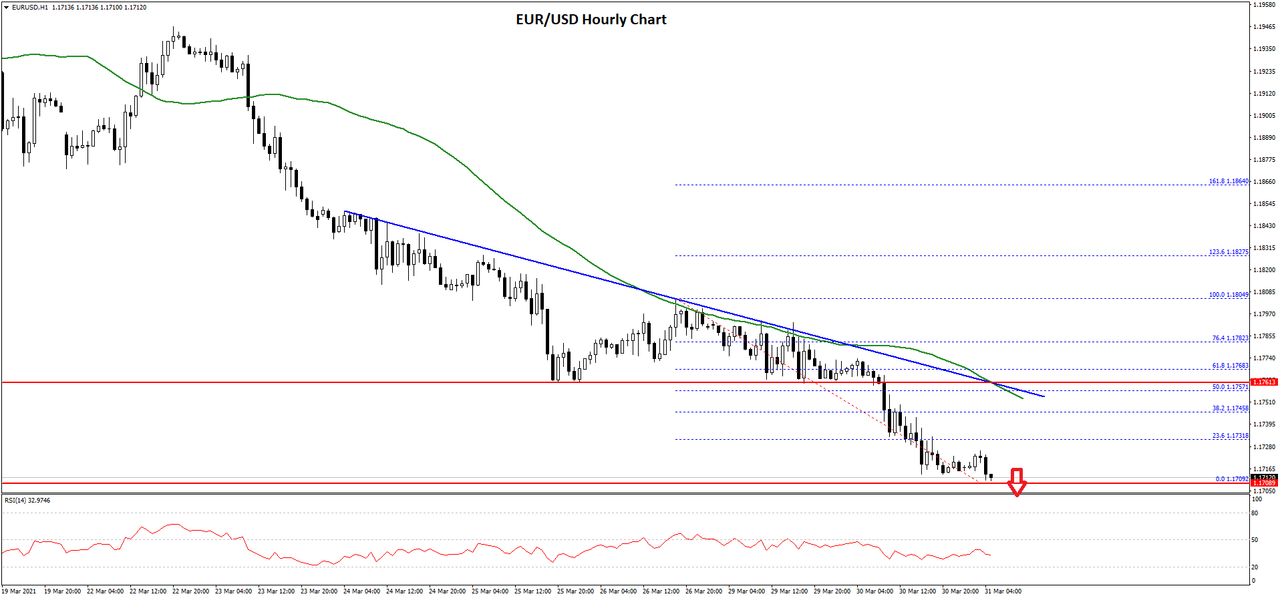
    The Euro failed to stay above the 1.1900 zone and started a fresh decline against the US Dollar. The EUR/USD pair broke the key 1.1850 pivot zone to move into a bearish zone.

    The pair even broke the 1.1820 support level and settled below the 50 hourly simple moving average. The bears were able to push the pair below 1.1800 and a low is formed near 1.1709 on FXOpen.

    It is currently showing a lot of bearish signs and it seems like there are high chances of more losses below the 1.1700 support zone. The next major support could be near the 1.1660 level, below which the pair may possibly test the 1.1620 support.

    On the upside, an initial resistance is near the 1.1730 level. It is close to the 23.6% Fib retracement level of the recent decline from the 1.1804 high to 1.1709 low.

    There is also a major bearish trend line forming with resistance near 1.1755 on the hourly chart of EUR/USD. The trend line is close to the 50% Fib retracement level of the recent decline from the 1.1804 high to 1.1709 low.

    The 50 hourly simple moving average is also near 1.1760. If there is a break above the trend line resistance, the pair could correct higher towards the 1.1800 zone. The next major resistance is near the 1.1850 level.

    Read Full on FXOpen Company Blog...

  9. #99
    Junior Member FXOpen Trader's Avatar
    Join Date
    Dec 2020
    Location
    Asia
    Posts
    2,040
    LTC and EOS – More upside expected


    LTC/USD

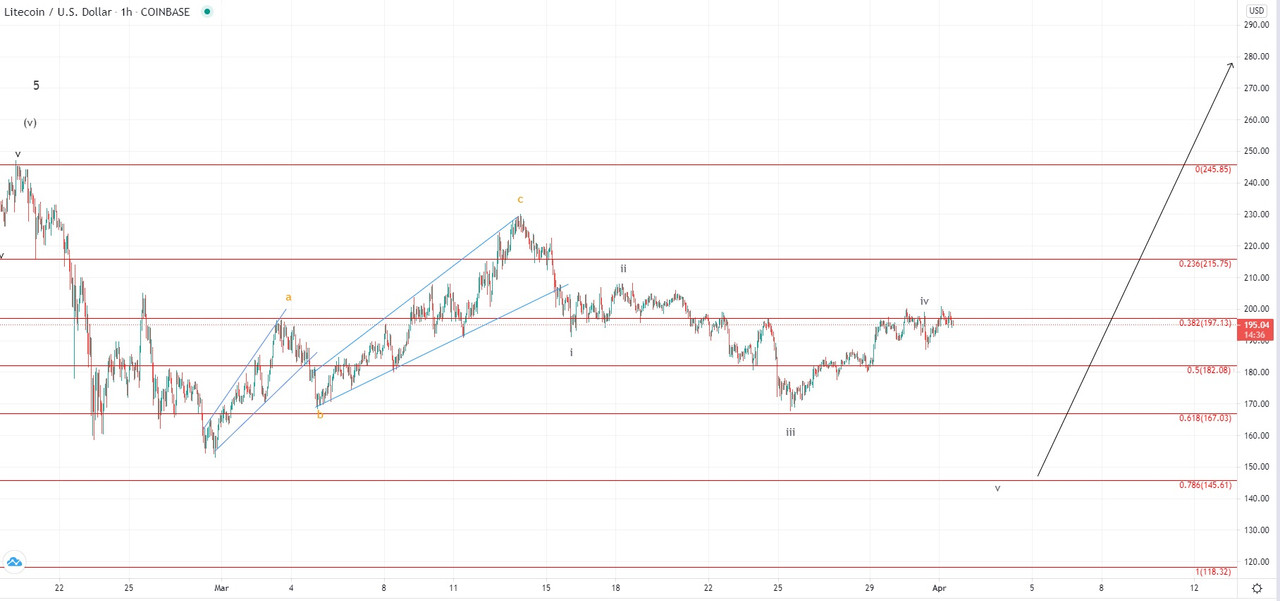
    The price of Litecoin has been on the rise from the 25th when it was being traded at $169. We have seen an increase of 18.7% as the price came up to $200 at its highest point today. Currently it is being traded slightly lower but is still in an upward trajectory overall.


    Looking at the hourly chart, we can see that the price came up to the 0.382 Fibonacci level and made an attempt to break out above it but failed to do so. The first attempt was made on the 29th from which we have seen some sideways movement below the level before finally another attempt was made today. The price would now be expected to make pullback as the 3rd attempt for a breakout failed, but we haven’t seen a rejection just yet.

    If from the 25th we have seen the development of the 4th corrective wave out of the five-wave impulse to the downside now the price would be starting the development of its 5th wave to the downside which would be set to achieve a lower low compared to the 25th one. However, there could be a possibility that the decrease ended as a three-wave move as the part of the higher degree complex correction count, in which case the ascending move would be the first sub-wave of the next starting impulse to the upside.

    In either way, we are going to see from the interaction with the 0.382 Fib level what would be the scenario, as if it manages to go above it, it would enter the territory of the 1st wave and invalidated the possibility of a lower low.

    Read Full on FXOpen Company Blog...

  10. #100
    Junior Member FXOpen Trader's Avatar
    Join Date
    Dec 2020
    Location
    Asia
    Posts
    2,040
    Gold Price and Oil Price Eye Additional Gains


    Gold price started a fresh increase after testing the $1,680 support zone. Crude oil price is trading nicely above $60.00 and it might continue to rise steadily.

    Important Takeaways for Gold and Oil

    • Gold price remained well bid near the $1,680 and $1,675 levels against the US Dollar.
    • There was a break above a major bearish trend line with resistance near $1,708 on the hourly chart of gold.
    • Crude oil price is holding the key $59.50 and $60.00 support levels.
    • There was a break above a key bearish trend line with resistance near $60.55 on the hourly chart of XTI/USD.


    Gold Price Technical Analysis

    Earlier this week, gold price extended its decline below the $1,710 and $1,700 support levels against the US Dollar. However, the bulls were active near the $1,680 and $1,675 levels.

    A low was formed near $1,677 on FXOpen before the price started a fresh increase. There was a break above the $1,695 and $1,700 resistance levels. The price climbed nicely above the 50% Fib retracement level of the downward move from the $1,745 swing high to $1,677


    There was also a break above a major bearish trend line with resistance near $1,708 on the hourly chart of gold. The price is now trading well above $1,710 and the 50 hourly simple moving average.

    It is now testing the 76.4% Fib retracement level of the downward move from the $1,745 swing high to $1,677 low. A successful break above the $1,730 resistance could open the doors for a larger increase in the coming sessions.

    The next key resistance is near the $1,745 level. The main resistance is still near $1,750, above which the price could test $1,780. Conversely, the price could fail to continue higher and it might decline below the $1,720 level.

    The main support is near the $1,705 level. A clear break below the $1,705 support may possibly start a strong decline towards $1,675 in the near term.

    Read Full on FXOpen Company Blog...

Page 10 of 164 FirstFirst ... 8 9 10 11 12 20 60 110 ... LastLast

Bookmarks

Posting Permissions

  • You may not post new threads
  • You may not post replies
  • You may not post attachments
  • You may not edit your posts
  •