BTC and XRP – Recovery seen but further downside expected
BTC/USD
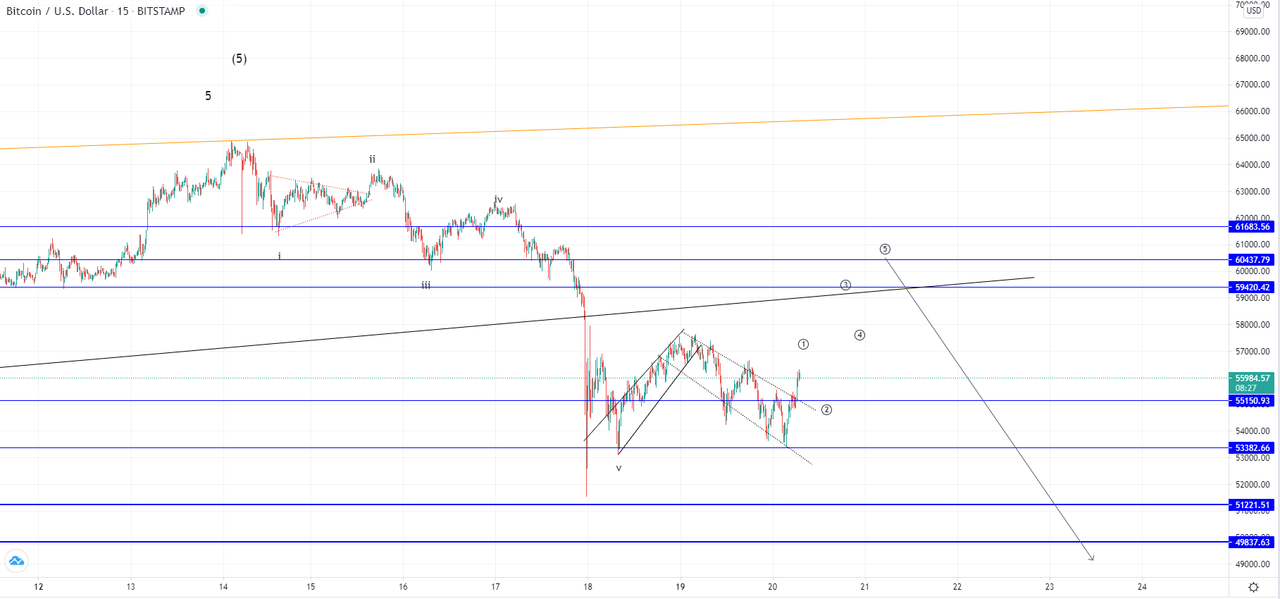
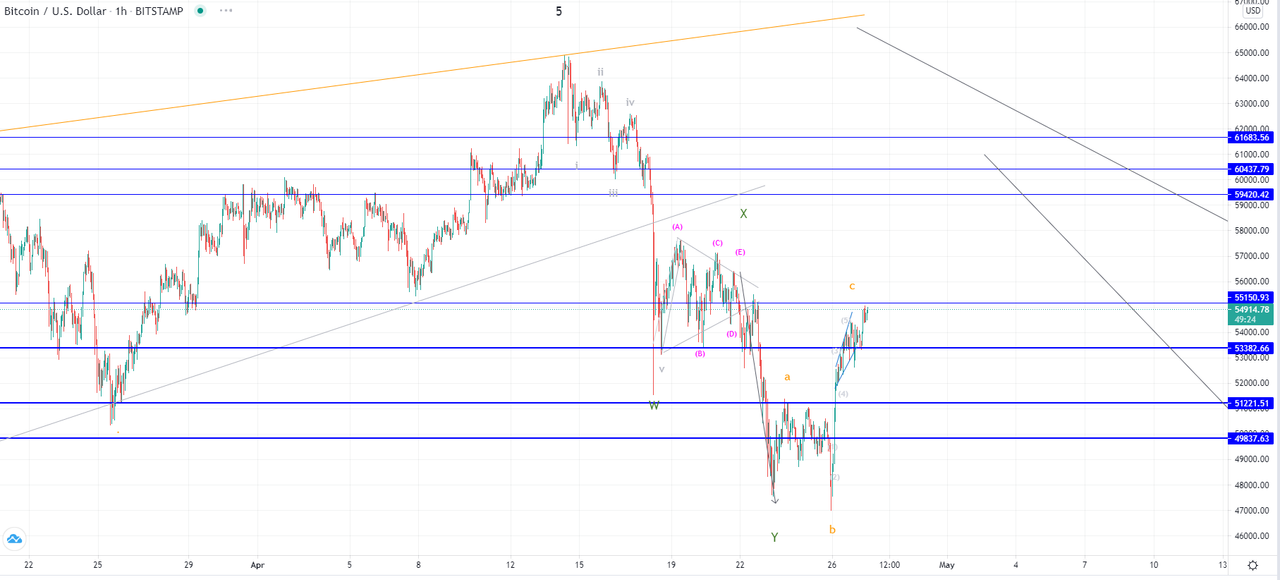
The price of Bitcoin has fallen by 20.4% measured from its all-time high of $64,791 made on the 14th of April to its lowest wick on the 17th when the price came down to $51,531. From there we have seen a recovery to $57,702 but then again the price started falling back down and is currently being traded at around $55,980.
On the hourly chart, you can see that the price made the majority of its decrease on the 17th which was the 5th wave from the descending impulse. This could be the first sub-wave of the higher degree downturn that we are to see in the market.
It broke down from some of the highly significant support levels both horizontal and the ascending triangle in which it was since the 21st of February. This ascending triangle could have been the ending diagonal which marked the completion of the five-wave impulse from March last year.
This is the overdue correction that the market needed to overcome in order to continue moving to the upside and is now likely to push the price further to the downside. However, this isn’t expected in a straight line. More likely we are to see now a corrective increase and a consolidation before another impulsive move to the downside of the equally strong amount.
Potentially we could see now an ABC correction out of which we are currently seeing the development of the B wave and in the upcoming days the C wave would make a higher high compared to Monday’s one but from there further lows would be expected below the $50,000 mark.
Read Full on FXOpen Company Blog...


 LinkBack URL
 About LinkBacks




 Reply With Quote









Bookmarks