Page 14 of 146 FirstFirst ... 4 12 13 14 15 16 24 64 114 ... LastLast
Results 131 to 140 of 1458

Daily Market Analysis By FXOpen

This is a discussion on Daily Market Analysis By FXOpen within the Analytics and News forums, part of the Trading Forum category; US April Inflation – Four Times Higher Than Market Expectations Last Wednesday, the Consumer Price Index (CPI) in the United ...


  1. #131
    Junior Member FXOpen Trader's Avatar
    Join Date
    Dec 2020
    Location
    Asia
    Posts
    1,769
    US April Inflation – Four Times Higher Than Market Expectations


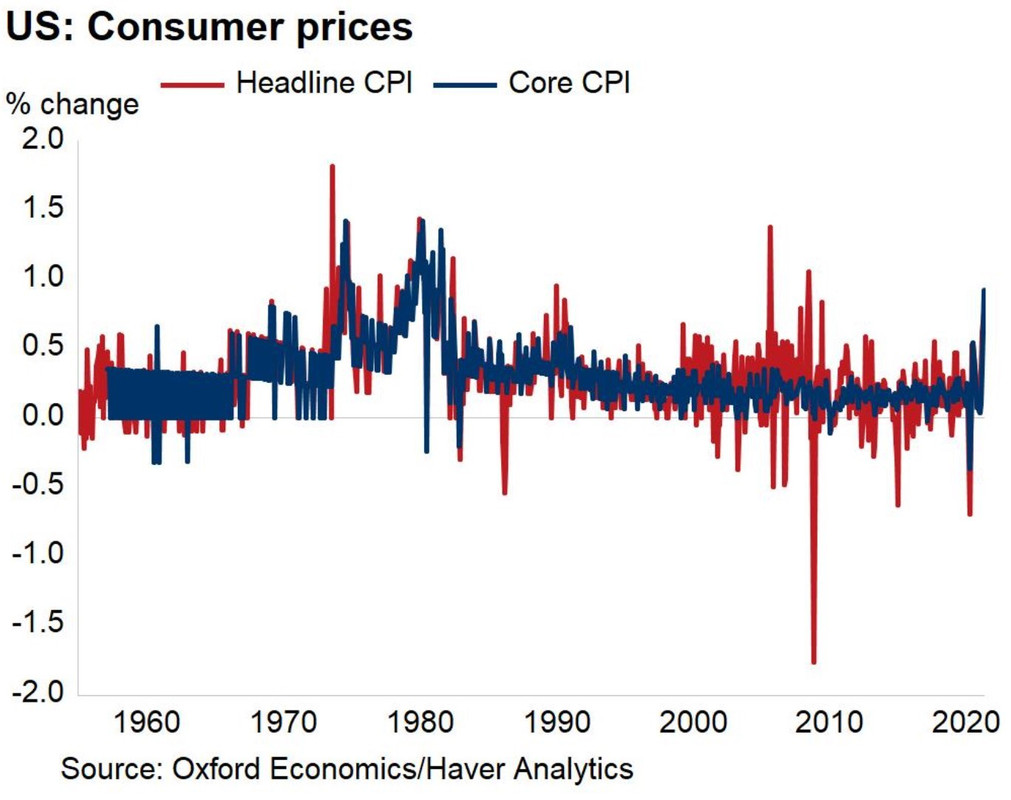
    Last Wednesday, the Consumer Price Index (CPI) in the United States showed that inflation runs hot in the largest economy in the world. On expectations of an increase of 0.2% on a monthly basis, the headline CPI came out four times higher.

    Moreover, the Core CPI, which tracks the changes in the price of goods and services over a period, without accounting for food and energy, was three times higher in April than the market expected. As such, inflation is running hot in America, and the whole world is watching.

    [

    A Comparison With the 1970s

    Back in the 1970s, inflation in America was printing double-digits on a monthly basis. The Fed fought a long battle to bring inflation down, mainly by raising the interest rates on the world’s reserve currency.

    This was a problematic thing to do at the time, because the US just gave up the gold standard. In other words, for the world to still trust the dollar without gold backing, the Fed stepped in and offered a higher interest rate.

    Fast forward to our times, and the Fed is unlikely to do the same despite rising inflation, for several reasons. First, the Fed changed its inflation mandate last year.

    We should mention here that the Fed has a dual mandate – price stability and job creation. For the first part of its mandate, it used an inflation-targeting framework for decades. Its aim was to create inflation close to the 2% target. This is similar to what other central banks in the world use, like the ECB, which aims at inflation below, but close to 2%.

    But the Fed chose to change the inflation-targeting framework last year. It announced that it no longer considers price stability at 2% inflation, but around 2% inflation.

    More precisely, the Fed averages inflation for a period, aiming at 2%. The problem is that the period considered is unknown to the market participants.

    In April this year, inflation exceeded the Fed’s 2% by a mile, if we consider the annualized data. Yet, the Fed says that the data is transitory. Indeed, if we average inflation for the past six or twelve-month, the result is way below the 2% level. Hence, the Fed is right in adopting a wait-and-see approach.


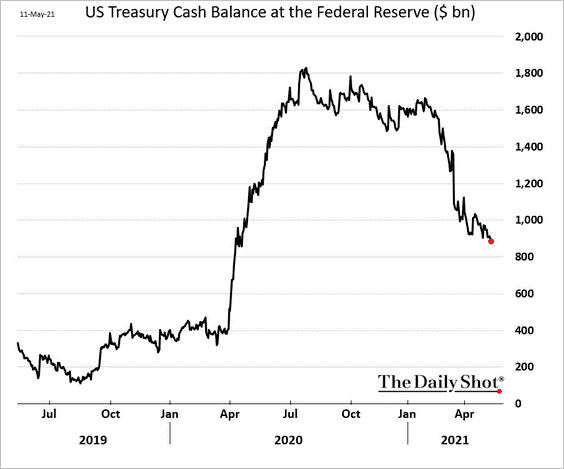
    Yet, more money is in the pipeline. The chart above shows the US Treasury cash balance at the Federal Reserve. Effectively, this is money held at the Fed, used by the US government to finance various projects or to support its fiscal expansion policy.

    Close to a trillion dollars are still available to be deployed into the US economy. Therefore, inflation is likely to run even higher in the months ahead.

    The question, at this point, is how much higher will inflation go, without the Fed to intervene? Also, how will the financial markets react?

    The initial reaction to the higher inflation data last Wednesday showed weakness in the US equity markets. But that weakness reversed in the following two trading days, as the main stock indices recovered most of the lost ground in the two days left in the trading week.

    However, if we use the 1970s as a benchmark, higher inflation triggers an equity bear market. Will we see one in 2021?

    FXOpen Blog

  2. #132
    Junior Member FXOpen Trader's Avatar
    Join Date
    Dec 2020
    Location
    Asia
    Posts
    1,769
    BTC and XRP – Further downside looks more likely


    BTC/USD

    The price of Bitcoin has been on a decline since the 10th of May when it reached a high of $59,512. From there we have seen a decrease of 29.3% so far as it fell down to $42,180 at its lowest point. It is currently retesting those low levels for support and it appears to have stabilized as it made another attempt to continue its downward trajectory but bounced off of the low levels. Now it is moving slightly to the upside and is being traded at $44,923.


    Looking at the hourly chart above, we can see that this down move from the 10th is the continuation of the decrease that started from the 14th of April after the price reached a new all-time high. As it is most likely the 3rd sub-wave of the corrective ABC this could mean that the descending move has ended on the current interaction with the significant horizontal support zone.

    However, if this is the 4th wave of the cycle degree the correction might get deeper and prolonged. In this case, these first three waves could be prolonged by another two more either as the WXYXZ complex correction or in the worst-case scenario a five-wave impulse that would only be the 1st sub-wave of the higher degree ABC.

    We are shortly going to see from the expected upward move and the following pullback which scenario could be more likely but for now the primary one is that the downfall could have ended as the ABC move.

    Read Full on FXOpen Company Blog...

  3. #133
    Junior Member FXOpen Trader's Avatar
    Join Date
    Dec 2020
    Location
    Asia
    Posts
    1,769
    GBP/USD Extends Rally, EUR/GBP Eyes Steady Recovery


    GBP/USD remained strong above 1.4000 and it recently climbed above 1.4200. EUR/GBP is correcting higher and it is aiming a break above 0.8640.

    Important Takeaways for GBP/USD and EUR/GBP

    • The British Pound formed a strong support base above 1.4050 and climbed above 1.4150.
    • There is a key bullish trend line forming with support near 1.4155 on the hourly chart of GBP/USD.
    • EUR/GBP started a fresh increase and it is trading above the 0.8600 zone.
    • There is a major rising channel forming with resistance near 0.8640 on the hourly chart.


    GBP/USD Technical Analysis

    After finding a strong buying interest near 1.4000, the British Pound started a fresh increase against the US Dollar. The GBP/USD pair gained pace and it broke the 1.4100 resistance zone.

    The upward move gained pace above the 1.4150 level and the 50 hourly simple moving average. It even broke the 1.4200 zone and traded as high as 1.4220 on FXOpen. It is now correcting gains and trading below the 1.4200 level.


    It broke the 23.6% Fib retracement level of the upward move from the 1.4077 swing low to 1.4220 high. On the downside, the first key support is near the 1.4165 level.

    The main support is now forming near the 1.4150 level. There is also a key bullish trend line forming with support near 1.4155 on the hourly chart of GBP/USD. The trend line is close to the 50% Fib retracement level of the upward move from the 1.4077 swing low to 1.4220 high.

    The 50 hourly simple moving average is also near the 1.4155 zone. If there is a downside break below the trend line, the pair could decline towards the 1.4100 support.

    On the upside, an immediate resistance is near the 1.4200 level. The next major resistance is near the 1.4220 level. A successful close above 1.4000 and a follow up move above 1.4220 could open the doors for a move towards the 1.4280 resistance.

    Read Full on FXOpen Company Blog...

  4. #134
    Junior Member FXOpen Trader's Avatar
    Join Date
    Dec 2020
    Location
    Asia
    Posts
    1,769
    LTC and EOS – Have we seen the completion of the downfall?


    LTC/USD

    The price of Litecoin has been on a decline since the 10th of May when it reached $413 at its highest point. From there we have seen a decrease of 64.88% as it fell to $145 at its lowest point yesterday. We have seen a recovery taking place with the price currently being traded at $211 and is still in an upward trajectory.


    On the hourly chart, you can see that the price has made a lower low today, compared to yesterday’s candle close, and is now still above yesterday’s high. This is still a negative sign even though recovery has been seen. We could bee saw the 4th corrective wave out of the five-wave impulse to the downside from the 16th which is still in development. If this is true then the price would be headed downwards after this increase ends for another establishment of support around the $165 area.

    In another move positive scenario the decrease ended with today’s recovery being the 1st sub-wave of the next five-wave impulse to the upside. Even so a retracement would be expected and first a surpassing of yesterday’s high so for the pullback that is expected to follow we can evaluate these possibilities.

    Read Full on FXOpen Company Blog...

  5. #135
    Junior Member FXOpen Trader's Avatar
    Join Date
    Dec 2020
    Location
    Asia
    Posts
    1,769
    AUD/USD and NZD/USD Remain At Risk of More Losses


    AUD/USD failed to clear the 0.7800 resistance and corrected lower. NZD/USD is likely to decline further if there is a break below the 0.7180 level.

    Important Takeaways for AUD/USD and NZD/USD

    • The Aussie Dollar is struggling to gain pace above 0.7800 zone against the US Dollar.
    • There is a major bearish trend line forming with resistance near 0.7775 on the hourly chart of AUD/USD.
    • NZD/USD corrected lower after it failed to surpass the 0.7270 resistance zone.
    • There is a key contracting triangle forming with support near 0.7180 on the hourly chart of NZD/USD.


    AUD/USD Technical Analysis

    Recently, the Aussie Dollar attempted an upside break above the 0.7800 resistance against the US Dollar. The AUD/USD pair failed to settle above 0.7800 and started a fresh decline.

    It broke the 0.7750 support level and tested the 0.7710 level. A low was formed near 0.7710 on FXOpen and it recently there was an upside correction. The pair climbed above 0.7750 and the 50 hourly simple moving average.


    However, it is struggling to clear the 0.7780 level. A high is formed near 0.7781 and the pair is now correcting lower. There was a break below the 23.6% Fib retracement level of the upward move from the 0.7710 swing low to 0.7781 high.

    The pair is now trading near the 0.7755 level and the 50 hourly simple moving average. There is also a major bearish trend line forming with resistance near 0.7775 on the hourly chart of AUD/USD.

    On the upside, there is a major resistance forming near the 0.7780 and 0.7800 levels. A successful break above the trend line and the 0.7800 zone is must for a steady increase. The next major resistance could be 0.7840, above which the price could rise towards the 0.7880 resistance.

    Conversely, the pair could decline below the 0.7750 support zone. The next major support is near the 0.7725 level. If there is a downside break below the 0.7725 level, the pair could extend its decline towards the 0.7680 level.

    Read Full on FXOpen Company Blog...

  6. #136
    Junior Member FXOpen Trader's Avatar
    Join Date
    Dec 2020
    Location
    Asia
    Posts
    1,769
    GBP/USD Holding Uptrend Support, GBP/JPY Eyes Additional Gains


    GBP/USD found support near 1.3825 and it is now showing positive signs. GBP/JPY is stable above 149.40 and it is now facing hurdles near 150.00.

    Important Takeaways for GBP/USD and GBP/JPY

    • The British Pound extended its increase above the 1.4200 region against the US Dollar.
    • There is a major bullish trend line forming with support near 1.4135 on the hourly chart of GBP/USD.
    • GBP/JPY is correcting gains from the 155.00 resistance zone.
    • There is a key bearish trend line forming with resistance near 154.40 on the hourly chart.


    GBP/USD Technical Analysis

    In the past few sessions, the British Pound saw a steady increase above the 1.4000 zone against the US Dollar. The GBP/USD pair broke the 1.4100 level and extended its upward move.

    There was even a break above the 1.4200 resistance zone. A high was formed near 1.4233 on FXOpen and the pair is currently correcting gains. It broke the 1.4200 and 1.4180 support levels.


    There was also a spike below the 1.4150 level and the 50 hourly simple moving average. A low is formed near 1.4136 and the pair is now consolidating. There is also a major bullish trend line forming with support near 1.4135 on the hourly chart of GBP/USD.

    On the upside, an immediate resistance is near the 1.4160 level and the 50 hourly simple moving average. It is close to the 23.6% Fib retracement level of the recent decline from the 1.4233 high to 1.4136 low.

    The first major resistance is near the 1.4185 level. The 50% Fib retracement level of the recent decline from the 1.4233 high to 1.4136 low is also near the 1.4185 level. Any more gains could set the pace for a strong rally above the 1.4200 level.

    Conversely, the pair could break the trend line support and continue lower below 1.4135. The next major support is near the 1.4100 level. If there are additional losses, the pair could decline towards the 1.4000 level.

    Read Full on FXOpen Company Blog...

  7. #137
    Junior Member FXOpen Trader's Avatar
    Join Date
    Dec 2020
    Location
    Asia
    Posts
    1,769
    Cryptocurrencies Tumble in April – What Comes Next?


    Over the weekend, the cryptocurrency market took another tumble. Bitcoin fell more than 10% and tested the $32k level before bouncing. Also, Ethereum and other cryptocurrencies have lost more, with most of the coins down over 50% in April.

    It all started with Elon Musk, the CEO of Tesla, tweeting at the start of the trading month that the company will not accept Bitcoin as payment for the purchasing of its electric vehicles. As such, Bitcoin collapsed, and other digital assets followed the same path.


    Is It the First Time When Bitcoin Drops That Much?

    A quick check at the Bitcoin’s price history reveals that such a drop is actually part of the way the asset moves. Throughout history, Bitcoin lost over 80% of its value three times – in 2013, 2016, and 2018.

    Some other times, it frequently lost more than 40% of its value. Yet, Bitcoin did found its way out of it, although the volatility is not for the everyone.


    If we look at what happened in May so far, Bitcoin’s price corrected from over $60k close to $30k. That is a drop of 50% in less than a month.

    This is a problem not only for the crypto assets but for traditional financial assets too. One must remember how Bitcoin’s adoption has increased among institutional investors lately, and such a drop may end up posing a systemic risk to markets.

    It did not, so far, as the equity markets remain stable. However, the declines in some crypto assets are so steep that institutional investors that adopted crypto have some explaining to do to their clients.

    All in all, the move lower in Bitcoin is not unusual if we check historical prices. The only thing that is different at this point is that the move lower does not affect only retail traders anymore but also institutional investors. If the bearish market continues, the risk of seeing some spillovers in the traditional markets increases exponentially.

    FXOpen Blog

  8. #138
    Junior Member FXOpen Trader's Avatar
    Join Date
    Dec 2020
    Location
    Asia
    Posts
    1,769
    BTC and XRP – Starting impulse to the upside likely developing


    BTC/USD

    The price of Bitcoin has recovered significantly from Sunday’s low of around $32,000 as it made an increase of 27% measured to its highest point today at $39.723. Since then we have seen a minor pullback with the price currently being traded at $37,896 and moving to the downside again.

    On the hourly chart, you can see that the price made a five-wave increase from Sunday and came slightly above the significant horizontal level that served as support now turned resistance. This is why the price struggled to keep up its upward trajectory and is now headed to the downside again.


    From Sunday we have most likely seen the start of the next move to the upside as the corrective ABC of the highest degree ended. If this is true, then we are now seeing the first sub-wave of the next five-wave impulse coming to completion as is why the currently seen downside move would be expected to continue pushing the price further down. That would be expected to develop as the 2nd sub-wave of the higher degree count and it should now form a higher low compared to Sunday’s one, potentially around $36,000 where the next horizontal support is in line. But from there further upside movement would be expected and a breakout above the $42,000 horizontal zone.

    Read Full on FXOpen Company Blog...

  9. #139
    Junior Member FXOpen Trader's Avatar
    Join Date
    Dec 2020
    Location
    Asia
    Posts
    1,769
    EUR/USD Eyes Additional Gains, USD/JPY Remains At Risk


    EUR/USD is gaining pace above the 1.2200 resistance zone. USD/JPY is showing bearish signs below the 108.85 and 109.00 resistance levels.

    Important Takeaways for EUR/USD and USD/JPY

    • The Euro started a fresh increase above the 1.2200 resistance zone.
    • There is a key bullish trend line forming with support near 1.2240 on the hourly chart of EUR/USD.
    • USD/JPY declined below the 109.20 and 109.00 support levels.
    • There is a major bearish trend line forming with resistance near 109.00 on the hourly chart.


    EUR/USD Technical Analysis

    After forming a base above the 1.2050 level, the Euro started a fresh increase against the US Dollar. The EUR/USD pair broke the 1.2150 resistance level to move into a positive zone.

    The pair even broke the 1.2200 level and settled nicely above the 50 hourly simple moving average. A high is formed near 1.2263 on FXOpen and the pair is now consolidating gains. It corrected lower below the 1.2250 support zone.


    There was a break below the 23.6% Fib retracement level of the recent wave from the 1.2160 swing low to 1.2263 high. However, the pair is holding the 1.2200 support zone.

    There is also a key bullish trend line forming with support near 1.2240 on the hourly chart of EUR/USD. If there is a downside break below the trend line, the pair could test the 1.2210 zone. It is near the 50% Fib retracement level of the recent wave from the 1.2160 swing low to 1.2263 high.

    An intermediate support is near the 1.2225 level and the 50 hourly simple moving average. On the upside, the pair is likely to accelerate higher if it clears 1.2265. The next major resistance is near the 1.2300 level. Any more gains could lead the pair towards the 1.2350 level. An intermediate resistance might be near the 1.2320 level.

    Read Full on FXOpen Company Blog...

  10. #140
    Junior Member FXOpen Trader's Avatar
    Join Date
    Dec 2020
    Location
    Asia
    Posts
    1,769
    LTC and EOS – At key turning point


    LTC/USD

    The price of Litecoin has been on the rise since the 23rd when it fell down to $128.32 at its lowest point. From there we have seen an increase of 58% measured to its highest point yesterday at around $203. Since then a minor pullback was made but the price is once again in an upward trajectory and is currently being traded at $196.3.


    On the hourly chart, you can see that from the 23rd of May we have seen an impulsive five-wave move after which the price started consolidating. It did so in a three-wave manner which is most likely the 2nd sub-wave of the next higher degree impulse to the upside. We have seen the completion of a 3-3-5 move with a higher low made today compared to the one on the 25th as the first pullback which validated that the support is getting higher and that buyers are stepping in.

    If this was a running flat correction that ended now today we have seen the start of the next wave to the upside which is set to exceed the high on the 25th and propel the price much stronger potentially to the territory of the 0.5 Fib level at around $264.65. But if this is the five-wave impulse of the higher degree it should continue moving to the upside beyond that point after another pullback on the 4th wave.

    Read Full on FXOpen Company Blog...

Page 14 of 146 FirstFirst ... 4 12 13 14 15 16 24 64 114 ... LastLast

Bookmarks

Posting Permissions

  • You may not post new threads
  • You may not post replies
  • You may not post attachments
  • You may not edit your posts
  •