Gold Price and Oil Price Turn Attractive On Dips
Gold price traded above the $1,900 resistance zone before correcting lower. Crude oil price is rising and it is trading nicely above the $65.00 pivot level.
Important Takeaways for Gold and Oil
- Gold price gained pace above the $1,850 and $1,880 resistance levels against the US Dollar.
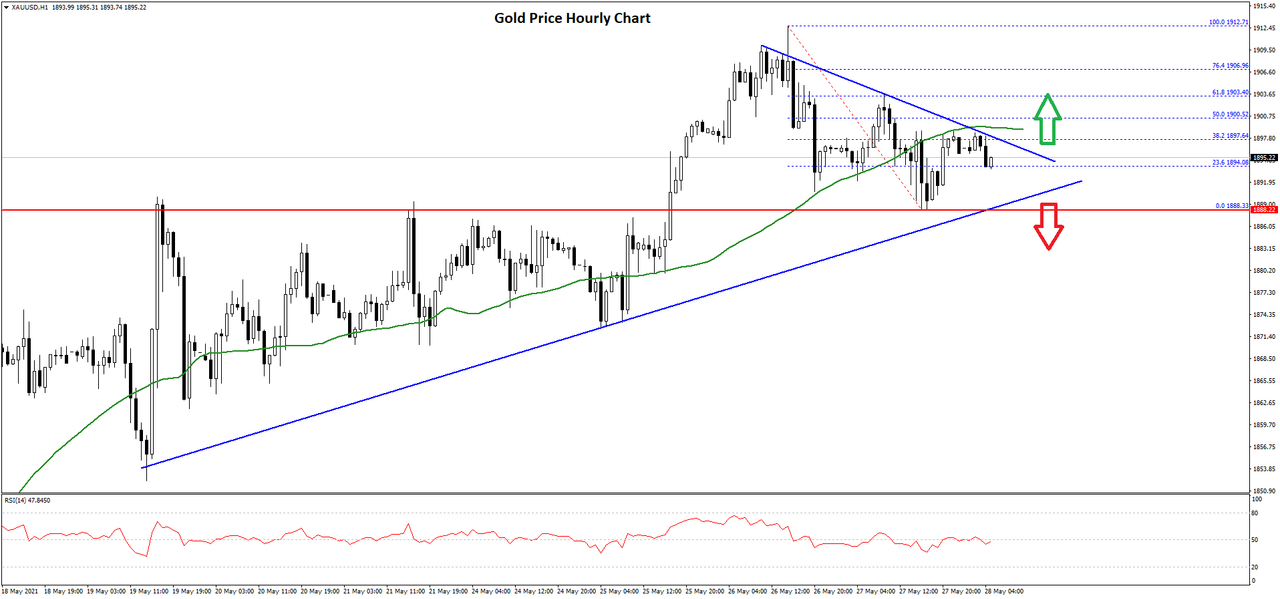
- There is a key contracting triangle forming with resistance near $1,898 on the hourly chart of gold.
- Crude oil price climbed higher and it cleared the $67.00 resistance zone.
- There is a major bullish trend line forming with support near $66.00 on the hourly chart of XTI/USD.
Gold Price Technical Analysis
This week, gold price started a steady increase above the $1,850 level against the US Dollar. It broke a few key hurdles near $1,880 to move further into a positive zone.
The price even settled above the $1,880 zone and the 50 hourly simple moving average. There was a clear break above the $1,900 level and a high was formed near $1,912 on FXOpen. The price is now correcting gains and trading below $1,900.
There was a break below $1,890, but downsides were limited. The price traded as low as $1,888 and the price is now consolidating. It seems like there is a key contracting triangle forming with resistance near $1,898 on the hourly chart of gold.
The triangle resistance is near the 38.2% Fib retracement level of the recent decline from the $1,912 high to $1,888 low. The main resistance is now forming near the $1,900 level and the 50 hourly simple moving average.
The 50% Fib retracement level of the recent decline from the $1,912 high to $1,888 low is also near the $1,900 zone. A clear break above the $1,900 level may possibly open the doors for a move towards the $1,920 level or even $1,935.
On the downside, the price is likely to find bids near $1,888. If there is a downside break below $1,888, there are chances of a move towards the $1,870 level in the near term.
Read Full on FXOpen Company Blog...


 LinkBack URL
 About LinkBacks




 Reply With Quote






Bookmarks