Page 25 of 164 FirstFirst ... 15 23 24 25 26 27 35 75 125 ... LastLast
Results 241 to 250 of 1639

Daily Market Analysis By FXOpen

This is a discussion on Daily Market Analysis By FXOpen within the Analytics and News forums, part of the Trading Forum category; Bitcoin Trades Back Above $60,000, Eyes New Record Highs Cryptocurrency traders and investors are cheering the recent bitcoin rally. The ...


  1. #241
    Junior Member FXOpen Trader's Avatar
    Join Date
    Dec 2020
    Location
    Asia
    Posts
    2,040
    Bitcoin Trades Back Above $60,000, Eyes New Record Highs


    Cryptocurrency traders and investors are cheering the recent bitcoin rally. The leading cryptocurrency is trading back above $60,000, coming close to a new all-time high.

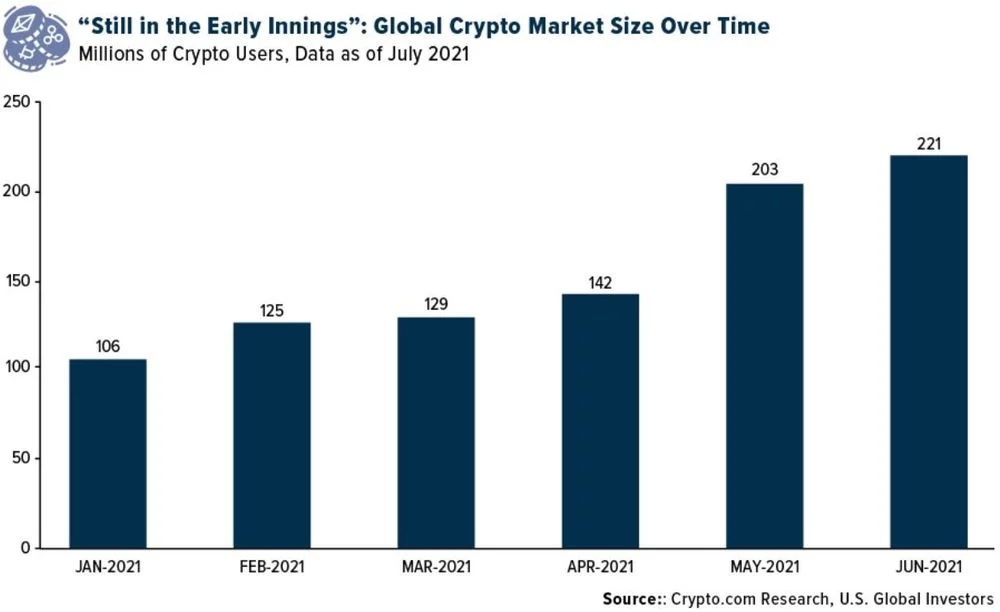
    The most recent data related to the crypto market size explains why bitcoin has attracted so many buyers in the latest months. The global crypto market size keeps growing, with more and more people shifting their gaze to crypto assets. In a single month, from May to June 2021, the crypto market added 18 million new users. Because bitcoin is the most popular coin, it is likely that the new funds injected into the crypto space went to it.


    Bullish Developments in the Crypto Space

    Besides the increased popularity in the cryptocurrency space, as suggested by the rising number of crypto users, some other recent bitcoin-related events can be characterized as bullish.

    One comes from the Security and Exchange Commission (SEC). It is poised to approve the first-ever bitcoin ETF, which would open the space to a much wider investors base. This news alone was largely responsible for bitcoin’s recent rally. An ETF is an exchange-traded fund that tracks the price movements of its underlying – in this case, bitcoin. Investors favor ETFs due to them being a cost-efficient way of trading expensive assets.

    Another such driver is the Bank of America’s decision to introduce coverage of digital assets as the cryptocurrency market reached $2 trillion in market value.

    The recent developments triggered enthusiasm among crypto traders, and so the crypto market continues to rise. In the meantime, bitcoin has surpassed Facebook in terms of market value and is on track to take the silver.

    Bitcoin traded close to $65,000 back in April this year, and it corrected after Elon Musk, the CEO of Tesla, suggested that the digital asset is too expensive. The current upwards movement also helps Tesla, as the company holds more than $1 billion worth of bitcoins on its balance sheet.

    FXOpen Blog

  2. #242
    Junior Member FXOpen Trader's Avatar
    Join Date
    Dec 2020
    Location
    Asia
    Posts
    2,040
    BTCUSD and XRPUSD Technical Analysis – 19th OCT, 2021


    BTCUSD: Bitcoin Rally Towards $65k Confirmed

    Bitcoin continues to consolidate its gains and has touched a 6-month high of $62,965 in the Asian trading session. Since the price of BTC has already crossed its major resistance levels of $62,232 today, we may see some consolidation in the levels towards sub $62,000 handle in the US trading session.

    Bitcoin is trading above its both 100 hourly and 200 hourly moving averages. The rally in BTC continues with fresh buying support seen after it touched an intraday low of $61,100 today in the early Asian trading session.

    Bitcoin is moving in a strong bullish momentum, and a fresh rally is expected to push its prices above the $65,000 handle this week.

    The medium to long-term outlook for bitcoin remains bullish with immediate targets for today at $63,200.

    • Bitcoin is holding above its major resistance levels of $58,462, indicating more upsides
    • Consolidation in the prices is expected after touching a 6-month high towards $61,400 level
    • The price is now trading above its classic support level of $61,860
    • All the moving averages are giving a STRONG BUY signal at current market levels of $62,108


    Bitcoin Consolidating Its Gains Above $60k


    BTCUSD is gaining momentum. Its price continues to remain above the important psychological level of $60k. At the moment, the price of BTCUSD is facing a Fibonacci resistance level of $62,531, and Woodies resistance level of $62,798, after which the path towards $63,000 will be cleared.

    In the last 24hrs, BTCUSD has risen UP by +0.83% / +825$ and has a 24hr trading volume of USD 39.152 billion.

    Bitcoin Acceptance Increases

    The global acceptance of bitcoin is growing. The number of BTC transactions continues to increase, which leads to its higher demand on cryptocurrency exchanges.

    This year, residents of Brazil have bought 4 billion USD worth of crypto, including bitcoin. Brazil is expected to pass a bill to legalize bitcoin as legal tender.

    Investments in bitcoin are expected to grow as well, with the listing of bitcoin exchange traded funds (ETFs). Some crypto analysts believe that bitcoin ETFs will allow billions of dollars managed by pension funds and other institutional investors to flow into bitcoin.

    The Week Ahead

    The price of BTCUSD is holding above $60,000, and after some consolidation, the bullish uptrend movement will start pushing its price above the $63,000 handle.

    If the prices of BTCUSD continue to remain above the $63,000 mark this week, we may see a fresh rally towards $65,000 in the markets in the opening of the next week.

    Both the medium- and long-term outlooks remain positive. Next week, we may witness BTC printing at above the $65,000 mark.

    Technical Indicators:

    Ultimate oscillator: at 58.88 indicating a BUY

    Rate of price change (ROC): at 0.653 indicating a BUY

    Moving averages convergence divergence (12,26): at 228.80 indicating a BUY

    Relative strength index (14-day): at 55.39 indicating a BUY

    Read Full on FXOpen Company Blog...

  3. #243
    Junior Member FXOpen Trader's Avatar
    Join Date
    Dec 2020
    Location
    Asia
    Posts
    2,040
    EUR/USD Eyes Recovery, USD/CHF Could Break Higher


    EUR/USD started a fresh rise above the 1.1620 resistance zone. USD/CHF is eyeing an upside break above the 0.9260 resistance zone in the near term.

    Important Takeaways for EUR/USD and USD/CHF

    • The Euro started a fresh recovery wave above the 1.1600 zone against the US Dollar.
    • There is a key bullish trend line forming with support near 1.1605 on the hourly chart of EUR/USD.
    • USD/CHF started a decent increase from the 0.9185 support zone.
    • There is a major bearish trend line forming with resistance near 0.9250 on the hourly chart.


    EUR/USD Technical Analysis

    The Euro formed a base above the 1.1530 zone against the US Dollar. As a result, the EUR/USD pair started a fresh increase above the 1.1550 and 1.1560 resistance levels.

    The pair was able to clear the 1.1600 resistance and the 50 hourly simple moving average. It even spiked above 1.1650 resistance. A high was formed near 1.1669 on FXOpen and the pair is now correcting lower.

    EUR/USD Hourly Chart


    There was a break below the 23.6% Fib retracement level of the upward move from the 1.1572 swing low to 1.1669 high. It is now consolidating near the 1.1635 level and above the 50 hourly simple moving average. An immediate support is near the 1.1625 level.

    It is near the 50% Fib retracement level of the upward move from the 1.1572 swing low to 1.1669 high. The next major support is near the 1.1605 level. There is a key bullish trend line forming with support near 1.1605 on the hourly chart of EUR/USD.

    A downside break below the 1.1600 support could start another decline. The next major support sits near 1.1550. On the upside, an initial resistance is near the 1.1650 level.

    The main resistance is near 1.1665. If there is an upside break above the 1.1665 resistance zone, the price could rise steadily towards the 1.1720 resistance zone.

    Read Full on FXOpen Company Blog...

  4. #244
    Junior Member FXOpen Trader's Avatar
    Join Date
    Dec 2020
    Location
    Asia
    Posts
    2,040
    ETHUSD and LTCUSD Technical Analysis – 21st OCT, 2021


    ETHUSD: Bullish Engulfing Pattern Above $4000

    Ethereum is moving in a strong bullish momentum after clearing the psychological resistance level of $4000. The price of ETHUSD touched an intraday high of $4241 in the Asian trading session and is now preparing for its next rally towards the $5000 handle.

    ETH is now trading above its pivot level of $4157 and Fibonacci resistance level of $4169. The price of Ethereum is surging continuously today and is about to break its classic resistance level of $4206.

    Ether is expected to maintain the bullish tone this week and continue towards the $4500 mark as the bulls take over. All the major technical indicators are giving a BUY signal.

    ETH is now moving above both the 100 hourly and 200 hourly simple moving averages. Bullish engulfing pattern above $4000 suggests that we could witness a fresh rally towards $5000 soon.

    • Ethereum continues to remain above the psychological level of $4000
    • Short-term to medium-term outlooks remain bullish for ETHUSD
    • All the moving averages are giving a STRONG BUY signal
    • The pair is expected to touch $4500 in the US trading session today


    Ether’s Rally Towards $5000 Confirmed


    ETHUSD is consolidating its gains above $4000 and is now preparing for its next upwards move against the US dollar. ETH is now facing its next major resistance levels of $4240 and $4320, after which the path towards $4500 will get cleared.

    After surging above $4000, Ethereum’s volatility is low, suggesting that now investors are waiting to enter the market anticipating a major bullish move.

    ETH has gained 8.79% with a price change of +$339.35 in the past 24hrs and has a trading volume of 24.516 billion USD.

    Ethereum ETF

    The total market capitalization of Ethereum continues to increase, and at present is valued at 455 billion USD. The investors are eagerly waiting for the launch of Ethereum ETF in the US markets, which would bring a larger number of investors into its domain.

    Grayscale has announced its plans to launch an ETF based on Ethereum. At the moment, 4 Ethereum ETFs are trading in Canadian securities exchange, and plans are on to launch in the US market.

    Some crypto analysts believe that with the Ethereum ETFs, more institutional investors will come in, leading to its higher demand and a surge in the price well above $6000.

    The Week Ahead

    Ethereum dips remain well supported, and an increased buying pressure is seen above the $4000 mark. The bullish trend continues from last week. Any bearish corrections will serve as a buying opportunity for long-term traders.

    This week we may witness Ethereum touching the levels of $4500 — and then extending its rally towards the $5000 handle in the opening of the next week.

    As the price of ETHUSD remains above its 100 hourly exponential moving average, a breakout above $4400 is expected this week.

    Technical Indicators:

    Average directional change (14-day): at 48.125 indicating a BUY

    Bull/Bear power (13-day): at 47.63 indicating a BUY

    Rate of price change: at 1.148 indicating a BUY

    Moving averages convergence divergence (12,26): at 66.36 indicating a BUY

    Read Full on FXOpen Company Blog...

  5. #245
    Junior Member FXOpen Trader's Avatar
    Join Date
    Dec 2020
    Location
    Asia
    Posts
    2,040
    Gold Price and Crude Oil Price Eye Upside Break


    Gold price is facing resistance near $1,790 and $1,800. Crude oil price remains elevated above the key $80.00 pivot level and it is eyeing more upsides.

    Important Takeaways for Gold and Oil

    • Gold price started a decent increase above the $1,760 resistance against the US Dollar.
    • There was a break above a major contracting triangle with resistance near $1,785 on the hourly chart of gold.
    • Crude oil price extended its rally towards the $83.70 level before it started a downside correction.
    • There is a key bullish trend line forming with support near $81.30 on the hourly chart of XTI/USD.


    Gold Price Technical Analysis

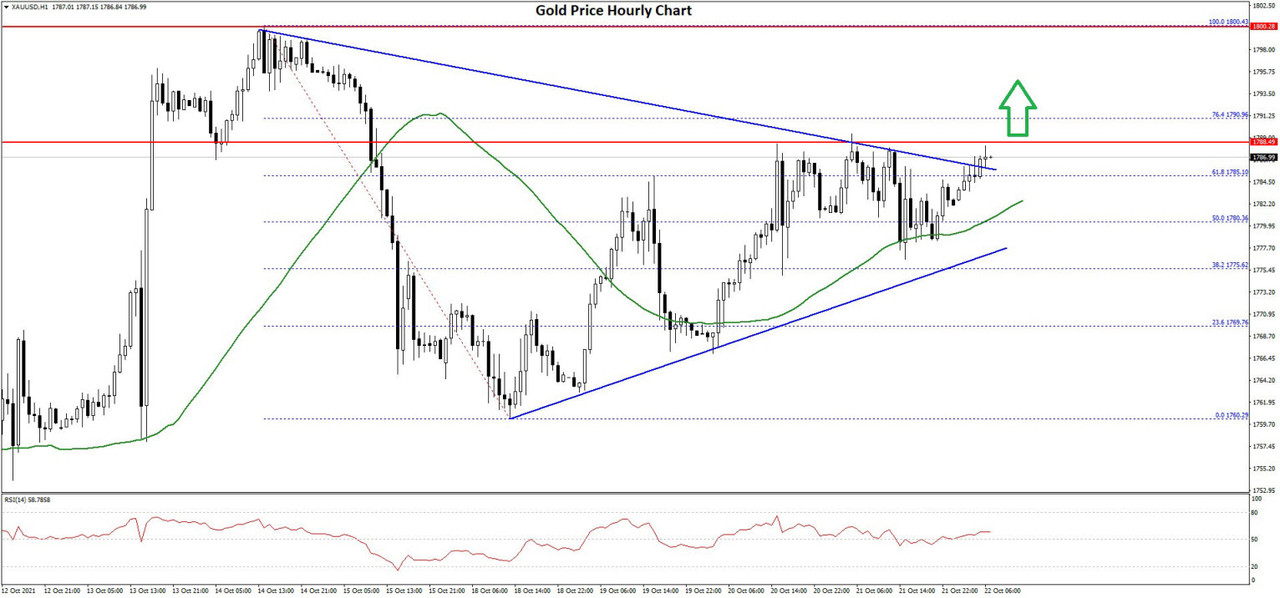
    Gold price started a fresh increase above the $1,750 pivot level against the US Dollar. The price gained pace and it was able to settle above the $1,780 resistance zone.

    A high was formed near $1,800 on FXOpen and the price corrected lower. There was a break below the $1,780 and $1,775 levels. However, the bulls were active above the $1,750 level. A low was formed near $1,760 and the price is now rising.

    Gold Price Hourly Chart


    The price is back above the $1,780 level and the 50 hourly simple moving average. It also surpassed the 50% Fib retracement level of the key drop from the $1,800 swing high to $1,760 low.

    There was also a break above a major contracting triangle with resistance near $1,785 on the hourly chart of gold. An immediate resistance on the upside is near the $1,788 and $1,790 levels. It is near the 76.4% Fib retracement level of the key drop from the $1,800 swing high to $1,760 low.

    The first major resistance is near the $1,792 level. The main resistance is near the $1,800 level. A close above the $1,800 level could open the doors for a move towards $1,820.

    On the downside, the first major support is near the $1,782 level and the 50 SMA. A downside break below the $1,762 support zone may possibly call for a test of the $1,765 support zone in the near term.

    Read Full on FXOpen Company Blog...

  6. #246
    Junior Member FXOpen Trader's Avatar
    Join Date
    Dec 2020
    Location
    Asia
    Posts
    2,040
    GBP/USD and EUR/GBP Aim More Upsides


    GBP/USD is eyeing an upside break above the 1.3820 resistance zone. EUR/GBP is rising and it could gain pace if it clears the 0.8465 resistance.

    Important Takeaways for GBP/USD and EUR/GBP

    • The British Pound was able to gain pace above the 1.3700 and 1.3750 resistance levels.
    • There is a key rising channel forming with support near 1.3760 on the hourly chart of GBP/USD.
    • EUR/GBP formed a support base above 0.8420 and started a fresh increase.
    • There was a break above a major bearish trend line with resistance near 0.8440 on the hourly chart.


    GBP/USD Technical Analysis

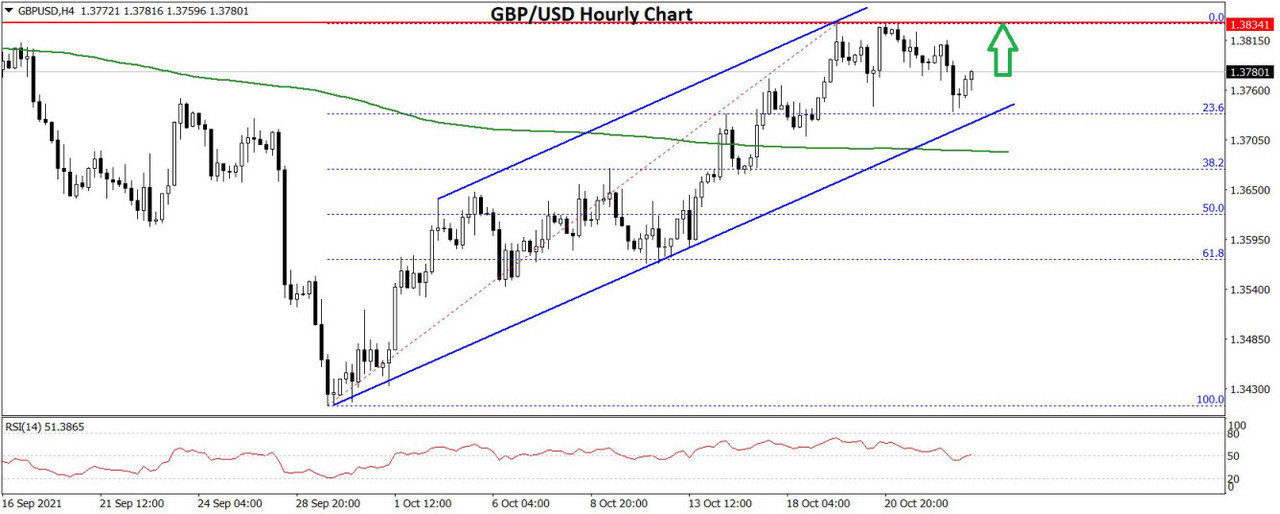
    The British Pound started a major increase from the 1.3440 support zone against the US Dollar. The GBP/USD pair traded above the 1.3600 resistance zone to move into a positive zone.

    The pair even broke the 1.3750 resistance zone and settled above the 50 hourly simple moving average. It even spiked above 1.3800 and traded as high as 1.3835. GBP/USD is now correcting gains and trading below 1.3800.

    GBP/USD Hourly Chart


    An immediate support is near the 1.3760 level. It is near the 23.6% Fib retracement level of the upward move from the 1.3413 swing low to 1.3835 high.

    It is now consolidating near the 1.3780 level. There is also a key rising channel forming with support near 1.3760 on the hourly chart of GBP/USD. A downside break below the channel support might even push the pair below the 1.3700 support zone.

    The next major support is near the 1.3650 level. The 50% Fib retracement level of the upward move from the 1.3413 swing low to 1.3835 high is also near the 1.3650 zone.

    Any more downsides might call for a move towards the 1.3600 level. On the upside, the pair is facing resistance near 1.3820. If there is an upside break above the 1.3820 resistance, the price could surpass 1.3850.

    The next main resistance is near the 1.3920 zone, above which the pair could rise towards the 1.4000 level in the near term.

    Read Full on FXOpen Company Blog...

  7. #247
    Junior Member FXOpen Trader's Avatar
    Join Date
    Dec 2020
    Location
    Asia
    Posts
    2,040
    EURUSD Volatility Expected to Increase As ECB's Decision Looms


    The EURUSD has been trading in relatively tight ranges recently despite important economic data releases. The pair has found strong support at the 1.16 level as buyers stepped in on every move below. However, the bounces have been shallow and with little or no follow-through.

    This week, the price action on the EURUSD is expected to increase dramatically as investors prepare for two crucial events that will impact the currency pair: the European Central Bank meeting, and the Federal Reserve of the United States (FED) meeting next week.


    The Fed to Officially Announce Tapering

    The Fed is set to officially announce the tapering of its asset purchases at next week's meeting. Last Friday, the Fed's chair said he believed that the time for tapering had come — but the EURUSD did not react, perhaps because the news came late on a Friday afternoon.

    The statement is clearly hawkish for the dollar, and it should weigh on the EURUSD pair, especially since the ECB considers an opposite strategy. It will not taper yet; thus, the two monetary policies diverge.

    The EURUSD is the most popular currency pair on the FX dashboard and one that sets the course for the dollar index. Despite finding buyers below 1.16 in the last weeks, the bias remains bearish heading into the two central banks meetings.

    On Thursday, the focus sits with the ECB press conference and its staff's economic projections. As always, projections for inflation expectations are key for the euro. On Friday, investors will start to prepare for the Fed meeting scheduled for next week, and if the ECB keeps its dovish bias, the chances are that the EURUSD will test its recent lows around the 1.15 level.

    FXOpen Blog

  8. #248
    Junior Member FXOpen Trader's Avatar
    Join Date
    Dec 2020
    Location
    Asia
    Posts
    2,040
    BTCUSD and XRPUSD Technical Analysis – 26th OCT, 2021


    BTCUSD – Rising Uptrend Channel Above $60000

    Bitcoin continues to consolidate its gains after touching an all-time high of $66967 last week. The price of bitcoin is now moving in a rising uptrend channel, indicating more upsides in the coming days.

    Bitcoin is holding above the 100 hourly simple and exponential moving averages. The bearish correction that we saw last week after the price of BTC crossed $65000 seems to be well-supported above $60000.

    Bitcoin has started its next leg of upward movement and is now expected to cross the 63500 handle in the US trading session today.

    The short- to medium-term outlook for bitcoin remains bullish, and a rally is expected towards $65000 levels.

    • Bitcoin recovered from its losses last week and is now trading above its support levels of $62061
    • High relative strength index indicates a strong positive momentum in the short-term range
    • The price is now trading above its pivot level of $62404
    • All the moving averages are giving a STRONG BUY signal at current market level of $62972


    Bitcoin Fresh Rally Towards $64000 Confirmed


    BTCUSD is oscillating between 63271 and 62213, and needs to clear its immediate resistance levels of 63750. The price of BTCUSD has just cleared its Fibonacci resistance level of $62714 and classic resistance level of $62900 in the European trading session.

    In the last 24hrs, BTCUSD has gone UP by +0.36% with the price change of +225$, and has a 24hr trading volume of USD 32.248 billion.

    Bitcoin To Hit $80000 In 2021

    The price of bitcoin has appreciated by more than 50% since last month. Bitcoin was trading at $41034 on 29th Sep, 2021, and with the current market price of $62850, we can see an appreciation of 53%. Many companies have been adopting bitcoin leading to a higher demand for BTC on the cryptocurrency exchanges worldwide.

    Walmart is installing 200 bitcoin ATMs across the US. Bitcoin ETFs are gaining investor confidence. Twitter has enabled sending and receiving bitcoins via the Lightning network. Some crypto analysts say that the price of bitcoin will touch $80000 before the end of 2021.

    The Week Ahead

    The price of BTCUSD is holding above the important psychological level of $60000, and a positive momentum is observed in the short-term range. It is crucial for the price to hold above the $60000 handle for the next bitcoin rally towards $64000.

    This week, BTCUSD is expected to cross 63500 and aim for upsides of 64000 to 64500. The short-term bearish correction phase seems to have ended, and the dips remain well-supported above 61000.

    Both the medium-term and long-term outlook remain positive. Next week, we could witness BTC printing above the $64500 mark.

    Technical Indicators:

    Commodity channel index (14-day): at 28.51 indicating NEUTRAL

    Average true range (14-day): indicating less volatility

    Moving averages convergence divergence (12,26): at 190.30 indicating a BUY

    Relative strength index (14-day): at 57.96 indicating a BUY

    Read Full on FXOpen Company Blog...

  9. #249
    Junior Member FXOpen Trader's Avatar
    Join Date
    Dec 2020
    Location
    Asia
    Posts
    2,040
    EUR/USD and EUR/JPY: Euro Remains At Risk


    EUR/USD failed to recover and declined below the 1.1620 support. EUR/JPY is facing a major resistance near the 132.50 and 132.65 levels.

    Important Takeaways for EUR/USD and EUR/JPY

    • The Euro gained bearish momentum below 1.1620 and 1.1600.
    • There was a break below an ascending channel with support near 1.1600 on the hourly chart.
    • EUR/JPY is attempting a recovery wave above the 132.30 resistance level.
    • There is a key bearish trend line forming with resistance near 132.65 on the hourly chart.


    EUR/USD Technical Analysis

    The Euro started another decline after it struggled to clear the 1.1665 resistance against the US Dollar. The EUR/USD pair broke the 1.1620 support zone to move into a bearish zone.

    The pair even traded below the 1.1600 support and settled below the 50 hourly simple moving average. A low was formed near 1.1585 on FXOpen and the pair is now correcting losses. It is currently facing resistance near the 1.1600 level.

    Read Full on FXOpen Company Blog...

  10. #250
    Junior Member FXOpen Trader's Avatar
    Join Date
    Dec 2020
    Location
    Asia
    Posts
    2,040
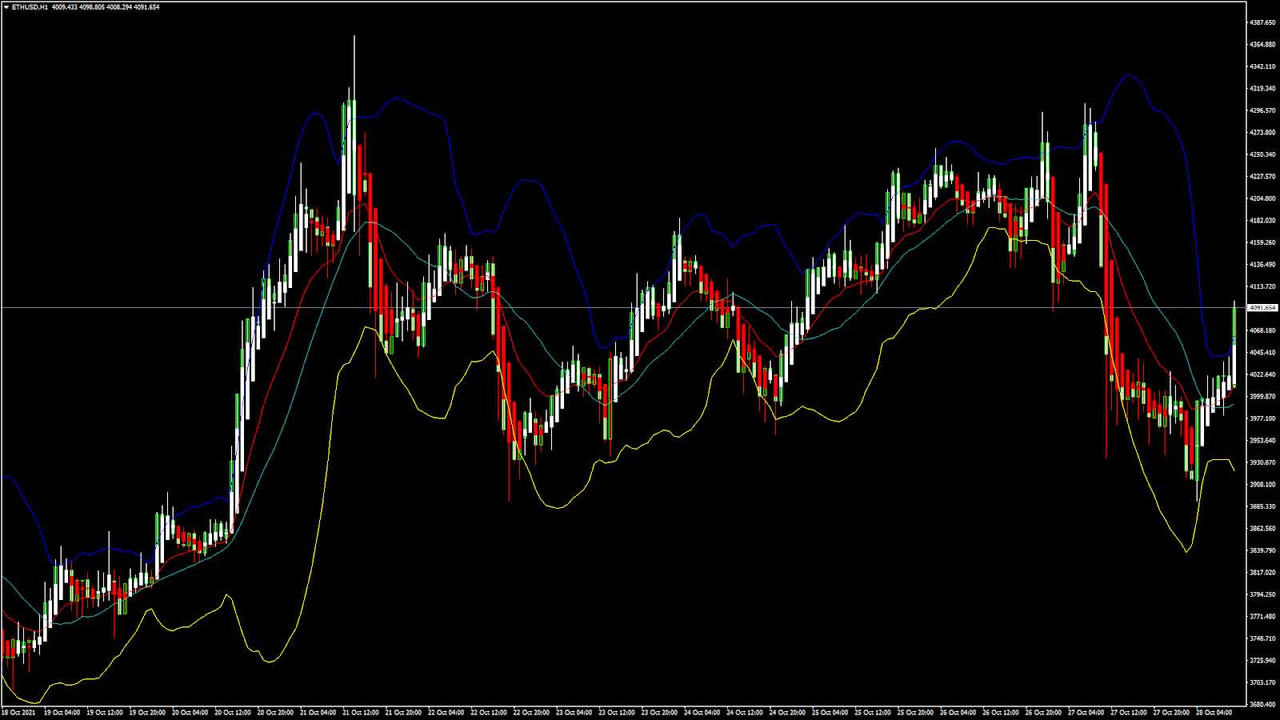
    ETHUSD and LTCUSD Technical Analysis – 28th OCT, 2021


    ETHUSD Consolidating Towards $4000

    Ethereum had a major bearish correction yesterday breaking down below the $4000 level, after which the price has stabilized and is moving to a consolidation phase towards the $4000 handle.

    ETHUSD touched an intraday high of $4298 on Wednesday, after which the prices saw a correction of more than 5%. The pair touched an intraday low of $3913 in today’s European trading session.

    ETH is now trading just above its pivot level of $4018 and Camarilla resistance level of $4016. ETH is gaining bullish uptrend today and is about to break its classic resistance level of $4057.

    Ether is expected to continue its uptrend move this week and reach the $4400 mark before this weekend. All the major technical indicators are giving a STRONG BUY signal.

    ETH is now trading just above its 100 hourly simple moving averages. Moving averages crossover has been detected, signaling a potential change in trend towards $4400.

    • Ethereum recovered its losses and continues to trade above the $4000 level
    • Short-term to medium-term outlooks remain bullish for ETHUSD
    • Average true range indicates less market volatility
    • Moving averages crossover pattern seen in 5 hourly MA


    Ether’s Straight Uptrend Towards $4400


    ETHUSD price declined heavily against the US Dollar yesterday, but the dips remained well supported pushing it back above the important psychological level of $4000. ETH price is now building a positive momentum, and we could see some fresh gains in the US trading session today.

    ETH is now facing its next major resistance levels of $4100 and $4179 after which the path towards $4400 will get cleared.

    The relative strength index is at 56 indicating more upside potential for ETHUSD in the coming days. ETH has gained 2.82% with a price change of +$113.79 in the past 24hrs and has a trading volume of 23.695 Billion USD.

    Ethereum To Hit $6000 in 2021

    The Ethereum blockchain is moving towards Ethereum 2.0, which is proposed to be a much greener and faster version of the current system. The Altair upgrade to Beacon chain will likely push the prices of ETHUSD further up.

    Traders are now waiting for the release of the upgrade, and with renewed buying pressure the prices of Ethereum are expected to touch $6000 before the end of this year.

    The Week Ahead

    Ethereum price is moving in an uptrend from the starting of this month and the trend is expected to continue this week. We could witness a short-selling in the ETH for some time below the sub$4000 level as seen yesterday, but the dips will remain well supported marking the resumption of the bullish trend.

    We have seen moving averages crossover patterns for 5 hourly MA, and also for 5 day MA suggesting that both in the short- to medium-range the bullish outlook will continue.

    The price of ETHUSD has already broken 200 hourly simple and exponential moving averages and is on its way towards the $4400 handle this week.

    Technical Indicators:

    Average directional change (14-day): at 45.57 indicating a BUY

    Bull/Bear power (13-day): at 221.075 indicating a BUY

    Ultimate oscillator: at 62.62 indicating a BUY

    Commodity channel index (14-day): at 282.79 indicating OVERBOUGHT levels

    Read Full on FXOpen Company Blog...

Page 25 of 164 FirstFirst ... 15 23 24 25 26 27 35 75 125 ... LastLast

Bookmarks

Posting Permissions

  • You may not post new threads
  • You may not post replies
  • You may not post attachments
  • You may not edit your posts
  •