
 LinkBack URL
 About LinkBacks


AUD/USD and NZD/USD Aim More Upsides
AUD/USD started a fresh increase above the 0.7500 resistance zone. NZD/USD also climbed higher and it might aim more upsides towards 0.7250.
Important Takeaways for AUD/USD and NZD/USD
- The Aussie Dollar started a steady increase above the 0.7480 hurdle against the US Dollar.
- There is a key bullish trend line forming with support near 0.7520 on the hourly chart of AUD/USD.
- NZD/USD also gained pace after it broke the 0.7150 resistance.
- There was a break above a major bearish trend line with resistance near 0.7175 on the hourly chart of NZD/USD.
AUD/USD Technical Analysis
The Aussie Dollar found formed a base above the 0.7450 level and started a fresh increase against the US Dollar. The AUD/USD pair broke the 0.7480 and 0.7500 resistance levels to move into a positive zone.
The pair even broke the 0.7520 and 0.7540 resistance levels. It settled above the 0.7500 level and the 50 hourly simple moving average. A high was formed near 0.7554 on FXOpen and the pair is now consolidating gains.
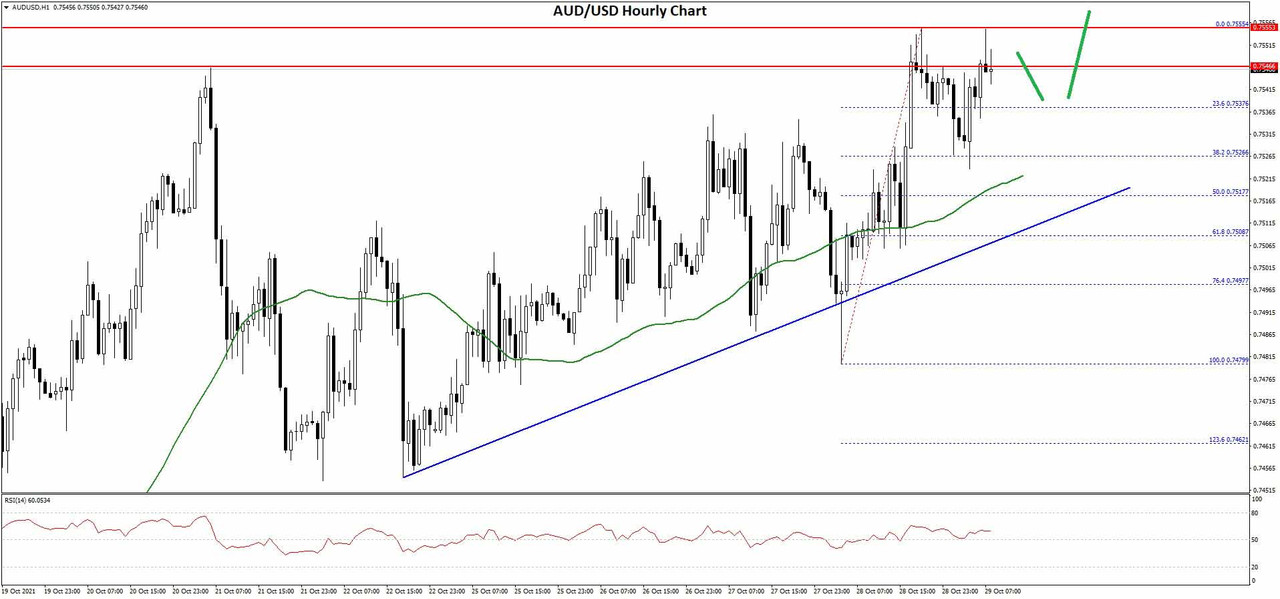
AUD/USD Hourly Chart
It traded below the 23.6% Fib retracement level of the recent wave from the 0.7479 swing low to 0.7554 high. An initial support on the downside is near the 0.7525 level.
The next major support is near the 0.7515 level. It is close to the 50% Fib retracement level of the recent wave from the 0.7479 swing low to 0.7554 high. There is also a key bullish trend line forming with support near 0.7520 on the hourly chart of AUD/USD.
If there is a downside break below the 0.7515 support, the pair could extend its decline towards the 0.7480 level. An immediate resistance is near the 0.7550 level.
The next major resistance is near the 0.7580 level. A close above the 0.7580 level could start a steady increase in the near term. The next major resistance could be 0.7650.
Read Full on FXOpen Company Blog...


 Reply With Quote


Bookmarks