
 LinkBack URL
 About LinkBacks


BTCUSD and XRPUSD Technical Analysis 22nd FEB 2022
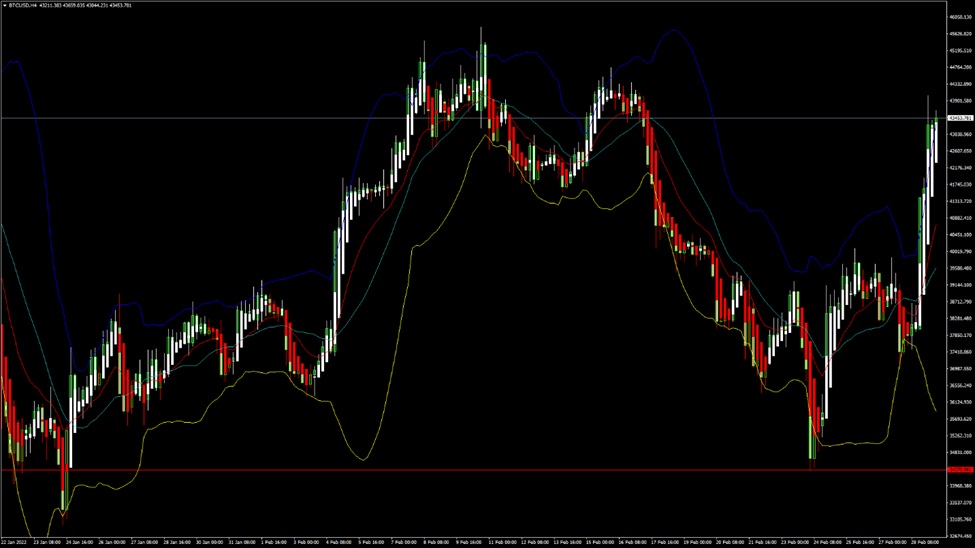
BTCUSD: Bearish Engulfing Pattern Below $44,300
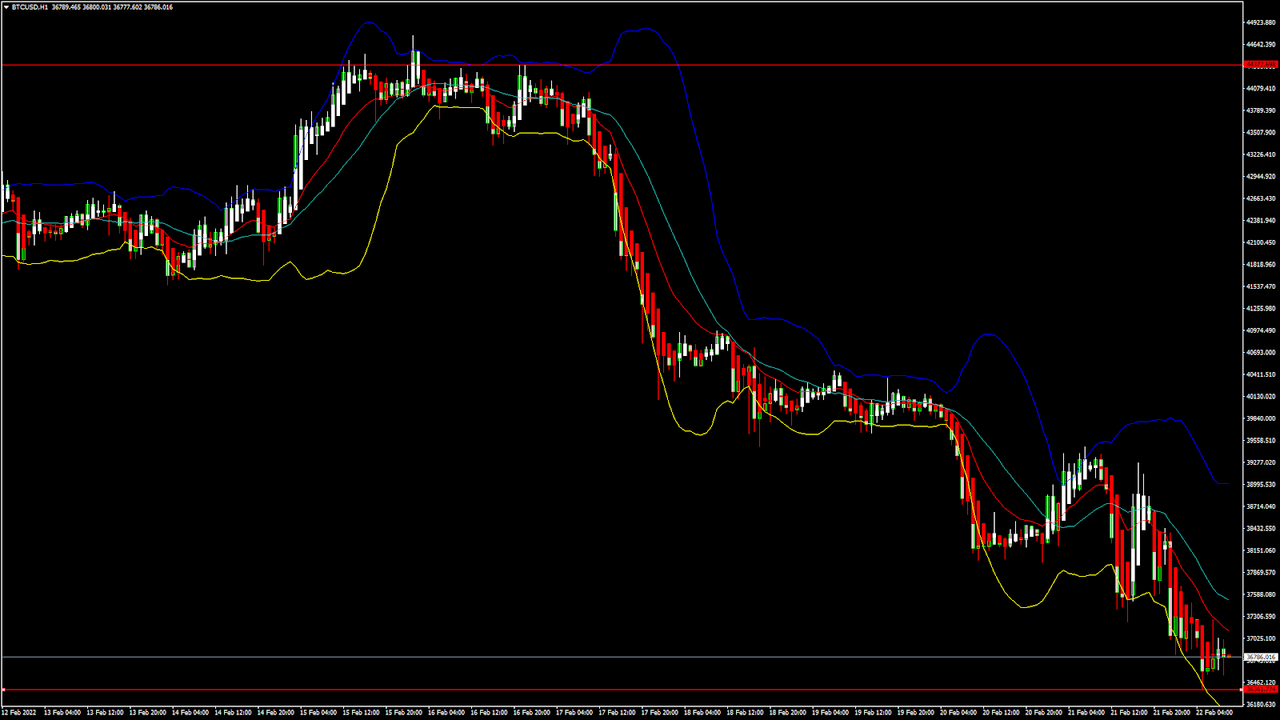
Bitcoin was unable to sustain its bullish momentum against the US dollar and started declining after touching a high of $44,740 on 16th February.
The propagation of the bearish trend continues with the prices of bitcoin trading below the $37,000 mark in the European trading session today. The drop is due to the fresh concerns of the war between Russia and Ukraine, and the flight towards safe haven assets like the US dollar.
We can clearly see a bearish engulfing pattern below the $44,300 handle, which is a bearish reversal pattern because it signifies the end of an uptrend and a shift towards a downtrend.
The Stoch and Williams percent range are indicating OVERBOUGHT levels which means that in the immediate short-term, a decline in the prices is expected.
The relative strength index is at 38 indicating a WEAKER demand for bitcoin at the current market levels.
Bitcoin is now moving below its 100 hourly simple moving average, and below its 200 hourly exponential moving average.
All of the major technical indicators are giving a STRONG SELL signal, and in the immediate short-term, we can expect targets of $35,000 and $33,000.
The average true range is indicating a lesser market volatility with a strong bearish momentum.
- A bearish reversal below $44,300 is seen in bitcoin
- The Williams percent range is indicating OVERBOUGHT levels
- The price is now trading just below its pivot level of $36,876
- All of the moving averages are giving a STRONG SELL market signal
Bitcoin: Bearish Reversal Seen Below $44,300
Bitcoin continues to move in a strong bearish momentum following a baseline progression towards $37,000.
In the immediate short-term we are expecting a range-bound movement for bitcoin between the levels of $36,000 and $37,500, as it is due to enter into a consolidation phase now.
On-chain metrics are also indicating a bearish outlook for bitcoin, with many of the short-term holders liquidating their holdings.
The immediate short-term outlook for bitcoin is strongly bearish; the medium-term outlook is neutral; and the long-term outlook remains bullish.
We have detected an MA 5 crossover pattern at the level of $36,792, which means that after touching these levels the prices of bitcoin are expected to bounce upwards,
The price of BTCUSD is now facing its classic support level of $36,343, and Fibonacci support level of $36,736, after which the path towards $35,000 will get cleared.
We can see that the daily RSI is also printing at 34 which indicates that in the medium-term prices are expected to decline further.
In the last 24hrs BTCUSD has gone down by -6.33% by 2,488$, and has a 24hr trading volume of USD 32.682 billion. We can see an increase of 69.19% in the trading volume as compared to yesterday, due to increased selling pressure in the global cryptocurrency markets.
The Week Ahead
The prices of bitcoin are due to enter a consolidation phase above the level of $36,000. We can see some range-bound movement between $36,000 and $38,000.
The price of bitcoin is still under pressure as the Russia-Ukraine crisis deepens. Both the short-term and the long-term holders of bitcoin are selling, which is pulling the price down.
In the immediate short-term this week, bitcoins bearish momentum is expected to continue pushing its levels below the $36,000 handle.
In the event of a pullback, the upside projection is at the 50-day SMA of $38,179.
The price of BTCUSD will need to remain above the important support level of $35,000 this week.
The weekly outlook is projected at $35,000 with a consolidation zone of $36,000.
Technical Indicators:
The relative strength index (14-day): at 34.53 indicating a SELL
The average directional change (14-day): at 30.37 indicating a SELL
The rate of price change: at -16.29 indicating a SELL
The moving averages convergence divergence (12,26): at -807.20 indicating a SELL
Read Full on FXOpen Company Blog...


 Reply With Quote


Bookmarks