Page 34 of 164 FirstFirst ... 24 32 33 34 35 36 44 84 134 ... LastLast
Results 331 to 340 of 1639

Daily Market Analysis By FXOpen

This is a discussion on Daily Market Analysis By FXOpen within the Analytics and News forums, part of the Trading Forum category; ETHUSD and LTCUSD Technical Analysis – 27th JAN, 2022 ETHUSD – Bearish Engulfing Pattern Below $2700 Ethereum started a major ...


  1. #331
    Junior Member FXOpen Trader's Avatar
    Join Date
    Dec 2020
    Location
    Asia
    Posts
    2,040
    ETHUSD and LTCUSD Technical Analysis – 27th JAN, 2022


    ETHUSD – Bearish Engulfing Pattern Below $2700

    Ethereum started a major bearish correction from its highs of 3268 reached on 20th January. We can see that after a mild bullish correction wave, the bearish trend is back which continues to push down the prices of Ethereum below the $2500 handle in the European Trading session today.

    ETHUSD touched an intraday low of 2355 in the Asian trading session today after which we can see some consolidation in its prices above the $2300 handle.

    We can clearly see a Bearish Engulfing Pattern below the $2700 handle which is a bearish pattern and signifies a potential shift in the market direction towards a Downtrend.

    ETH is now trading just above its Pivot levels of 2403 and is moving in a Consolidation Channel. The price of ETHUSD is now testing its Classic support levels of 2358 and Fibonacci support levels of 2392 after which the path towards 2200 will get cleared.

    Relative Strength Index is at 41 indicating a WEAK demand for the Ethereum and the continuation of the Selling pressure in the markets.

    Most of the of the Technical indicators are giving a STRONG SELL Signal.

    ETH is now trading Below its both the 100 Hourly and 200 Hourly Simple Moving Averages.

    • Ether Bearish momentum is seen below the $2700 mark.
    • Short-term range appears to be BEARISH.
    • Ultimate Oscillator is indicating a NEUTRAL market.
    • Average True Range is indicating LESS Market Volatility.


    Ether Bearish Momentum seen Below $2700


    ETHUSD continues to move into a Mild Bearish channel below the $2700 handle in the European Trading session today.

    Average Directional Change is indicating a NEUTRAL market, and the overall sentiment is shifted towards the Bearish market.

    The heavy selling pressure in Ethereum and its subsequent liquidation by the long-term investors is due to the fear of a Russian Attack on Ukraine and its broader implications on the Crypto markets.

    We are now looking at the key support levels of $2300 which if broken would push down the prices of Ethereum towards the $2200 handle.

    ETH has lost -2.71% with a price change of -66.95$ in the past 24hrs and has a trading volume of 22.749 Billion USD.

    We can see an Increase of 42.78% in the total trading volume in last 24 hrs. which is due to the heavy selling seen after the bullish momentum failed.

    The Week Ahead

    Ethereum is now approaching its important support levels of $2300 which will decide whether we will see a Bullish reversal in the markets.

    If the prices of ETHUSD continue to remain above the $2300 handle as we can see today, it will signify a Bullish reversal with an Upside target of $2500 to $2800 in the next week.

    The immediate short-term outlook for the Ether has turned as BEARISH, the Medium term outlook is NEUTRAL, and the Long term outlook for Ether is BULLISH towards the $3000 handle.

    We have detected an MA 5 crossover pattern above 2398 levels which signifies a Bullish Trend reversal in the short term.

    In this week Ether is expected to move in a range between the $2300 and $2600 and in the next week Ether is expected to trade at levels above $2600.

    Technical Indicators:

    Rate of Price Change: It is at -7.782 indicating a SELL.

    STOCH (9,6): It is at 23.42 indicating a SELL.

    Moving Averages Convergence Divergence (12,26): It is at -24.08 indicating a SELL.

    STOCHRSI (14): It is at 25.04 indicating a SELL.

    Read Full on FXOpen Company Blog...

  2. #332
    Junior Member FXOpen Trader's Avatar
    Join Date
    Dec 2020
    Location
    Asia
    Posts
    2,040
    Gold Price Nosedives While Crude Oil Price Extends Rally


    Gold price started a fresh decline from the $1,850 resistance zone. Crude oil price is rising and might continue to gain momentum above $87.00.

    Important Takeaways for Gold and Oil

    • Gold price started a major decline from the $1,850 against the US Dollar.
    • There was a break below a key contracting triangle with support near $1,840 on the hourly chart of gold.
    • Crude oil price started a steady increase after it cleared the $85.00 resistance.
    • There is a major bullish trend line forming with support near $86.20 on the hourly chart of XTI/USD.


    Gold Price Technical Analysis

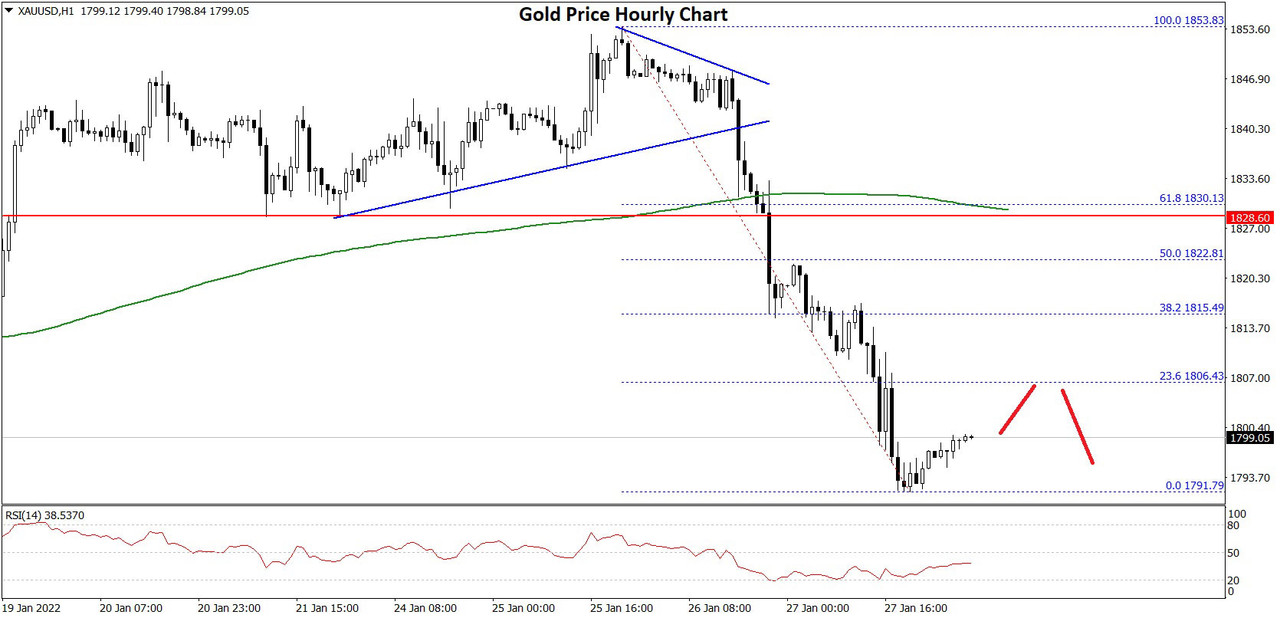
    Gold price attempted a key upside break above $1,850 against the US Dollar. However, the price failed to gain strength above $1,850 and started a major decline.

    There was a clear move below the $1,820 level and the 50 hourly simple moving average. Besides, there was a break below a key contracting triangle with support near $1,840 on the hourly chart of gold.

    Gold Price Hourly Chart


    The price even declined below the $1,800 level and settled below the 50 hourly simple moving average. A low is formed near $1,791 and is currently consolidating losses. On the upside, the price is facing resistance near the $1,800 level.

    The first major resistance is near the $1,805 level. It is near the 23.6% Fib retracement level of the downward move from the $1,853 swing high to $1,791 low.

    The main resistance is now forming near the $1,820 level. The 50% Fib retracement level of the downward move from the $1,853 swing high to $1,791 low is also near the $1,820 level. A close above the $1,820 level could open the doors for a steady increase towards $1,840.

    The next major resistance sits near the $1,850 level. On the downside, an initial support is near the $1,790 level. The first major support is near the $1,780 level.

    A downside break below the $1,780 support zone may possibly spark a steady decline. In the stated case, the price could test the $1,750 support.

    Read Full on FXOpen Company Blog...

  3. #333
    Junior Member FXOpen Trader's Avatar
    Join Date
    Dec 2020
    Location
    Asia
    Posts
    2,040
    GBP/USD and USD/CAD: Dollar Gains Traction


    GBP/USD started a major decline below the 1.3500 support. USD/CAD gained bullish momentum for a move above the 1.2700 level.

    Important Takeaways for GBP/USD and USD/CAD

    • The British Pound started a fresh decline from the 1.3650 resistance zone.
    • There is a key bearish trend line forming with resistance near 1.3430 on the hourly chart of GBP/USD.
    • USD/CAD started a fresh increase from well below the 1.2500 zone.
    • There is a major bullish trend line forming with support near 1.2660 on the hourly chart.


    GBP/USD Technical Analysis

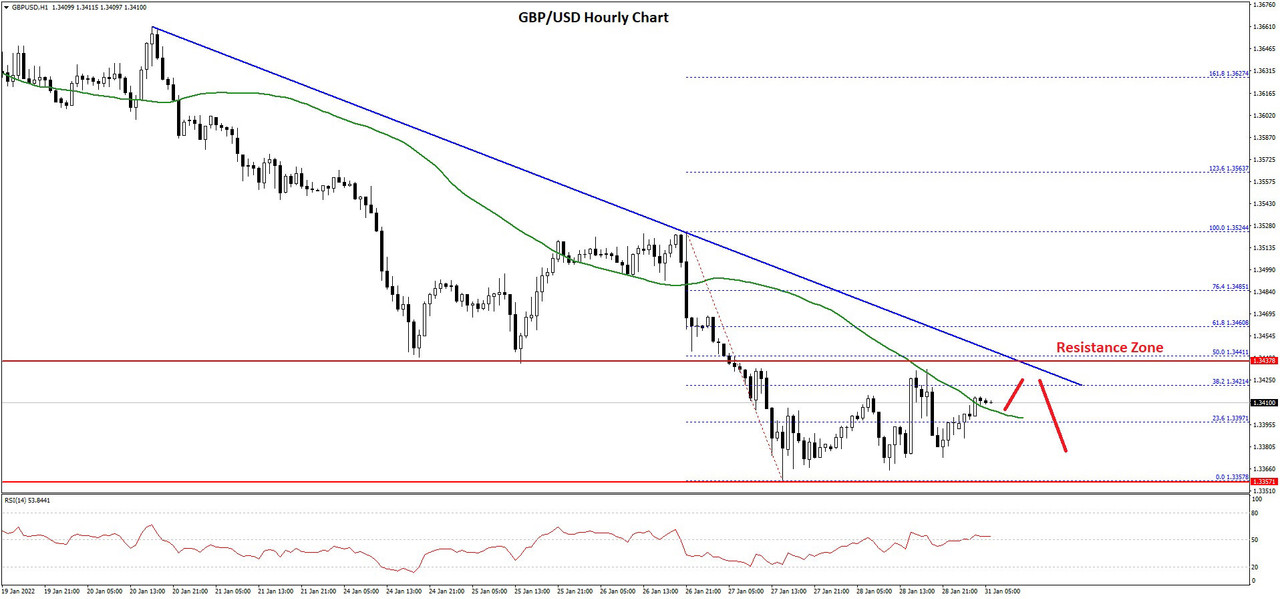
    After struggling to clear the 1.3660 resistance zone, the British Pound found started a fresh decline against the US Dollar. GBP/USD traded below the 1.3550 support level to move into a bearish zone.

    The bears gained strength for a move below the 1.3500 level and the 50 hourly simple moving average. The pair even spiked below the 1.3400 level and traded as low as 1.3357 on FXOpen. It is now consolidating above the 1.3380 level.

    GBP/USD Hourly Chart


    An immediate resistance is near the 1.3420 level. It is near the 38.2% Fib retracement level of the downward move from the 1.3524 swing high to 1.3357 low.

    The first major resistance is near the 1.3440 level. There is also a key bearish trend line forming with resistance near 1.3430 on the hourly chart of GBP/USD. The trend line is near the 50% Fib retracement level of the downward move from the 1.3524 swing high to 1.3357 low.

    If there is an upside break above the 1.3440 zone, the pair could rise towards 1.3500. The next key resistance could be 1.3550, above which the pair could gain strength.

    On the downside, the first support is near the 1.3380 area. The first major support is near the 1.3350 level. If there is a break below 1.3350, the pair could extend its decline. The next key support is near the 1.3250 level. Any more losses might call for a test of the 1.3200 support.

    Read Full on FXOpen Company Blog...

  4. #334
    Junior Member FXOpen Trader's Avatar
    Join Date
    Dec 2020
    Location
    Asia
    Posts
    2,040
    This Week’s Most Anticipated Central Banks’ Decisions


    The month's last trading day is here, and no important economic events are due. However, the week ahead is full of macro-events to move financial markets, such as three central banks announcing their policy decisions, and the NFP report scheduled for next Friday.

    The Australian dollar traders are on high alert since the Reserve Bank of Australia is scheduled to release its monetary policy tomorrow. Markets have priced in several hikes from the RBA.

    However, the central bank's narrative was rather dovish, as the Australian economy is affected by the Chinese zero-covid policy. Therefore, the forward guidance from the RBA is more important for the Australian dollar than the actual interest rate decision.


    While the RBA is not expected to move the cash rate, the Bank of England will likely hike at its next Thursday meeting. A 25 basis points rate hike is priced in, and so the British pound traders are on the lookout for the Bank of England's guidance regarding future rate hikes.

    On the same day as the Bank of England, the European Central Bank will hold its press conference and present its own monetary policy statement. This is one central bank in no hurry to raise the rates, which is extraordinary to consider in a rising inflation environment; the ECB holds the deposit facility rate below zero.

    Big Tech Giants to Report Quarterly Earnings This Week

    The week ahead is full of major US corporations presenting their Q4 2021 earnings (with the exception of Qualcomm that will present its Q1 2021 report). Here are some names to consider as their earnings may trigger important swings in the equity market:

    • Alphabet – January 31, 2022
    • Facebook –February 1, 2022
    • Amazon – February 2, 2022
    • ExxonMobil – February 1, 2022
    • Eli Lilly – February 3, 2022
    • Qualcomm – Q1 2021 earnings – February 1, 2022
    • Honeywell – February 2, 2022
    • Ford – February 3, 2022


    All in all, volatility is set to rise this week as momentum builds up for the NFP report release on Friday. Further improvements in the unemployment rate should make the Fed set foot on the path of more aggressive tightening.

    FXOpen Blog

  5. #335
    Junior Member FXOpen Trader's Avatar
    Join Date
    Dec 2020
    Location
    Asia
    Posts
    2,040
    BTCUSD and XRPUSD Technical Analysis – 01st FEB 2022


    BTCUSD: Double Bottom Pattern Above $35,500

    Bitcoin continues its bullish momentum this week having crossed the $38,000 handle in the Asian trading session today.

    The prices of bitcoin are surging due to the increase in trading volumes and a renewed interest of global investors to buy bitcoin at lower levels.

    BTCUSD touched an intraday high of $38,741 in the early Asian trading session, and an intraday low of $38,185.

    We can clearly see a double bottom pattern above the $35,500 handle which is a bullish reversal pattern because it signifies the end of a downtrend and a shift towards an uptrend.

    Stoch and Williams Percent Range are indicating an OVERBOUGHT level which means that in the immediate short-term, a decline in the prices is expected.

    The relative strength index is at 61 indicating a STRONG demand for bitcoin at the current market levels.

    Bitcoin is now moving above its 100 hourly simple moving average and below its 200 hourly exponential moving average.

    The average true range is indicating a lesser market volatility with a bullish zone formation.

    • Bitcoin bullish momentum continues above $35,500
    • StochRSI is indicating a NEUTRAL level
    • The price is now trading just above its pivot level of $38,420
    • All of the moving averages are giving a STRONG BUY market signal


    Bitcoin: Bullish Momentum Above $35,500 Confirmed


    Bitcoin continues to gain traction in the European trading session today and is trading above the $38,000 handle.

    The immediate short-term outlook for bitcoin is bullish, the medium-term outlook is neutral, and the long-term outlook remains strongly bullish.

    The daily RSI is printing at 40 which means that long-term investors are still not coming into the markets.

    All of the major technical indicators are giving a STRONG BUY signal, which means that in the immediate short-term, we should be expecting targets of $40k and $42k.

    The price of BTCUSD is now facing its classic resistance level of $38,529 and Fibonacci resistance level of $38,588, after which the path towards $40k will get cleared.

    In the last 24hrs, BTCUSD has gone UP by 3.75% with a price change of $1,392, and has a 24hr trading volume of USD 20.355 billion. We can see an increase of 23.68% in the trading volume as compared to yesterday.

    The total market capitalization of bitcoin still remains below the $800 billion mark and is currently at 730.045 billion USD.

    The Week Ahead

    The prices of bitcoin are ranging in between the levels of $38,900 and $35,500, and are due for an upwards correction towards the $40,000 handle.

    Many analysts believe that the recent decline happened due to the CME Futures gap.


    Bitcoin’s bullish momentum is expected to continue pushing its levels past the $40,000 handle this week, and the prices of BTCUSD will need to remain above the important support level of $37,000.

    Next week, we can expect more upsides in the range of $42,000 to $45,000.

    Technical Indicators:

    Commodity channel index (14-day): at 67.48 indicating a BUY

    Average directional change (14-day): at 43.04 indicating a BUY

    Rate of price change: at 0.255 indicating a BUY

    Moving averages convergence divergence (12,26): at 179.60 indicating a BUY

    Read Full on FXOpen Company Blog...

  6. #336
    Junior Member FXOpen Trader's Avatar
    Join Date
    Dec 2020
    Location
    Asia
    Posts
    2,040
    EUR/USD Gains Momentum, USD/CHF Signals Downside Break


    EUR/USD started a recovery wave above 1.1220 and 1.1240. USD/CHF is declining and trading below the 0.9250 support zone.

    Important Takeaways for EUR/USD and USD/CHF

    • The Euro started an upside correction above the 1.1250 resistance zone against the US Dollar.
    • There was a break above a major bearish trend line with resistance near 1.1230 on the hourly chart of EUR/USD.
    • USD/CHF started a downside correction from the 0.9340 resistance zone.
    • There was a break below a key bullish trend line with support near 0.9295 on the hourly chart.


    EUR/USD Technical Analysis


    The Euro started a major decline from well above the 1.1350 level against the US Dollar. The EUR/USD pair traded below the 1.1250 support zone to move into a bearish zone.

    The pair traded as low as 1.1121 on FXOpen and recently started an upside correction. The pair was able to clear the 1.1200 resistance zone and the 50 hourly simple moving average. There was a move above the 50% Fib retracement level of the key decline from the 1.1359 swing high to 1.1121 low.

    Besides, there was a break above a major bearish trend line with resistance near 1.1230 on the hourly chart of EUR/USD. It is now trading above 1.1250 level and the 61.8% Fib retracement level of the key decline from the 1.1359 swing high to 1.1121 low.

    On the upside, an initial resistance is near the 1.1300 level. The next major resistance is near the 1.1320 zone. A clear upside break above the 1.1320 zone could open the doors for a steady move.

    The next major resistance sits near the 1.1420 level. On the downside, an immediate support is near the 1.1240 level. The next major support is near the 1.1220 level. A downside break below the 1.1220 support could start another decline.

    Read Full on FXOpen Company Blog...

  7. #337
    Junior Member FXOpen Trader's Avatar
    Join Date
    Dec 2020
    Location
    Asia
    Posts
    2,040
    ETHUSD and LTCUSD Technical Analysis – 03rd FEB, 2022


    ETHUSD: Rounding Bottom Pattern Above $2,400

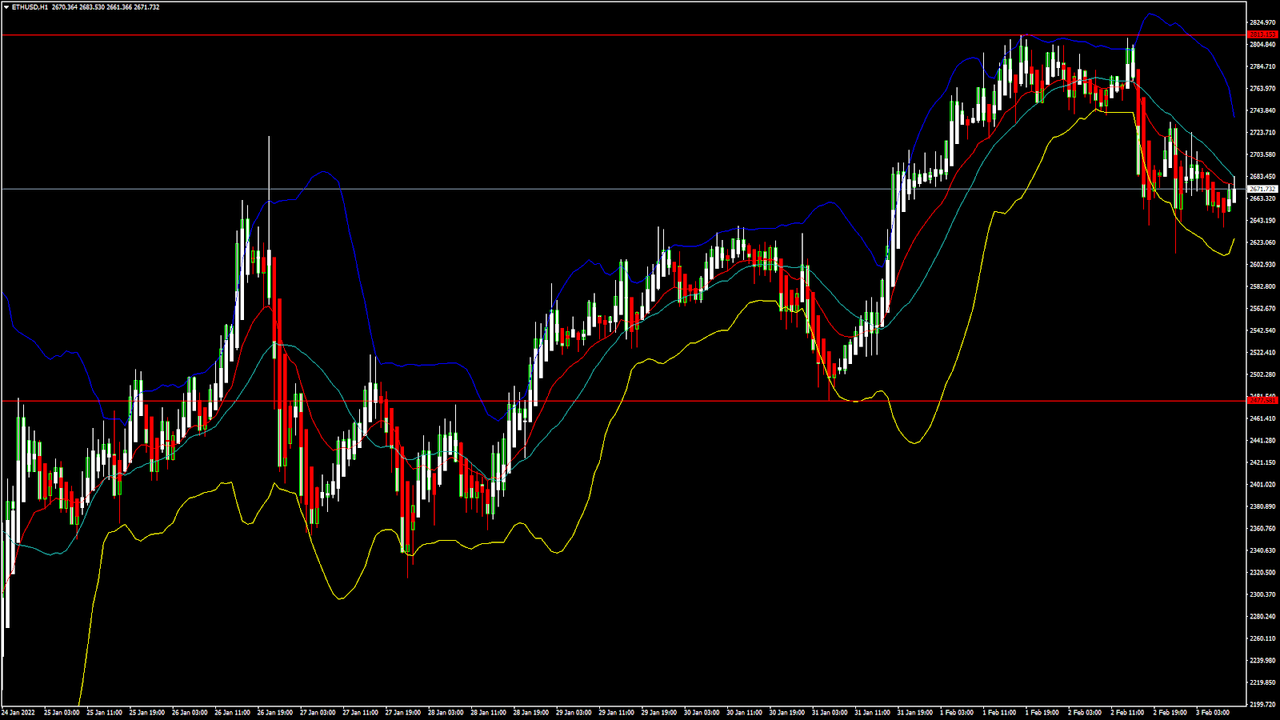
    Ethereum has finished its bearish momentum seen last week after it touched a low of $2,183 on 24th January. In today’s European trading session, we can observe a mildly bullish trend, which is keeping ETH prices above the $2,600 handle.

    ETHUSD continues to maintain its consolidation above $2,600, and is on a recovery mode towards its important resistance level of $3,000.

    We can clearly see a rounding bottom pattern above the $2,400 handle which is a bullish pattern and signifies a bullish continuation forming an uptrend.

    ETH is now trading just above its pivot level of $2,667, and is moving in a consolidation channel. The price of ETHUSD is now testing its classic resistance levels of $2,681, and Fibonacci resistance level of $2,689, after which the path towards $3,000 will get cleared.

    The relative strength index is at 44 indicating a NEUTRAL market sentiment which is expected to continue for some time due to the global risk scenario.

    Most of the technical indicators are giving a NEUTRAL market signal.

    ETH is now trading above its 100 hourly and 200 hourly simple moving averages.

    • Ether’s bullish momentum is seen above the $2400 mark
    • Short-term range appears to be mildly BULLISH
    • Williams percent range is indicating a NEUTRAL market
    • Average true range is indicating LESS market volatility


    Ether: Mild Bullish Momentum seen above $2,400


    In today’s European trading session, ETHUSD continues to move in a mildly bullish channel above the $2,400 handle.

    The commodity channel index is indicating a NEUTRAL market, and the overall sentiment has shifted towards the bullish market.

    The selling pressure has subsided, and a buying zone formation is seen which continues to push the prices upwards after every decline.

    We are looking at the important psychological resistance level of $3,000 which, if broken, will lead Ethereum into a strongly bullish momentum.

    The key support level to watch is $2,600, and as we can see that the prices continue to remain above these levels.

    ETH has lost -3.70% with a price change of -85.47$ in the past 24hrs, and has a trading volume of 14.684 billion USD.

    We can see an increase of 17.17% in the total trading volume in the last 24 hrs, which appears to be normal.

    The Week Ahead

    Ethereum is now on track towards recovery after the recent decline last week. We saw ETHUSD touching a high of $3,268 on 20th January, and if the current bullish momentum continues, we could see these levels again the next week.

    For now, the main contention is the falling interest of the global investors and the panic selling that is seen due to the tension at the Russia and Ukraine border.

    If the prices of ETHUSD continue to remain above the $2,600 handle, as we have seen today, it will confirm the bullish channel formation with an upside target of $2,900 to $3,200 the next week.

    The immediate short-term outlook for Ether has turned NEUTRAL, the medium-term outlook is mildly BULLISH, and the long-term outlook is BULLISH towards the $3,500 handle.

    We have detected an MA 10 and MA 5 crossover pattern above $2,664, which signifies a bullish trend reversal in the short-term.

    This week, Ether is expected to move in a range between $2,600 and $2,800; the next week, Ether is expected to trade at levels above $2,800.

    Technical Indicators:

    Ultimate oscillator: at 51.60 indicating a BUY

    Average directional change (14-day): at 23.93 indicating a BUY

    Highs/lows(14-day): at 0.00 indicating a NEUTRAL market

    StochRSI (14-day): at 71.08 indicating a BUY

    Read Full on FXOpen Company Blog...

  8. #338
    Junior Member FXOpen Trader's Avatar
    Join Date
    Dec 2020
    Location
    Asia
    Posts
    2,040
    AUD/USD and NZD/USD Target More Upsides


    AUD/USD started a fresh increase from the 0.6965 zone. NZD/USD is also rising and there was a clear move above the 0.6650 resistance.

    Important Takeaways for AUD/USD and NZD/USD

    • The Aussie Dollar started a fresh increase after it cleared 0.7000 against the US Dollar.
    • There was a break above a couple of bullish patterns near 0.7070 and 0.7130 on the hourly chart of AUD/USD.
    • NZD/USD also climbed higher after forming a base above the 0.6540 level.
    • There is a major bullish trend line forming with support near 0.6650 on the hourly chart of NZD/USD.


    AUD/USD Technical Analysis


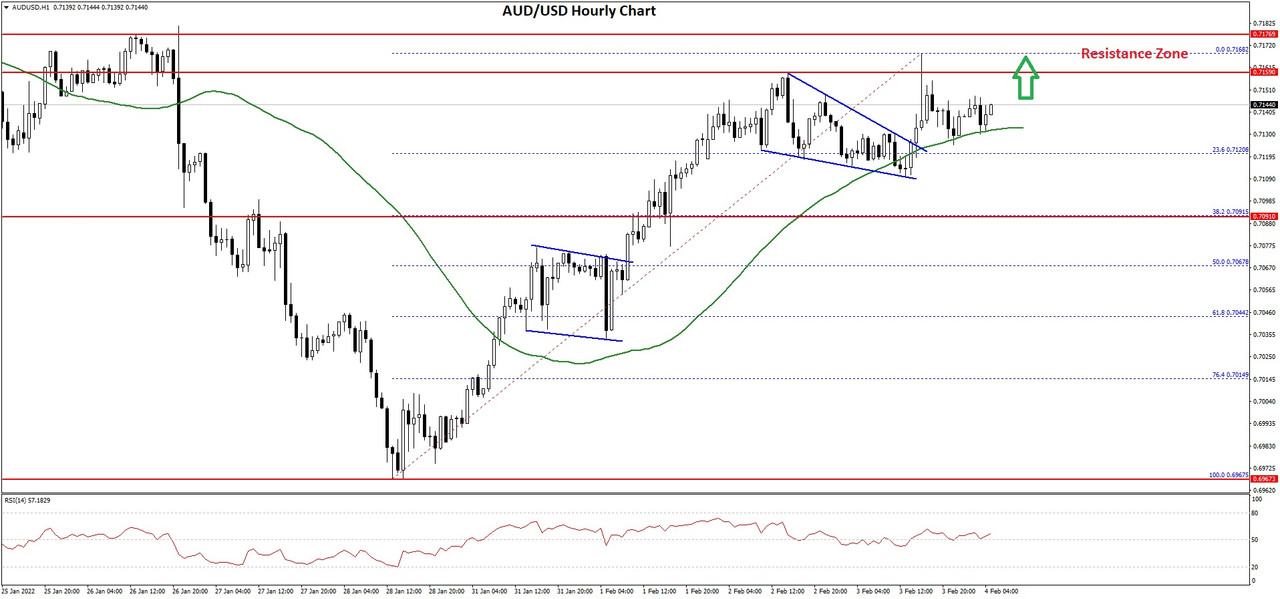
    The Aussie Dollar found support near the 0.6965 zone against the US Dollar. The AUD/USD pair traded as low as 0.6967 on FXOpen before it started a fresh increase.

    There was a clear move above the 0.7000 and 0.7020 resistance levels. Besides, there was a break above a couple of bullish patterns near 0.7070 and 0.7130 on the hourly chart of AUD/USD. The pair surged above the 0.7150 level and the 50 hourly simple moving average.

    AUD/USD Hourly Chart

    It traded as high as 0.7168 and currently consolidating gains. On the downside, an initial support is near the 0.7130 level and the 50 hourly simple moving average.

    The next support is near the 23.6% Fib retracement level of the upward move from the 0.6967 swing low to 0.7168 high. If there is a downside break below the 0.7120 support, the pair could extend its decline towards the 0.7070 level.

    The 50% Fib retracement level of the upward move from the 0.6967 swing low to 0.7168 high is near the 0.7070 level to provide support. Any more downsides might send the pair toward the 0.7000 level.

    On the upside, the pair is facing resistance near the 0.7170 level. The next major resistance is near the 0.7200 level. A close above the 0.7200 level could start a steady increase in the near term. The next major resistance could be 0.7320.

    Read Full on FXOpen Company Blog...

  9. #339
    Junior Member FXOpen Trader's Avatar
    Join Date
    Dec 2020
    Location
    Asia
    Posts
    2,040
    GBP/USD and GBP/JPY Could Resume Increase


    GBP/USD started a fresh increase from the 1.3350 zone and climbed above 1.3600. GBP/JPY is also rising, but it is facing resistance near 156.50.

    Important Takeaways for GBP/USD and GBP/JPY

    • The British Pound started a fresh increase above the 1.3400 and 1.3500 resistance levels against the US Dollar.
    • There was a break below a key bullish trend line with support near 1.3550 on the hourly chart of GBP/USD.
    • GBP/JPY also started a steady increase above the 155.00 and 155.50 resistance levels.
    • There is a major bullish trend line forming with support near 155.55 on the hourly chart.


    GBP/USD Technical Analysis

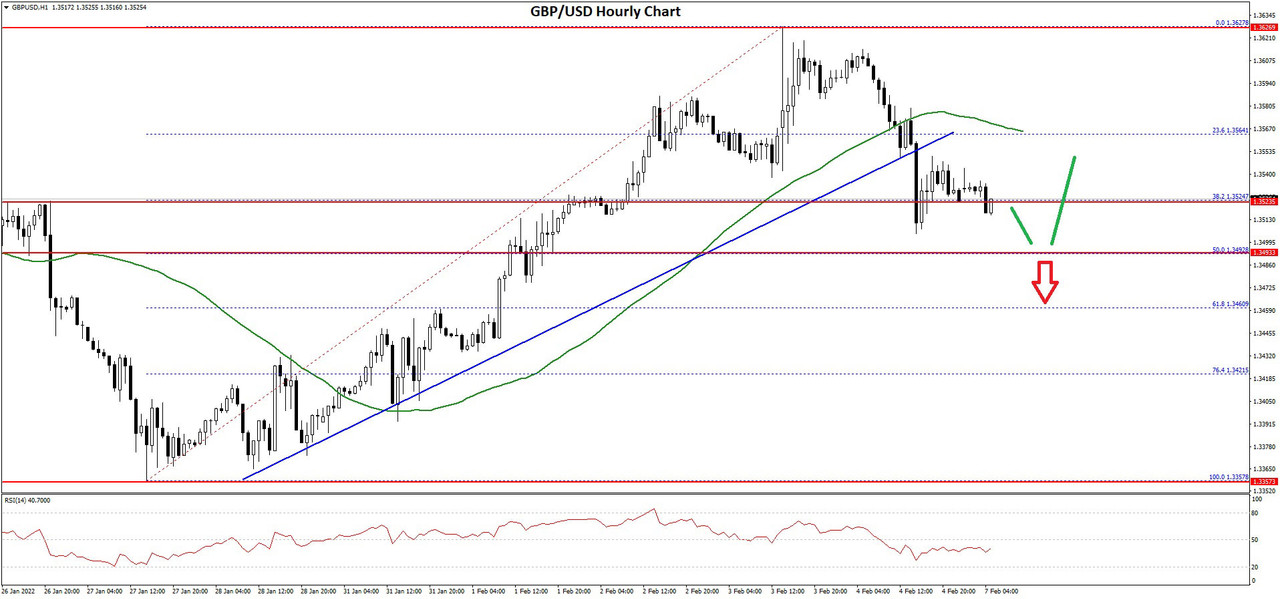
    After a major decline, the British Pound found support near the 1.3350 zone against the US Dollar. The GBP/USD pair started a fresh increase above the 1.3400 and 1.3450 resistance levels to move into a positive zone.

    There was also a break above the 1.3550 zone and the 50 hourly simple moving average. It traded as high as 1.3627 on FXOpen and is currently correcting gains.

    GBP/USD Hourly Chart


    There was a decline below the 1.3600 level and the 50 hourly simple moving average. The pair traded below the 38.2% Fib retracement level of the upward move from the 1.3357 swing low to 1.3627 high. Besides, there was a break below a key bullish trend line with support near 1.3550 on the hourly chart of GBP/USD.

    On the downside, an immediate support is near the 1.3500 level. The next major support is near the 1.3590 level. It is near the 50% Fib retracement level of the upward move from the 1.3357 swing low to 1.3627 high.

    If there is a break below the 1.3590 support, the pair could test the 1.3550 support. If there are additional losses, the pair could decline towards the 1.3500 level.

    On the upside, the pair is facing resistance near the 1.3560 level. The next major hurdle is near 1.3625, above which the pair could surge towards 1.3750 in the near term.


    Read Full on FXOpen Company Blog...

  10. #340
    Junior Member FXOpen Trader's Avatar
    Join Date
    Dec 2020
    Location
    Asia
    Posts
    2,040
    BTCUSD and XRPUSD Technical Analysis – 08th FEB 2022


    BTCUSD: Double Bottom Pattern Above $36,200

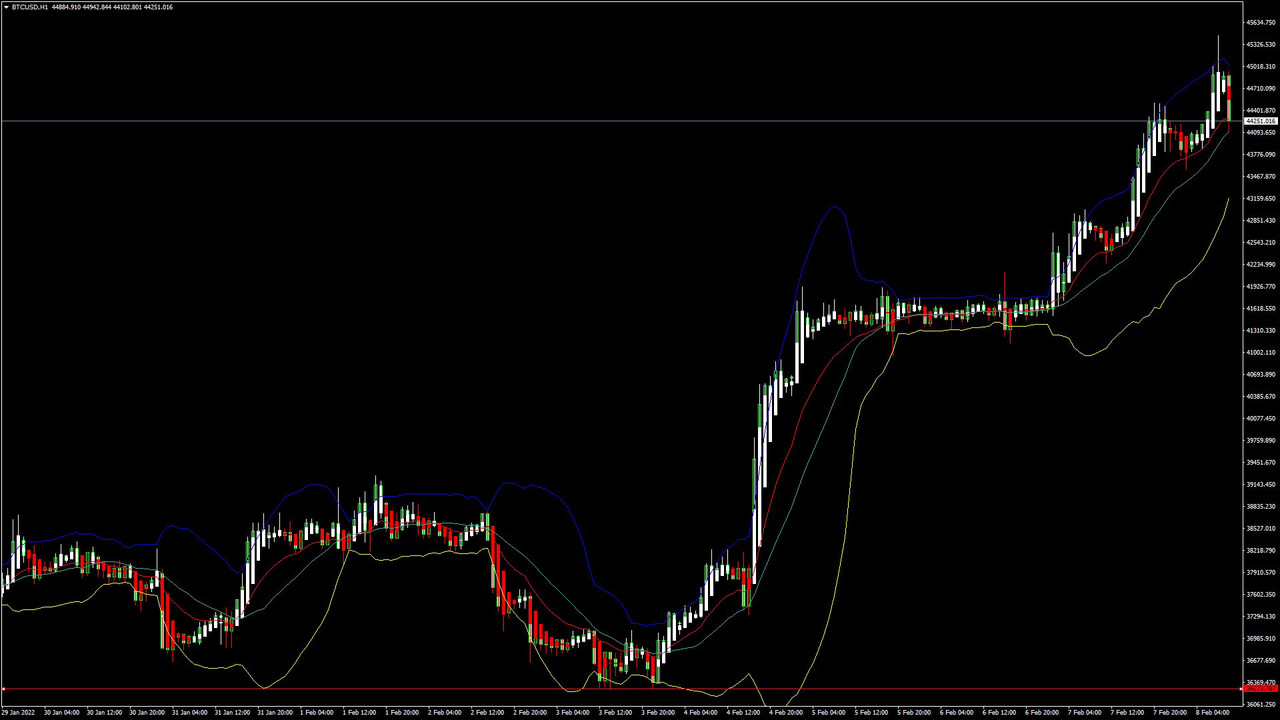
    Bitcoin continues its bullish momentum this week in the form of a rally, and touched a high of $45,387 in today’s European trading session.

    Global buying pressure is observed in bitcoin, and support at lower levels which has managed to push up the prices of BTCUSD above the $44,000 handle.

    BTCUSD touched an intraday low of $43,575 in the Asian trading session, and an intraday high of $45,387 today.

    We can clearly see a double bottom pattern above $36,200, which is a bullish reversal pattern because it signifies the end of a downtrend and a shift towards an uptrend.

    Both Stoch and Williams percent Rrange are indicating OVERBOUGHT levels which means that in the immediate short-term a decline in the prices is expected.

    The relative strength index is at 60 indicating a STRONG demand for bitcoin at the current market level.

    Bitcoin is now moving above its 100 hourly simple moving average and below its 200 hourly exponential moving averages.

    The average true range is indicating lesser market volatility with a bullish zone formation.

    • Bitcoin bullish momentum continues above $36,200
    • Highs/Lows are indicating a NEUTRAL level
    • The price is now trading just below its pivot level of $44,846
    • All of the moving averages are giving a BUY market signal


    Bitcoin Rally Seen Above $36,200


    Bitcoin continues its strong bullish momentum, having crossed the $45,000 handle in today’s European trading session.

    The immediate short-term outlook for bitcoin is bullish, the medium-term outlook is neutral, and the long-term outlook remains strongly bullish.

    The daily RSI is printing at 64 which means that long-term investors have returned to the markets, which can push the prices of BTCUSD above the $50,000 handle.

    All of the major technical indicators are giving a STRONG BUY signal, which means that in the immediate short-term we are expecting targets of $45,000 and $48,000.

    The price of BTCUSD is now facing its classic resistance level of $45,033 and Fibonacci resistance level of $45,145, after which the path towards $48,000 will get cleared.

    In the last 24hrs, BTCUSD has gone UP by 3.81% with a price change of $1,622, and has a 24hr trading volume of USD 31.862 billion. We can see an increase of 48.60% in the trading volume as compared to yesterday, due to increased buying pressure in global cryptocurrency markets.

    The total market capitalization of bitcoin has now crossed the $800 billion mark and is currently at 838.161 billion USD.

    The Week Ahead

    The prices of bitcoin are at present moving in a contraction phase after touching the level of $45,000. We can see some short-selling which is the reason for a pullback to the current market level of $44,150.

    We have detected MA5 and MA10 crossover patterns at $44,671 and $44,345, which signifies the visible contraction seen in the prices of bitcoin.

    In the medium-term, bitcoin’s bullish momentum is expected to continue pushing past the $50,000 handle this week.

    The prices of BTCUSD will need to remain above the important support level of $40,000 this week.

    We can expect more upsides in the range of $45,000 to $48,000 in the next week.

    Bitcoin’s Rally Mode

    The prices of bitcoin continue to surge from their lowest level seen on 24th Jan when it touched a low of $33,503.

    At the current market price of $44,140 we can see a gain of 31% which is why we can say that bitcoin is in a rally mode, and the prices can continue appreciating towards $50,000 and $55,000 in the coming weeks.

    Historically, this is seen as the longest rally after Sept 2021, due to increased global investor sentiments.

    Technical Indicators:

    Commodity channel index (14-day): at 53.50 indicating a BUY

    Average directional change (14-day): at 45.17 indicating a BUY

    Rate of price change: at 0.495 indicating a BUY

    Moving averages convergence divergence (12,26): at 502.00 indicating a BUY


    Read Full on FXOpen Company Blog...

Page 34 of 164 FirstFirst ... 24 32 33 34 35 36 44 84 134 ... LastLast

Bookmarks

Posting Permissions

  • You may not post new threads
  • You may not post replies
  • You may not post attachments
  • You may not edit your posts
  •