Page 32 of 141 FirstFirst ... 22 30 31 32 33 34 42 82 132 ... LastLast
Results 311 to 320 of 1403

Daily Market Analysis By FXOpen

This is a discussion on Daily Market Analysis By FXOpen within the Analytics and News forums, part of the Trading Forum category; All Eyes On Friday’s US Jobs Report Finally, we left 2021 behind, and the investing community is preparing for what ...


  1. #311
    Junior Member FXOpen Trader's Avatar
    Join Date
    Dec 2020
    Location
    Asia
    Posts
    1,702
    All Eyes On Friday’s US Jobs Report


    Finally, we left 2021 behind, and the investing community is preparing for what the new year has in store for financial markets. Already, some important economic data is due out this week, despite some market participants still being on their winter break.

    For example, banks in Europe, the UK, the US, and Canada are closed today. As such, volatility is likely to remain subdued and levels to hold. However, things are about to change as the market will build momentum towards the most important economic release of the week, the non-farm payrolls (NFP, or, alternatively, the jobs) report.

    As a rule, NFP reports are released on the first Friday of the new month, and show the evolution of the US jobs market. Because the Federal Reserve of the US (aka the Fed) has job creation as part of its mandate, changes in the job market may affect the Fed’s interest rate decision

    Both the number of jobs created and the unemployment rate are important for market participants, especially if they show that the Fed comes closer to its definition of full employment. If so, the US dollar should get a boost as inflation is already running well above the Fed’s definition of price stability.


    What do we expect of Friday’s release?

    This Friday’s data will refer to December 2021, and the market expects the US economy to create 410k jobs, and the unemployment rate to further decline to 4.1%. The November data showed that the US economy added 210k new jobs, but the unemployment rate was affected by the fact that people have quit their jobs, giving the impression that the unemployment rate is low.

    One interesting detail to watch out for is the labor force participation rate change. In November, it increased, but has remained well below its pre-pandemic level. High unemployment and aging numbers justify the decline partially, so more evidence is needed from future releases.

    All in all, expect the price action to build momentum towards Friday’s release as more market participants become active.

    FXOpen Blog

  2. #312
    Junior Member FXOpen Trader's Avatar
    Join Date
    Dec 2020
    Location
    Asia
    Posts
    1,702
    EUR/USD Struggle Continues, USD/JPY Extends Rally


    EUR/USD started a fresh decline from well above 1.1350. USD/JPY started a major increase above the 115.00 and 115.50 resistance levels.

    Important Takeaways for EUR/USD and USD/JPY

    • The Euro failed to gain strength above the 1.1350 and 1.1380 resistance levels.
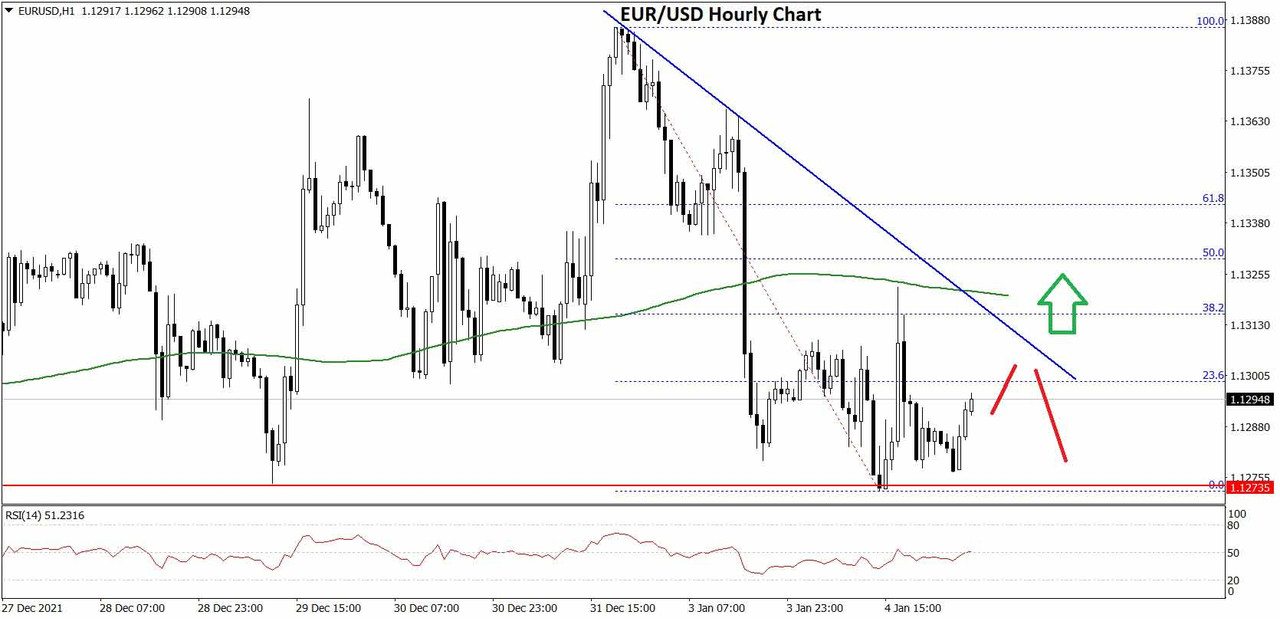
    • There is a key bearish trend line forming with resistance near 1.1300 on the hourly chart of EUR/USD.
    • USD/JPY started a fresh increase above the 115.00 resistance zone.
    • There was a break above a major rising channel with resistance near 115.55 on the hourly chart.


    EUR/USD Technical Analysis

    Recently, the Euro failed to clear the 1.1385 zone against the US Dollar. The EUR/USD pair started a fresh decline and traded below the 1.1320 support zone.

    The pair even broke the 1.1300 level and settled below the 50 hourly simple moving average. A low was formed near 1.1272 on FXOpen and the pair is now consolidating. An immediate resistance on the upside is near the 1.1300 level.

    EUR/USD Hourly Chart


    It is near the 23.6% Fib retracement level of the recent decline from the 1.1388 swing high to 1.1272 low. The next major resistance is near the 1.1305 level.

    There is also a key bearish trend line forming with resistance near 1.1300 on the hourly chart of EUR/USD. The main resistance is near the 1.1320 level and the 50 hourly simple moving average. It is near the 50% Fib retracement level of the recent decline from the 1.1388 swing high to 1.1272 low.

    If there is no break above 1.1320, the pair might start a fresh decline. An immediate support is near the 1.1275. The next major support is near 1.1260, below which the pair could dive to 1.1220 in the near term.

    Read Full on FXOpen Company Blog...

  3. #313
    Junior Member FXOpen Trader's Avatar
    Join Date
    Dec 2020
    Location
    Asia
    Posts
    1,702
    AUD/USD and NZD/USD Could Extend Losses


    AUD/USD started a fresh decline from well above 0.7250. NZD/USD is also declining and there is a risk of a move below the 0.6730 support.

    Important Takeaways for AUD/USD and NZD/USD

    • The Aussie Dollar started a major decline from well above the 0.7250 level against the US Dollar.
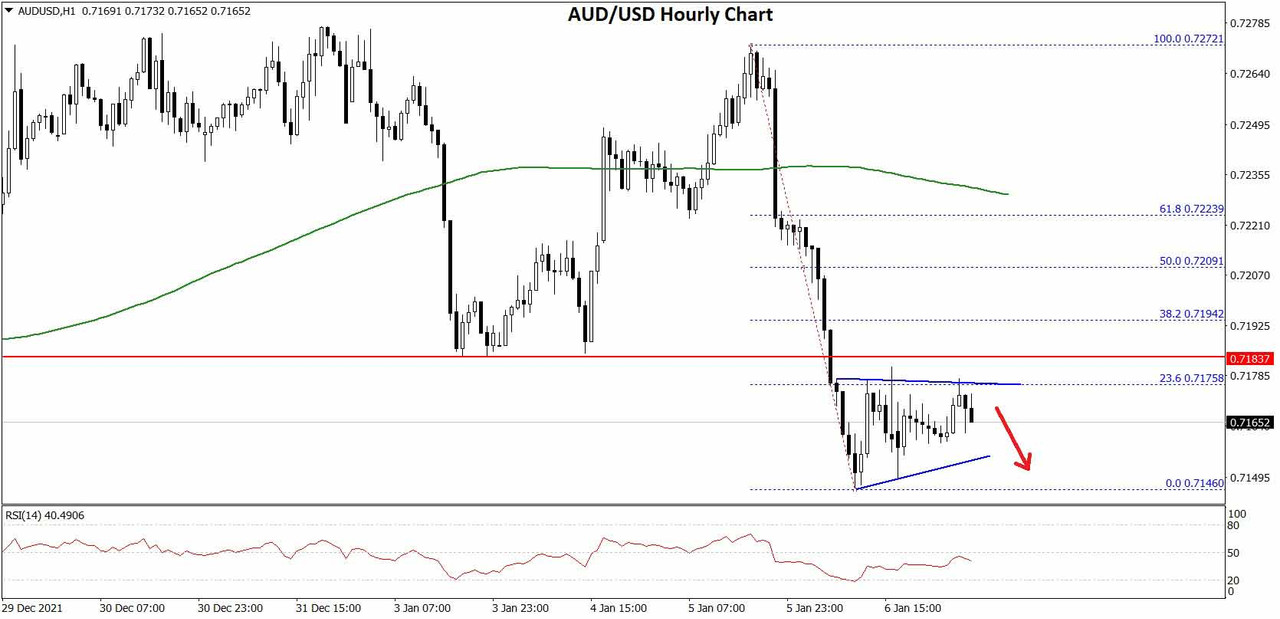
    • There is a short-term breakout pattern forming with resistance near 0.7175 on the hourly chart of AUD/USD.
    • NZD/USD also declined sharply below the 0.6800 support zone.
    • There is a contracting triangle forming with resistance near 0.6755 on the hourly chart of NZD/USD.


    AUD/USD Technical Analysis

    The Aussie Dollar struggled to clear the 0.7270 level against the US Dollar. The AUD/USD pair started a fresh decline below the 0.7250 support level.

    The pair even traded below the 0.7220 support level and the 50 hourly simple moving average. It traded as low as 0.7146 on FXOpen and started consolidation. There was a minor move above the 0.7155 level.

    AUD/USD Hourly Chart


    However, the pair is facing resistance near the 0.7175 level. There is also a short-term breakout pattern forming with resistance near 0.7175 on the hourly chart of AUD/USD. The triangle resistance is near the 23.6% Fib retracement level of the downward move from the 0.7272 swing high to 0.7146 low.

    The next major resistance is near the 0.7210 level. It is near the 50% Fib retracement level of the downward move from the 0.7272 swing high to 0.7146 low.

    A close above the 0.7210 level could start a steady increase in the near term. The next major resistance could be 0.7250. On the downside, an initial support is near the 0.7150 level. If there is a downside break below the 0.71350 support, the pair could extend its decline towards the 0.7120 level. Any more downsides might send the pair toward the 0.7100 level.

    Read Full on FXOpen Company Blog...

  4. #314
    Junior Member FXOpen Trader's Avatar
    Join Date
    Dec 2020
    Location
    Asia
    Posts
    1,702
    GBP/USD Gains Momentum, USD/CAD Could Extend Losses


    GBP/USD started a major increase above the 1.3500 resistance zone. USD/CAD declined below 1.2700 and remains at a risk of more downsides.

    Important Takeaways for GBP/USD and USD/CAD

    • The British Pound started a fresh increase from the 1.3320 support zone.
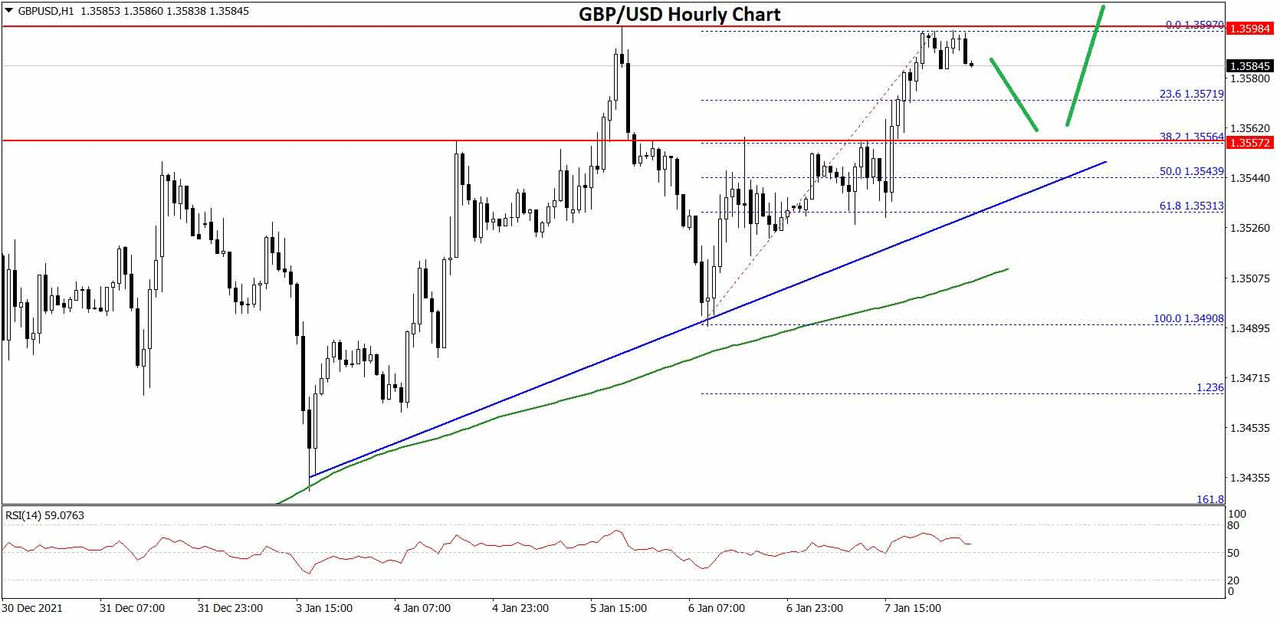
    • There is a key bullish trend line forming with support near 1.3545 on the hourly chart of GBP/USD.
    • USD/CAD started a fresh decline from well above the 1.2800 pivot level.
    • There was a break below a major bullish trend line with support near 1.2730 on the hourly chart.


    GBP/USD Technical Analysis

    After a major decline, the British Pound found support above 1.3320 against the US Dollar. GBP/USD started a fresh upward wave above the 1.3500 level.

    The bulls gained strength and pushed the pair above the 1.3550 level. A high was formed near 1.3597 on FXOpen and the pair is now consolidating gains. It is now trading well above the 1.3550 level and the 50 hourly simple moving average.

    GBP/USD Hourly Chart


    On the downside, the first support is near the 1.3570 area. It is near the 23.6% Fib retracement level of the upward move from the 1.3490 swing low to 1.3597 high.

    The first major support is near the 1.3550 level. There is also a key bullish trend line forming with support near 1.3545 on the hourly chart of GBP/USD. It is close to the 50% Fib retracement level of the upward move from the 1.3490 swing low to 1.3597 high.

    If there is a break below 1.3545, the pair could extend its decline. The next key support is near the 1.3500 level. Any more losses might call for a test of the 1.3450 support.

    An immediate resistance is near the 1.3600 level. The first major resistance is near the 1.3620 level. If there is an upside break above the 1.3620 zone, the pair could rise towards 1.3700. The next key resistance could be 1.3750, above which the pair could gain strength.

    Read Full on FXOpen Company Blog...

  5. #315
    Junior Member FXOpen Trader's Avatar
    Join Date
    Dec 2020
    Location
    Asia
    Posts
    1,702
    Japanese Yen a bastion of nation's stability.. or is it?


    Japan has for several decades been considered to be a shining light to the rest of the modern world.

    Its technological prowess, civilized society and conservative, process-driven ideology have led it to become one of the most advanced nations on the planet, and for the Yen to be considered by many traders to be a safe Major Currency. A currency backed by Japan's diverse and sophisticated industry base.

    The past forty years have demonstrated that Japan is a force to be reckoned with. It is an industrial giant, exporting its ultra-high tech electronics, cars, and science around the entire world and has a reputation for precision, engineering excellence and a degree of 'cool' that is apparent in every area of global society.

    More recently, the Japanese economy has been bolstered by its government and population having not succumbed to the narrative relating to lockdowns and restrictions. Japan has remained open for business throughout the entire past 18 months, and with results which demonstrate its good decision-making.

    However, as this week's trading begins, the Yen is continuing to fall against the US Dollar.

    On Friday, January 7, 2022, Japan's Finance Minister Shunichi Suzuki spoke publicly about the need to stabilize the Yen and explained that he is watching the currency markets carefully due to the Yen's recent declines against the US Dollar.

    The US Dollar has been accelerating in value compared to the Japanese Yen for quite some time now, and now stands at 115.66 Yen to the Dollar, meaning that the US Dollar is at its highest point against the Yen in over one year.

    On Tuesday last week, the US Dollar hit a five-year high against the Yen with an exchange rate of 116.355 yen to one US Dollar after strengthening on expectations that the U.S. Federal Reserve will embark on steady interest rate increases while the Bank of Japan continued to keep interest rates low.

    Another factor that has possibly contributed to an increasingly weak Yen is the increasing reliance on raw material imports by Japanese companies, and the difficulties associated with semi-conductor shortages which could have blighted Japanese engineering and electronics giants, however wholesale inflation is now hitting a record high and driving up the cost of living, which in major urban areas of Japan is among the highest in the world.

    Currently, Japanese policymakers see little room to intervene in the currency market to attempt to stem the decline of the Yen against the US Dollar, however this decision has been met with some degree of public discourse given that Japan currently has a weakening economy, with competitiveness slipping and dire public finances.

    Japan's government and central bank, both notoriously conservative and non-reactionary, have kept well away from intervening in the currency market since 2011 when horrendous natural disasters and the subsequent Fukushima nuclear crisis triggered volatility in the Yen.

    Output is still relatively high, and it could be that local economists are relying on an uninterrupted industrial base to ride out the storm, and look toward the longer term rather than current situation.

    Either way, the USDJPY pair remains an unusually volatile instrument in what is notoriously a stable major currency market which has been used to small movements for many years.

    FXOpen Blog

  6. #316
    Junior Member FXOpen Trader's Avatar
    Join Date
    Dec 2020
    Location
    Asia
    Posts
    1,702
    BTCUSD and XRPUSD Technical Analysis – 11th JAN 2022


    BTCUSD: Double Bottom Pattern Above $40,000

    Bitcoin could not sustain its bullish momentum and started to decline after touching a high of $47,527 on 3rd January due to the heavy selling pressure that was observed across global cryptocurrencies in the first week of 2022.

    The price of BTCUSD broke the $40,000 handle yesterday, touching a low of $39,719 in the European trading session. Also today, we could see some pullback action in the European trading session, and the prices of BTCUSD are ranging above the $40,000 handle.

    A double bottom pattern is clearly seen above $40,000, which signifies the end of a downtrend and a shift towards an uptrend.

    Stoch is indicating an OVERBOUGHT market, so a decline is expected to occur in the immediate short-term.

    The relative strength index is at 54, indicating a NEUTRAL market and a move towards a market consolidation phase.

    Bitcoin is now moving above its 100 hourly simple moving average and below its 200 hourly exponential moving average.

    The average true range is indicating a lesser market volatility, meaning that markets are due to enter into a consolidation phase.

    • Bitcoin trend reversal seen above $40,000
    • Williams percent range indicating an OVERBOUGHT level
    • The price is now trading below its pivot levels of $42,196
    • Most of the moving averages are giving a BUY market signal


    Bitcoin: Bullish Reversal Above $40,000 Confirmed


    In today’s European trading session, bitcoin is forming a bullish reversal pattern as the prices continue to uptick.

    The immediate short-term outlook for bitcoin is mildly bullish, the medium-term outlook is neutral, and the long-term outlook remains bullish.

    All of the major technical Indicators are giving a STRONG BUY signal, which means that in the immediate short-term we should expect targets of $43,000 and $44,000.

    The price of BTCUSD is now facing its classic resistance level of $42,294 and Fibonacci resistance level of $42,368, after which the path towards $43,000 will get cleared.

    In the last 24hrs, BTCUSD has gone UP by 0.55% with a price change of 232$, and has a 24hr trading volume of USD 33.986 billion. We can see an Increase of 60.84% in the trading volume as compared to yesterday. This increase is happening thanks to the strengthened buying pressure seen after the recent bitcoin’s decline.

    The Week Ahead

    The price of bitcoin has already touched a 5-month low, sliding below the $40,000 handle. At the start of 2022, such a decline signifies a weaker demand for bitcoin from global investors.

    We can see that the prices of BTCUSD have stabilized and are moving in a mildly bullish channel in the European trading session today.

    If the prices continue to remain above the important support level of $42,000, we could see an upside correction towards $44,000 this week.

    BTC declines more than 40% from 2021 highs

    In November 2021, we saw bitcoin touched an all-time high of $68,984; looking at this year’s low of $39,719, we can see a decline by 42%. This also explains the highly volatile nature of bitcoin. Looking at these numbers, many investors are not willing to enter into bitcoin markets.

    The above reasons also led to the decline in the total market capitalization of bitcoin to below 800 billion USD.

    Technical Indicators:

    Commodity channel index (14-day): at 98.97 indicating a BUY

    Average directional change (14-day): at 40.05 indicating a BUY

    Rate of price change: at 1.114 indicating a BUY

    StochRSI (14-day): at 67.04 indicating a BUY

    Read Full on FXOpen Company Blog...

  7. #317
    Junior Member FXOpen Trader's Avatar
    Join Date
    Dec 2020
    Location
    Asia
    Posts
    1,702
    EUR/USD and USD/CHF: Dollar Correcting Gains


    EUR/USD is eyeing a key upside break above 1.1380 and 1.1400. USD/CHF remains supported on the downside near the 0.9200 zone.

    Important Takeaways for EUR/USD and USD/CHF

    • The Euro is slowly moving higher above the 1.1350 resistance zone against the US Dollar.
    • There is a key bullish trend line forming with support near 1.1315 on the hourly chart of EUR/USD.
    • USD/CHF started a downside correction from the 0.9280 resistance zone.
    • There is a major bullish trend line forming with support near 0.9215 on the hourly chart.


    EUR/USD Technical Analysis

    The Euro remained well bid above the 1.1300 zone against the US Dollar. The EUR/USD pair started a slow increase and there was a break above the 1.1320 resistance zone.

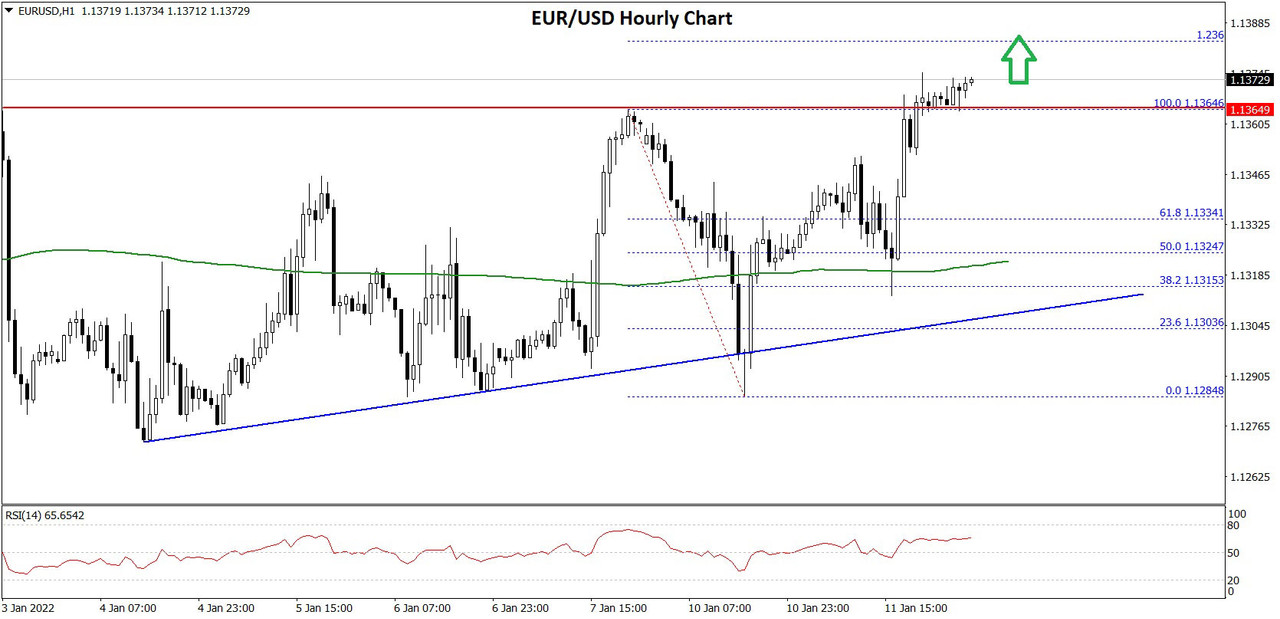
    There was a clear break above the 1.1340 and 1.1350 levels. The pair climbed above the 76.4% Fib retracement level of the key decline from the 1.1364 swing high to 1.1284 low (formed on FXOpen).

    EUR/USD Hourly Chart


    It is now trading above 1.1370 level and the 50 hourly simple moving average. On the upside, an initial resistance is near the 1.1380 level.

    The 1.236 Fib extension level of the key decline from the 1.1364 swing high to 1.1284 low is also near the 1.1380 level. The next major resistance is near the 1.1400 zone. A clear upside break above the 1.1400 zone could open the doors for a steady move.

    The next major resistance sits near the 1.1450 level. On the downside, an immediate support is near the 1.1340 level. The next major support is near the 1.1320 level.

    There is also a key bullish trend line forming with support near 1.1315 on the hourly chart of EUR/USD. A downside break below the 1.1320 support could start another decline. The next major support sits near 1.1300.

    Read Full on FXOpen Company Blog...

  8. #318
    Junior Member FXOpen Trader's Avatar
    Join Date
    Dec 2020
    Location
    Asia
    Posts
    1,702
    ETHUSD and LTCUSD Technical Analysis – 13th JAN, 2022


    ETHUSD: Double Bottom Pattern Above $2,900

    Ethereum continued its decline from its weekly high of $3,888 reached on January 4th, after which we saw heavy selling pressure due to which the prices of ETHUSD slid below the $3,000 handle.

    ETHUSD touched a low of $2,937 on January 10th, after which we could see buying and a continuous uptick in the price of Ethereum.

    We can clearly see a double bottom pattern above the $2,900 handle which is a bullish reversal pattern and signifies the end of a downtrend and a shift towards an uptrend.

    ETH is now trading just above its pivot level of $3,340 and moving in a mild bullish channel. The price of ETHUSD is now testing its classic resistance level of $3,361 and Fibonacci resistance level of $3,354, after which the path towards $3,500 will get cleared.

    StochRSI is indicating an OVERSOLD level which means markets are due for an upwards correction soon.

    All the moving averages are giving a STRONG BUY signal at the current market price of $3,351.

    Some of the technical indicators are giving a BUY signal.

    ETH is now trading above its 100 hourly and 200 hourly simple moving averages.

    • Ethereum bullish trend reversal is seen above the $2,900 mark
    • Short-term range appears to be mildly bullish for ETHUSD
    • Commodity channel index is indicating a NEUTRAL market
    • Average true range is indicating LESSER market volatility


    Ether: Bullish Trend Reversal Seen Above $2,900


    ETHUSD continues to move into a consolidation channel above the $3,300 handle in the European trading session today.

    The bullish trend line formation is clearly visible, indicating that the price of Ethereum will touch the level of $3,500.

    We are also due for a major upwards correction in ETHUSD which could be in the form of a rally taking its price close to the $4,000 handle.

    We can see a mildly bullish channel in progression today which is pushing the price of ETHUSD towards the $3,400 level.

    ETH has gained 3.90% with a price change of 125.95$ in the past 24hrs and has a trading volume of 16.624 billion USD.

    We can see an increase of 10.23% in the total trading volume in the last 24 hrs which appears to be normal.

    The Week Ahead

    Ethereum continues to outperform bitcoin in 2022 with a gain of 3.85% in the last 24hrs, as compared to bitcoin which gained 2.86% during the same period.

    The immediate short-term outlook for Ether has turned mildly bullish, the medium-term outlook is NEUTRAL, and the long-term outlook for Ether is BULLISH with a RALLY formation towards the $4,000 handle.

    ETHUSD continues to remain above the important psychological support level of $3,000, and is now on its path to cross $3,500.

    This week, we can expect to see $3,500 to $3,600; and the next week Ether is expected to trade at a level above $3,600.

    ETH 2.0

    Ethereum is close to replacing Proof-of-Work with Proof-of-Stake with the launch of ETH 2.0. As of today, over 9 million ETH is now deposited in the Ethereum 2.0 deposit contract. This new network will be more energy efficient and reduce the total energy requirements by 99.9%.

    To become a validator in the ETH 2.0, the investor will need to pledge 32ETH to the blockchain.

    Technical Indicators:

    Ultimate oscillator: at 51.13 indicating a BUY

    Relative strength index (14-day): at 60.89 indicating a BUY

    Moving averages convergence divergence (12,26): at 21.90 indicating a BUY

    Bull/Bear power (13-day): at 2.99 indicating a BUY

    Read Full on FXOpen Company Blog...

  9. #319
    Junior Member FXOpen Trader's Avatar
    Join Date
    Dec 2020
    Location
    Asia
    Posts
    1,702
    Gold Price and Crude Oil Price Aim More Upsides


    Gold price is gaining pace above the $1,805 resistance zone. Crude oil price is correcting gains, but dips might be limited below the $80.00 support.

    Important Takeaways for Gold and Oil

    • Gold price is gaining pace and trading above the $1,820 zone against the US Dollar.
    • There is a key bullish trend line with support near $1,820 on the hourly chart of gold.
    • Crude oil price started a downside correction from the $82.50 resistance zone.
    • There is a major bullish trend line forming with support near $81.20 on the hourly chart of XTI/USD.


    Gold Price Technical Analysis

    Gold price started a fresh increase from the $1,784 support zone against the US Dollar. The price gained pace above the $1,800 resistance to move into a positive zone.

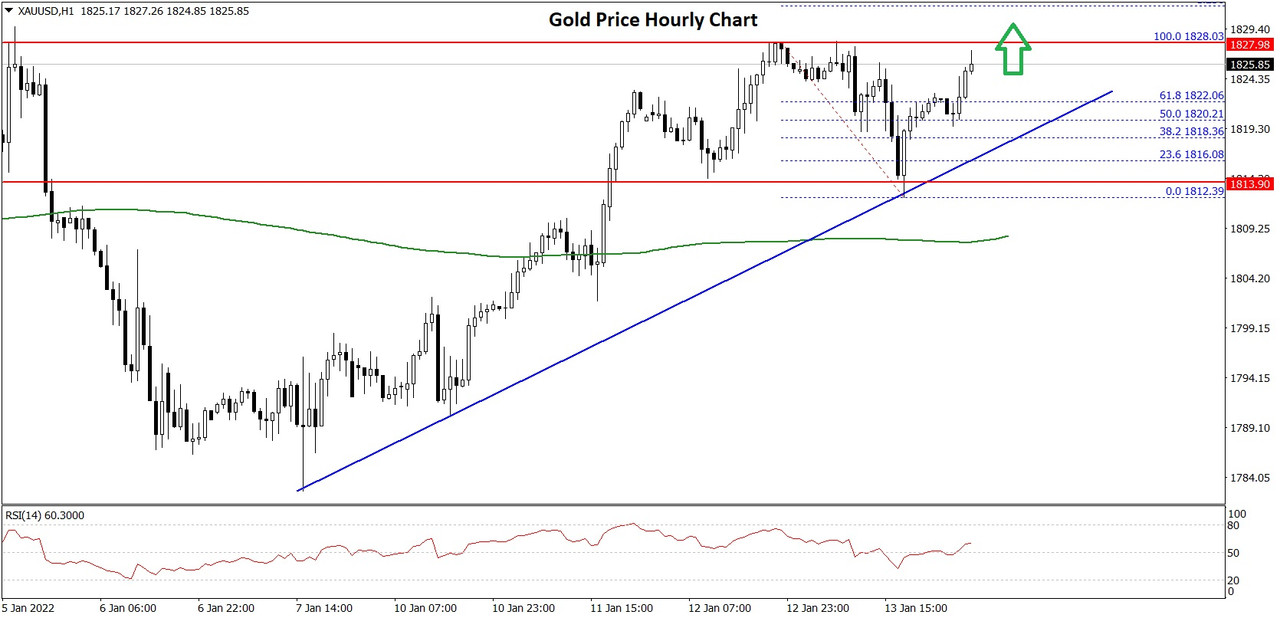
    The price settled well above the $1,810 level and the 50 hourly simple moving average. The price traded as high as $1,828 before there was a downside correction. The price declined below $1,820, but the bulls were active above $1,810.

    Gold Price Hourly Chart


    A low is formed near $1,812 on FXOpen and the price is now rising. There is also a key bullish trend line with support near $1,820 on the hourly chart of gold. There was a clear move above the 50% Fib retracement level of the downward move from the $1,828 swing high to $1,812 low.

    It is now trading near the $1,825 level. It is near the 76.4% Fib retracement level of the downward move from the $1,828 swing high to $1,812 low.

    On the upside, the price is facing resistance near the $1,828 level. The main resistance is near the $1,830 level. A close above the $1,830 level could open the doors for a steady increase towards $1,850. The next major resistance sits near the $1,865 level.

    On the downside, an initial support is near the $1,820 level. The first major support is near the $1,810 level. A downside break below the $1,810 support zone may possibly spark a steady decline. In the stated case, the price could test the $1,780 support.

    Read Full on FXOpen Company Blog...

  10. #320
    Junior Member FXOpen Trader's Avatar
    Join Date
    Dec 2020
    Location
    Asia
    Posts
    1,702
    GBP/USD and GBP/JPY Eye Upside Continuation


    GBP/USD started a fresh increase from the 1.3500 zone and climbed above 1.3600. GBP/JPY is also rising, but it is facing resistance near 156.60.

    Important Takeaways for GBP/USD and GBP/JPY

    • The British Pound started a fresh increase above the 1.3500 and 1.3600 resistance levels against the US Dollar.
    • There is a major bullish trend line forming with support near 1.3645 on the hourly chart of GBP/USD.
    • GBP/JPY also started a steady increase above the 156.00 and 156.20 resistance levels.
    • There is a key bearish trend line forming with resistance near 156.65 on the hourly chart.


    GBP/USD Technical Analysis

    After a major decline, the British Pound found support near the 1.3500 zone against the US Dollar. The GBP/USD pair started a fresh increase above the 1.3550 and 1.3600 resistance levels to move into a positive zone.

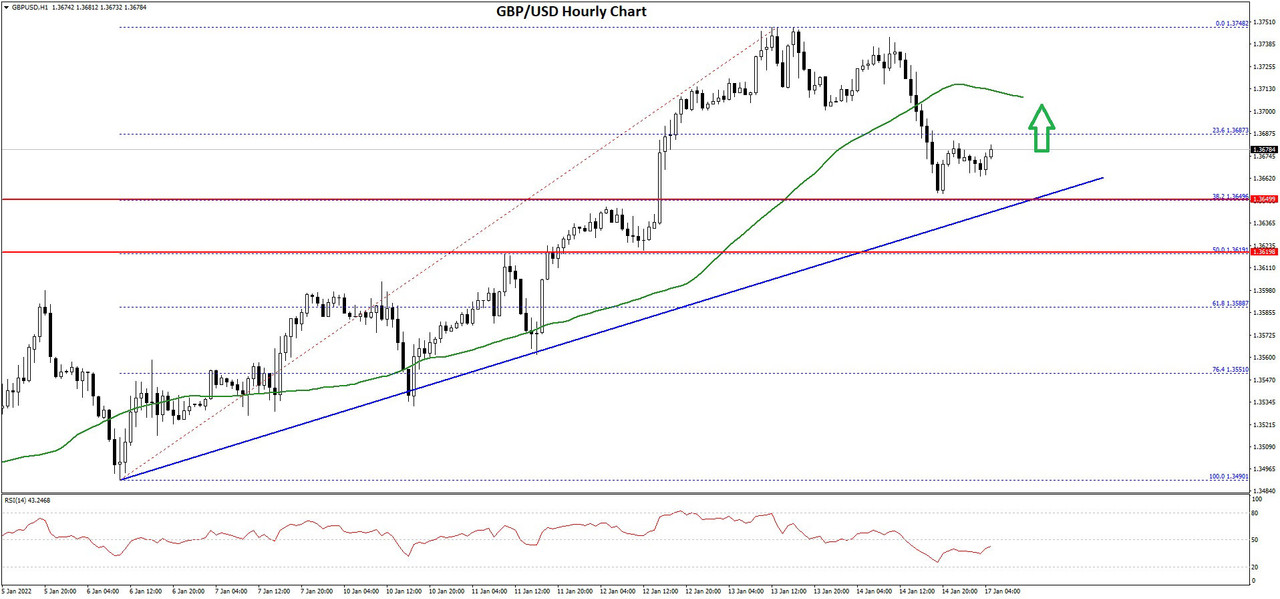
    There was also a break above the 1.3680 zone and the 50 hourly simple moving average. It traded as high as 1.3748on FXOpen and is currently correcting gains.

    GBP/USD Hourly Chart


    There was a minor decline below the 1.3720 level. The pair traded below the 23.6% Fib retracement level of the upward move from the 1.3490 swing low to 1.3748 high. On the downside, an immediate support is near the 1.3680 level.

    There is also a major bullish trend line forming with support near 1.3645 on the hourly chart of GBP/USD. The next major support is near the 1.3620 level.

    The 50% Fib retracement level of the upward move from the 1.3490 swing low to 1.3748 high is also near the 1.3620 zone. If there is a break below the 1.3620 support, the pair could test the 1.3550 support. If there are additional losses, the pair could decline towards the 1.3500 level.

    On the upside, the pair is facing resistance near the 1.3720 level. A close above the 1.3720 level could open the doors for more gains. The next major hurdle is near 1.3750, above which the pair could surge towards 1.3850.

    Read Full on FXOpen Company Blog...

Page 32 of 141 FirstFirst ... 22 30 31 32 33 34 42 82 132 ... LastLast

Bookmarks

Posting Permissions

  • You may not post new threads
  • You may not post replies
  • You may not post attachments
  • You may not edit your posts
  •