Page 30 of 146 FirstFirst ... 20 28 29 30 31 32 40 80 130 ... LastLast
Results 291 to 300 of 1453

Daily Market Analysis By FXOpen

This is a discussion on Daily Market Analysis By FXOpen within the Analytics and News forums, part of the Trading Forum category; The low Turkish Lira and the tourism opportunity Turkey, a huge nation which is home to over 84 million people, ...


  1. #291
    Junior Member FXOpen Trader's Avatar
    Join Date
    Dec 2020
    Location
    Asia
    Posts
    1,763
    The low Turkish Lira and the tourism opportunity


    Turkey, a huge nation which is home to over 84 million people, is in an interesting position economically and politically and has been for some time.

    The current economic outlook is one of surprising doom, and the focus over the past day by mainstream economists in Western countries has been on the anticipation of a rate cut which has caused the Lira to plunge to a new low, which is quite a significant market event given that it began this month at a very low value.

    Yesterday was a particularly interesting session for the Lira, given that it was trading at 14.33 to the dollar at 1:25 p.m. in Istanbul, representing a slight recovery from the record low of 14.99 earlier in the day but still languishing at all time lows.

    The mere thought that a commonly-traded currency which is not a major and could be considered to be one of the 'exotics' which is often traded against majors would plunge to a lower value than ever recorded could well prove to be a point of interest among traders and market participants.

    Turkey may well be having a fiscal apocalypse in the eyes of its own central bank and policymakers and financial leaders globally, as the nation's own central bank began to intervene directly in the FX market on Monday this week by selling dollars to prop up the lira, but there are two sides to this situation which could lead to some degree of volatility.

    Whilst President Recep Tayyip Erdogan has taken a hardline stance against raising interest rates, Turkey's finance minister aligns with the idea as do many global economists which agree would actually aid the currency and go toward stemming the rampant inflation, which is now at approximately 20%.

    Thus, the currency is in the doldrums but the wider economy of Turkey has perhaps some degree of potential, as it is one of the only countries within which tourism makes up a vast percentage of the national industry base which is welcoming tourists without many restrictions.

    In 2018, Tourism directly accounted for 7.7% of total employment in Turkey, directly employing 2.2 million people and total income from tourism was 3.8% of GDP.

    The nation's nominal per capita income - effectively the average salary per person - in Turkey is $9,300 which is considerably short of the national average per capita GDP in Western nations which are home to major currencies, which means that any movement in the all important tourist industry makes all the difference to the outlook within Turkey and therefore could directly affect the value of the Lira

    Turkey's government has officially announced just three weeks ago that it will not be implementing any lockdowns going forward, and Turkey remains open to tourists.

    Every year, over one million British tourists flock to Turkey's sun-soaked resorts and with those resorts very much open for business, the possibility of restrictions being implemented across the United Kingdom over the winter period and the low value of the Turkish lira meaning that British travelers get more bang for their buck, it could be that the Turkish economy may get a boost from those looking for an escape from further curtailment of freedoms to a warmer climate for a few weeks with a great exchange rate.

    Many residents of Germany visit Turkey each year, some for vacation and others to visit their families and FX transactions between Germany and Turkey put the Euro and the Lira against each other very regularly.

    Given Germany's current strict Covid rules, Turkey's low value Lira and open society with little restrictions may appeal.

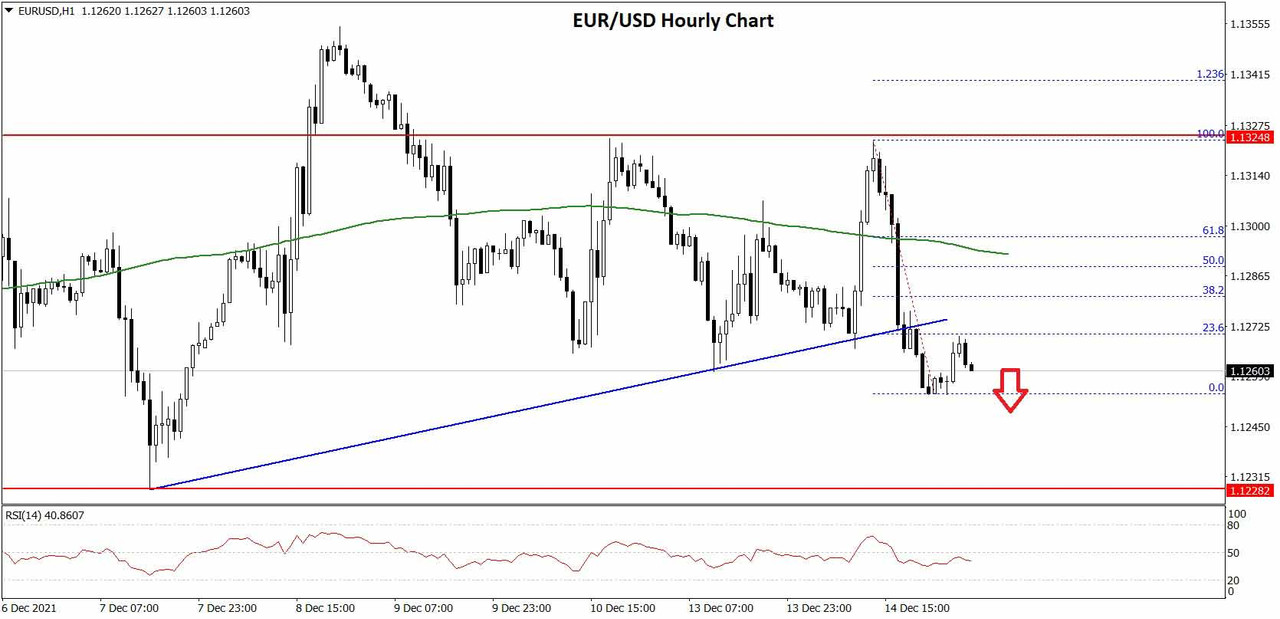
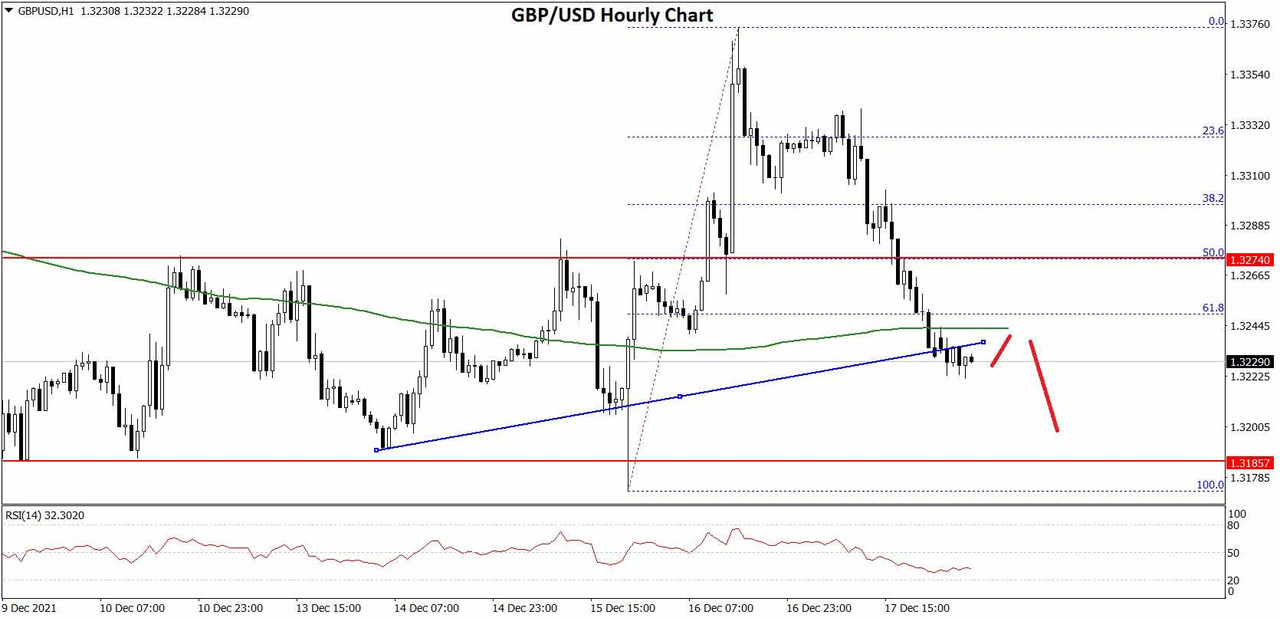
    Bearing in mind the internal issues of inflation and a beleaguered economy and the restrictions in Europe which may drive an open-for-business Turkish tourist industry forward, there may be some degree of volatility in the Lira when traded against the Euro or the Pound.

    FXOpen Blog

  2. #292
    Junior Member FXOpen Trader's Avatar
    Join Date
    Dec 2020
    Location
    Asia
    Posts
    1,763
    EUR/USD and USD/CHF: Dollar Could Gains Momentum


    EUR/USD is struggling to gain momentum above the 1.1300 zone. USD/CHF is rising, and it might extend gains above the 0.9250 level.

    Important Takeaways for EUR/USD and USD/CHF

    • The Euro failed to gain strength and declined below 1.1300 against the US Dollar.
    • There was a break below a key bullish trend line with support near 1.1270 on the hourly chart of EUR/USD.
    • USD/CHF started a decent increase from the 0.9200 support zone.
    • There is a major bearish trend line forming with resistance near 0.9250 on the hourly chart.


    EUR/USD Technical Analysis

    The Euro attempted an upside break above the 1.1325 resistance zone against the US Dollar. The EUR/USD pair failed to gain strength above 1.1325 and started a fresh decline.

    There was a clear break below the 1.1300 and 1.1280 support levels. Besides, there was a break below a key bullish trend line with support near 1.1270 on the hourly chart of EUR/USD. The pair even broke the 1.1260 support and the 50 hourly simple moving average.

    EUR/USD Hourly Chart


    It traded as low as 1.1250 on FXOpen and is consolidating losses. On the upside, an initial resistance is near the 1.1272 level. The 23.6% Fib retracement level of the recent decline from the 1.1326 swing high to 1.1250 low is also near 1.1272.

    The next major resistance is near the 1.1285 zone. It is near the 50% Fib retracement level of the recent decline from the 1.1326 swing high to 1.1250 low. A clear upside break above the 1.1300 zone could open the doors for a steady move.

    The next major resistance sits near the 1.1325 level. On the downside, an immediate support is near the 1.1250 level. The next major support is near the 1.1220 level.

    A downside break below the 1.1220 support could start another decline. The next major support sits near 1.1150.

    Read Full on FXOpen Company Blog...

  3. #293
    Junior Member FXOpen Trader's Avatar
    Join Date
    Dec 2020
    Location
    Asia
    Posts
    1,763
    GBP/USD Aims Recovery While EUR/GBP Is Sliding


    GBP/USD is attempting a recovery wave above the 1.3220 resistance. EUR/GBP is declining and is gaining pace below the 0.8550 level.

    Important Takeaways for GBP/USD and EUR/GBP

    • The British Pound is facing resistance near the 1.3280 and 1.3300 levels.
    • There was a break above a major bearish trend line with resistance near 1.3240 on the hourly chart of GBP/USD.
    • EUR/GBP started a fresh decline from well above the 0.8580 support level.
    • There is a major bearish trend line forming with resistance near 0.8540 on the hourly chart.


    GBP/USD Technical Analysis

    The British Pound declined heavily below the 1.3300 level against the US Dollar. The GBP/USD pair formed a base above the 1.3265 level and recently started an upside correction.

    The pair recovered above the 1.3200 resistance level. There was a break above the 50% Fib retracement level of the downward move from the 1.3289 high to 1.3163 low (formed on FXOpen). Besides, there was a break above a major bearish trend line with resistance near 1.3240 on the hourly chart of GBP/USD.

    The pair is now trading near the 1.3250 level and the 50 hourly simple moving average. It is close to the 76.4% Fib retracement level of the downward move from the 1.3289 high to 1.3163 low.

    On the upside, an initial resistance is near the 1.3265 level. If there is an upside break above the 1.3450 resistance and the 50 hourly SMA, the price could surpass 1.3280. The main resistance is near the 1.3300 zone.

    Therefore, a proper break above the 1.3300 resistance could open the doors for a steady increase. The next major resistance for the bulls could be 1.3350. If not, the pair could start a fresh decline below 1.3220. An immediate support is near the 1.3200 level.

    The first key support is near the 1.3180 level. Any more losses could lead the pair towards the 1.3150 support zone. The next major support sits near the 1.3080 level.

    Read Full on FXOpen Company Blog...

  4. #294
    Junior Member FXOpen Trader's Avatar
    Join Date
    Dec 2020
    Location
    Asia
    Posts
    1,763
    Is the EURUSD heading for parity?


    We have all been here before.

    Despite the major currencies not being particularly volatile for many years, the differences between those on each side of the Atlantic is now becoming quite marked and has perhaps been the direction to watch for a considerable period of time.

    Today, the EURUSD pair is trading at 1.13, which is the second-lowest point in over one year.

    Just a month ago, at the beginning of this strong and continual period of downward movement for the 'cable' pair, analysts in senior positions in Wall Street and the City of London were beginning to consider the possibility that the EURUSD pair's value may make a return to that of 2014 when parity was almost achieved.

    Given that many of the more industrially developed nations within the Eurozone have become subject to further restrictions at the hands of their respective governments, confidence has been affected as market participants take into account the potential effect slower production and less effective working practices in Austria, Germany and Holland could have on the wider Eurozone's stability.

    In particular, Germany, which has a population of over 80 million and a traditional industry base which requires employees to attend their place of work as opposed to many large scale, high producing businesses in the Anglosphere which are often internet based or intrinsically linked to the big tech giants, therefore meaning working from pretty much anywhere would not stifle output.

    Germany's largest employers are heavy manufacturing businesses such as Volkswagen, Bosch and Siemens, all of which require staff to travel to their factories. Restrictions being implemented by the national government would have a direct impact on this.

    Whilst the US government is also talking about introducing restrictions, it has not brought in any Covid passport system yet, and has only done so for travel purposes whilst some of the European nations are doing so for access to everyday events and there is concern that this may extend to workplaces.

    Looking at the EURUSD pair one month ago, it was trading at a healthy 1.22 which had been the case for quite a number of months, however as the year draws to a close we are looking at a clear downward line.

    Just two weeks ago, the euro-Swiss franc pair fell below parity on November 1 for the first time in almost a year, echoing the same sentiment among traders.

    At the beginning of this month, options traders were investing in options with longer expiry dates even before the euro dropped below 1.15, showing that a conservative approach is the current default.

    Whether we will see parity or not is yet to be determined, however this is a really unusual downturn and has been on this trajectory for long enough to make it a real feature within the FX market.

    FXOpen Blog

  5. #295
    Junior Member FXOpen Trader's Avatar
    Join Date
    Dec 2020
    Location
    Asia
    Posts
    1,763
    ETHUSD and LTCUSD Technical Analysis – 16th DEC, 2021


    ETHUSD: Double Bottom Pattern Above $3,600

    Ethereum started this week on a mild bullish tone by touching a high of $4,169 after which the decline started pushing its prices below the $4,000 handle.

    We saw Ethereum touching an intraday low of $3,654 yesterday, after which fresh buying in the market pushed its prices all the way above the $4000 mark. The recovery was also backed by the Three Arrows Capital hedge fund purchasing $56 million worth of Ether.

    ETHUSD is slowly preparing itself for its next move against the US dollar.

    We can clearly see a double bottom pattern above $3,600, which signifies the end of a downtrend and a shift towards an uptrend.

    ETH is now trading just above its pivot level of $3,998 and moving in a bullish ascending channel. The price of ETHUSD is about to break its classic resistance level of $4,048, its Fibonacci resistance level of $4,035, and is now aiming towards the $4,200 handle in the US trading session.

    All the major technical indicators are giving a STRONG BUY signal.

    ETH is now trading above its 100 hourly and below its 200 hourly simple moving averages.

    • Ethereum trend reversal seen above $3,600
    • Short-term range appears to be bullish for ETHUSD
    • All the moving averages are giving a BUY signal
    • Average true range is indicating LESS market volatility


    Ether: Bullish Reversal towards $4,200 Confirmed


    ETHUSD has recovered from its losses and is now moving in the consolidation phase below the $4,200 handle in the European trading session.

    Stoch and average directional change are indicating a NEUTRAL market.

    We can see a 34.50% increase in the trading volume as compared to yesterday, because the market was in a consolidation phase, and today, new buyers have entered as the bullish pattern is clearly visible.

    ETH has gained +4.58% with a price change of +176.90$ in the past 24hrs and has a trading volume of 26.810 billion USD.

    The Week Ahead

    Ether is now waiting for its next move against the US dollar. We can see that the price continues to hold above the important psychological support level of $4,000.

    The medium to long-term outlook for Ether remains bullish with targets of $4,500 to $5,000 in January 2022.

    This is also a time when long-term investors tend to liquidate their holdings and withdraw the profits. Because of the coming end-of-year Christmas and New Year holidays, the liquidity will remain low and the advances limited.

    We have detected an MA5 crossover pattern which signifies a bullish trend in the coming days. A bullish crossover pattern is also seen in the MA100.

    Technical Indicators:

    Ultimate oscillator: at 54.75 indicating a BUY

    Moving averages convergence divergence (14-day): at 54.07 indicating a BUY

    Commodity channel index (14days): at 34.51 indicating a NEUTRAL market

    Rate of price change: at 8.161 indicating a BUY

    Read Full on FXOpen Company Blog...

  6. #296
    Junior Member FXOpen Trader's Avatar
    Join Date
    Dec 2020
    Location
    Asia
    Posts
    1,763
    AUD/USD and NZD/USD Remains Supported On Dips


    AUD/USD gained pace after there was a clear move above 0.7200. NZD/USD is correcting gains, but dips might be limited below the 0.6750 support.

    Important Takeaways for AUD/USD and NZD/USD

    • The Aussie Dollar started a steady rise above the 0.7200 resistance against the US Dollar.
    • There is a key bullish trend line forming with support near 0.7135 on the hourly chart of AUD/USD.
    • NZD/USD rallied towards the 0.6840 level before there was a downside correction.
    • There was a break above a major bearish trend line with resistance near 0.6765 on the hourly chart of NZD/USD.


    AUD/USD Technical Analysis

    The Aussie Dollar started a major increase after it formed a base above the 0.7100 level against the US Dollar. The AUD/USD pair gained pace for a move above the 0.7200 for sustained upward move.

    The pair even broke the 0.7220 resistance zone and the 50 hourly simple moving average. It traded as high as 0.7223 on FXOpen before it started a downside correction. There was a move below the 0.7210 and 0.7200 levels.

    AUD/USD Hourly Chart


    The pair traded below the 23.6% Fib retracement level of the upward move from the 0.7093 swing low to 0.7223 high. The pair is now testing the 0.7155 level and the 50 hourly simple moving average.

    It is finding bids near the 50% Fib retracement level of the upward move from the 0.7093 swing low to 0.7223 high. There is also a key bullish trend line forming with support near 0.7135 on the hourly chart of AUD/USD.

    If there is a downside break below the 0.7135 support, the pair could extend its decline towards the 0.7100 level. On the upside, an immediate resistance is near the 0.7180 level.

    The next major resistance is near the 0.7200 level. A close above the 0.7200 level could start a steady increase in the near term. The next major resistance could be 0.7250.

    Read Full on FXOpen Company Blog...

  7. #297
    Junior Member FXOpen Trader's Avatar
    Join Date
    Dec 2020
    Location
    Asia
    Posts
    1,763
    GBP/USD Continues To Struggle, USD/CAD Gains Momentum


    GBP/USD failed to recover and declined below the 1.3250 support. USD/CAD is rising and is showing positive signs above the 1.2850 support.

    Important Takeaways for GBP/USD and USD/CAD

    • The British Pound started a fresh decline from the 1.3375 resistance zone.
    • There was a break below a key bullish trend line with support near 1.3235 on the hourly chart of GBP/USD.
    • USD/CAD started a major increase above the 1.2780 and 1.2800 resistance levels.
    • There is a major bullish trend line forming with support near 1.2810 on the hourly chart.


    GBP/USD Technical Analysis

    After a major decline, the British Pound found support above 1.3180 against the US Dollar. GBP/USD started a recovery wave above the 1.3300 level, but it failed to continue higher.

    A high was formed near 1.3374 on FXOpen and the pair started a fresh decline. There was a break below the 1.3320 and 1.3300 support levels. The pair traded below the 50% Fib retracement level of the upward move from the 1.3173 swing low to 1.3374 high.

    GBP/USD Hourly Chart


    It is now trading below the 1.3250 level and the 50 hourly simple moving average. There was a break below a key bullish trend line with support near 1.3235 on the hourly chart of GBP/USD.

    An immediate resistance is near the 1.3250 level. The first major resistance is near the 1.3300 level. If there is an upside break above the 1.3300 zone, the pair could rise towards 1.3350.

    The next key resistance could be 1.3375, above which the pair could gain strength. On the downside, the first key support is near the 1.3220 area. It is near the 76.4% Fib retracement level of the upward move from the 1.3173 swing low to 1.3374 high.

    If there is a break below 1.3220, the pair could decline extend its decline. The next key support is near the 1.3200 level. Any more losses might call for a test of the 1.3150 support.

    Read Full on FXOpen Company Blog...

  8. #298
    Junior Member FXOpen Trader's Avatar
    Join Date
    Dec 2020
    Location
    Asia
    Posts
    1,763
    Will 2022 Be the Year of the Japanese Yen?


    The Japanese yen (JPY) was one of the currencies that depreciated the most this year. Even in the late December trading, the JPY is at its yearly lows, especially against the dollar.

    This is somehow surprising, considering the Fed’s tapering, but stocks outperformed during the year, justifying the weakness in the JPY pairs.

    The yen is viewed as a safe-haven currency that appreciates in times of uncertainty and depreciates when the stock market is bullish. But recently, the JPY pairs’ rally has been stalling. For instance, the USD/JPY pair had difficulty finding buyers above 115, while the EUR/JPY found sellers above 133.

    Is the change in leadership good for the JPY? The newly appointed Prime Minister Fumio Kishida has big spending plans to stimulate Japanese economic growth, which might be key to how the JPY will perform in 2022.


    Three Reasons to Buy the JPY in 2022

    To start with, the economic recovery in Japan lagged the one in other parts of the world. A late vaccination campaign led to a delay in the economic reopening. Thus, the economy may move near to its full potential going forward.

    A brighter economic outlook should bode well for inflation. Forecasts point to inflation moving higher in the period ahead but to remain far from the 2% target. In any case, inflationary problems are not exacerbated in Japan, compared to rival economies, which may further spur economic growth, thus favoring the currency.

    Finally, there is a whopping accumulation of 3.7% of GDP in excess savings. Consumers choose to save for various reasons, such as the COVID-19 pandemic uncertainties, but, when injected into the economy, these funds will support further economic expansion.

    For many years, the JPY has been perceived as a safe-haven currency, just like the Swiss franc. Is it time for the JPY to start reflecting the strength of the local economy? If that is the case, stronger than expected economic growth should trigger a more dominant JPY in the year ahead.

    FXOpen Blog

  9. #299
    Junior Member FXOpen Trader's Avatar
    Join Date
    Dec 2020
    Location
    Asia
    Posts
    1,763
    The Pound regains its losses against the Euro; will it continue?


    November has been an interesting time for the Euro, as the Eurozone's economic leaders have been dominating the headline news throughout November and December.

    Unlike the economic landscape of the United States or Britain, home to the Euro's major currency pair rivals, the member states within the European Union that are the most economically important to the Eurozone have been subjected to clear and defined sets of restrictions which have in some cases excluded entire demographics from conducting business.

    A few days ago, the Euro plunged to a new four-week low, however it had begun to rebuild its position against the Pound, with many traders appearing to show a bearish perspective for the immediate future value of the Pound, largely because of the general consensus that there could be a lockdown implemented in the United Kingdom within the next few days.

    This morning, however, the talks which were set to be held by the British government were postponed until after the holiday period, meaning that it is very likely that there will be no lockdown in the United Kingdom, and businesses will be able to operate as usual. Given that this particular period of the year is usually a time during which many people take time out from work and spend on two things; entertainment and shopping.

    Traditionally, the British High Street is the place of choice for many people on the day after Christmas Day, when bargains are to be had and millions of Pounds are spent in retail shops.

    Had they been forced to close, that would have put a large percentage of British business in a no-revenue situation.

    Prior to the shopping comes the reveling. On Christmas Eve, many people head out to town centres to enjoy food and drink, and with the hospitality sector in full swing and no Christmas lockdown looming, the cash will likely flow freely.

    Meanwhile in Europe, some experienced analysts and traders are considering the likelihood of an extensive shutdown, which many see as a catalyst which could drive markets down, therefore are looking to hedge their assets and cover themselves.

    For that reason, The Euro is now quite volatile against the British Pound, with the GBPEUR pair rising back up to 1.17 from its dip earlier this week, and having gone out of its 4-week low at the end of last week.

    Whilst the lockdowns and restrictions in Europe may not have yet traveled across the English Channel, there is still a cautious sentiment among traders of the Pound and FTSE 100 stock in case there is a reintroduction of restrictions before New Year's Day.

    Hospitality and airline stocks are definitely ones to watch, but the main interest here will likely be currencies as the difference between the ability to spend the holiday period doing retail therapy and socializing in bars and restaurants may differ between Europe and the United Kingdom, therefore leading to less potential revenues for retail and hospitality businesses and an economy even more bruised compared to one that may be able to recouperate some of its losses.

    Either way, volatility in the GBPEUR pair is a rarity, and perhaps one to keep an eye on over the next few days.

    FXOpen Blog

  10. #300
    Junior Member FXOpen Trader's Avatar
    Join Date
    Dec 2020
    Location
    Asia
    Posts
    1,763
    BTCUSD and XRPUSD Technical Analysis – 21st DEC, 2021


    BTCUSD: Double Bottom Pattern Above $45,000

    Bitcoin started the week on a bearish tone by breaking the $46,000 handle, and touching a low of $45,578 in yesterday’s US trading session.

    After this decline, we saw a renewed buying pressure which continues to push the prices higher in today’s European trading session.

    The global fall in cryptocurrencies is happening because of the emergence of the Omicron coronavirus variant, as well as the approaching ending of the year whereby the investments in the financial markets is at its lowest.

    Bitcoin has gone back in the bullish channel and been trading above the $48,000 handle; we could see more upsides in the range of $49,000 to $49,500 later today.

    Now, we can clearly see a double-bottom bullish reversal pattern above the $45,000 handle signifying the end of a downtrend and a shift towards an uptrend.

    At present, the bitcoin price is trading in a consolidation phase above the $48,000 handle, which is expected to continue in the US trading session.

    Both the Stoch and StochRSI are indicating an OVERBOUGHT level meaning that in the immediate short-term, a decline is expected.

    Bitcoin is now moving above its both 100 hourly simple and exponential moving averages.

    The average true range is indicating a lesser market volatility, which means that markets will enter a consolidation phase soon.

    • Bitcoin trend reversal is seen above $45,000
    • The Williams percent range is Indicating an OVERBOUGHT level
    • The price is now trading just above its pivot level of $48,572
    • All the moving averages are giving a STRONG BUY signal at the current market level of $48,676


    Bitcoin’s Bullish Reversal Above $45,000 Confirmed


    We can now see that the bullish trend for bitcoin remains intact, and the prices are expected to cross the important psychological resistance level of $50,000 very soon.

    All of the major technical indicators are giving a STRONG BUY signal, which means that we can expect a fresh rally coming into the markets any time.

    The price of BTCUSD is now facing its classic resistance level of $48,691 and Fibonacci resistance level of $48,808, after which the path towards $50,000 will get cleared.

    In the last 24hrs, BTCUSD has gone UP by 5.17% with a price change of $2,393, and has a 24hr trading volume of USD 31.610 billion. We can see an Increase of 11.33% in the trading volume as compared to yesterday. This increase happened thanks to the increased buying pressure after the confirmation of the bullish channel.

    The Week Ahead

    We can see that bitcoin has started its long overdue upside correction, and the price has reached the consolidation level above the $48,000 mark.

    The medium to long-term outlook remains BULLISH for bitcoin with targets of $52,000 to $55,000.

    The relative strength index is above 70, indicating a stronger demand for buying BTCUSD in the markets.

    At present, long-term buyers can enter into markets with a time frame of 6 months to 1 year.

    90% of Bitcoins Mined

    Over the course of 12 years, 90% of all bitcoins have been mined, explaining the increase in global circulation levels and market liquidity of available coins.

    According to the Bitcoin founder Satoshi Nakamoto, the total supply is 21 million; the mining of the remaining 10%, however, will take 120 years due to the halving process.

    Crypto in 2021

    In 2021, we saw massive inflows in crypto and bitcoin, something that led to the increase in total market capitalization and massive gains for long-term investors who had invested in the beginning of the year.

    In total, we saw capital inflow of more than USD 30 billion — this is why 2021 has been nicknamed the Year of Crypto. In comparison, the capital inflow in 2018 was at USD 8 billion, the second best year for crypto investors globally.

    Technical Indicators:

    Relative strength index (14-day): at 73.68 indicating a BUY

    Average directional change (14-day): at 47.40 indicating a BUY

    Rate of price change: at 5.542 indicating a BUY

    Moving averages convergence divergence (12,26): at 496.50 indicating a BUY

    Read Full on FXOpen Company Blog...

Page 30 of 146 FirstFirst ... 20 28 29 30 31 32 40 80 130 ... LastLast

Bookmarks

Posting Permissions

  • You may not post new threads
  • You may not post replies
  • You may not post attachments
  • You may not edit your posts
  •