Page 80 of 164 FirstFirst ... 30 70 78 79 80 81 82 90 130 ... LastLast
Results 791 to 800 of 1639

Daily Market Analysis By FXOpen

This is a discussion on Daily Market Analysis By FXOpen within the Analytics and News forums, part of the Trading Forum category; EUR/USD Technical Analysis on April 19, 2023 EUR/USD Struggles Below 1.1000 While USD/JPY Aims Higher EUR/USD started a downside correction ...


  1. #791
    Junior Member FXOpen Trader's Avatar
    Join Date
    Dec 2020
    Location
    Asia
    Posts
    2,040
    EUR/USD Technical Analysis on April 19, 2023


    EUR/USD Struggles Below 1.1000 While USD/JPY Aims Higher

    EUR/USD started a downside correction from the 1.1075 resistance. USD/JPY is rising and might rally further above the 134.30 resistance.

    Important Takeaways for EUR/USD and USD/JPY

    • The Euro struggled to stay above 1.1000 and corrected lower.
    • There is a key bearish trend line forming with resistance near 1.0990 on the hourly chart of EUR/USD at FXOpen.
    • USD/JPY is showing a lot of bullish signs above the 133.85 support zone.
    • There is a major bearish trend line forming with resistance near 134.30 on the hourly chart at FXOpen.


    EUR/USD Technical Analysis


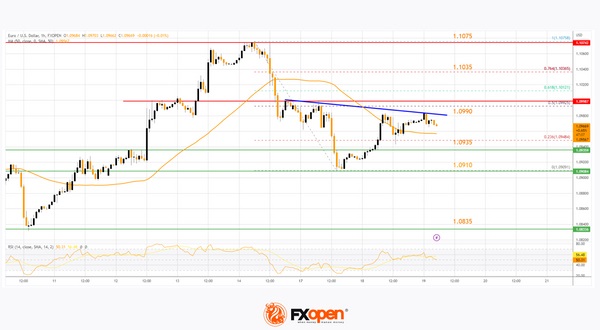
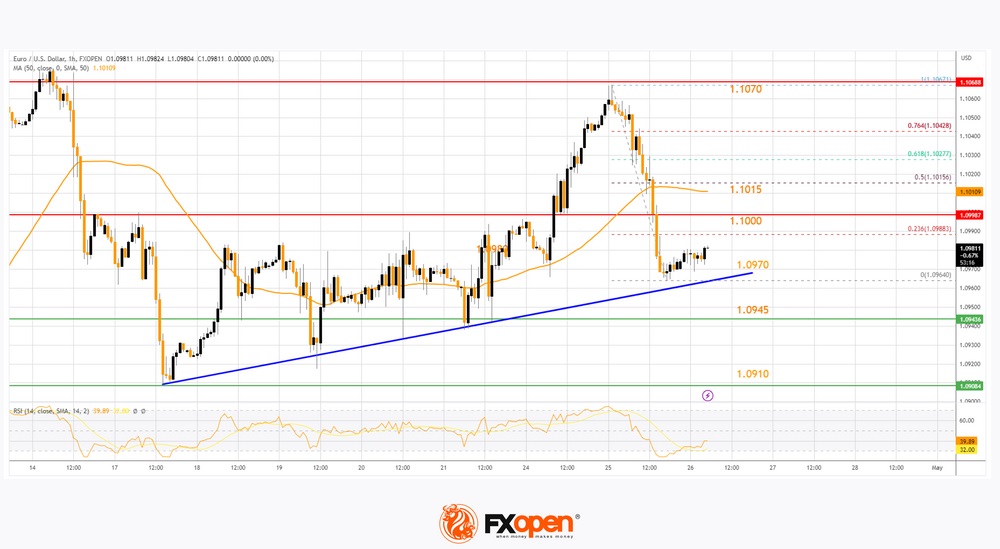
    On the hourly chart of EUR/USD at FXOpen, the pair struggled to clear the 1.1075 resistance. The Euro started a fresh decline below 1.1000 against the US Dollar.

    There was a drop below the 1.0935 support but the bulls were active near the 1.0910 support. A low is formed near 1.0909 and the pair is now attempting a fresh increase. There was a break above the 1.0935 level and the 50-hour simple moving average.

    It is now facing resistance near a key bearish trend line forming with resistance near 1.0990. The trend line is close to the 50% Fib retracement level of the downward move from the 1.1075 swing high to the 1.0910 low.

    The next major resistance is near the 76.4% Fib retracement level of the downward move from the 1.1075 swing high to the 1.0910 low at 1.1035. An upside break above 1.1035 could set the pace for another increase. In the stated case, the pair might visit 1.1075. Any more gains might send the pair towards 1.1150.

    If not, EUR/USD might decline again below the 1.0935 support. The first major support is near the 1.0910 level, below which the pair could start a major decline. In the stated case, the pair might dive toward the 1.0835 support zone.

    VIEW FULL ANALYSIS VISIT - FXOpen Blog...

    Disclaimer: This Forecast represents FXOpen Companies opinion only, it should not be construed as an offer, invitation or recommendation in respect to FXOpen Companies products and services or as Financial Advice.

  2. #792
    Junior Member FXOpen Trader's Avatar
    Join Date
    Dec 2020
    Location
    Asia
    Posts
    2,040
    ETHUSD Technical Analysis on April 20, 2023


    Three Inside Down Pattern Is Below $2,140


    Bulls couldn't keep control of the market, and after touching a high of $2,140 on 16 April, the ETH/USD pair declined, touching a low of $1,923 today in the early Asian trading session.

    ETHUSD is under bearish pressure after falling below the $2,000 psychological support level as the global investor sentiment appears weak after the Shanghai upgrade.

    The three inside down pattern is below the $2,140 handle on the H1 timeframe. It's a bearish pattern, which signifies the end of a bullish phase. Also, there is a bearish harami pattern in the H2 timeframe.

    ETH is back under the pivot point, indicating the bearish pressure in the market.

    The relative strength index is at 37.74, indicating very weak demand for Ether and a continuation of the selling pressure in the market.

    The STOCHRSI is giving an overbought signal, meaning that the price is expected to decline in the short-term range.

    We also detected the formation of the bearish harami pattern in both the 30-minute and 1-hour timeframe.

    Most of the technical indicators are bearish. Most moving averages are bearish at the current market level of $1,944.

    ETH is now trading below the 100-hour simple and 200-hour exponential moving averages.

    • ETH bearish reversal is seen below the $2,140 mark.
    • The short-term range is expected to be strongly bearish.
    • The average true range indicates low market volatility.


    VIEW FULL ANALYSIS VISIT - FXOpen Blog...

    Disclaimer: This Forecast represents FXOpen Companies opinion only, it should not be construed as an offer, invitation or recommendation in respect to FXOpen Companies products and services or as Financial Advice.

  3. #793
    Junior Member FXOpen Trader's Avatar
    Join Date
    Dec 2020
    Location
    Asia
    Posts
    2,040
    LTCUSD Technical Analysis on April 20, 2023


    Bearish Engulfing Pattern Is Below $103.38


    Bulls couldn't keep control of the market last week, and after touching a high of $103.38 on 18 April, the price declined against the US Dollar, touching a low of $89.06 today in the early Asian trading session.

    There is a bearish engulfing pattern below the $103.38 handle on the H1 timeframe. It signifies the end of a bullish phase and the start of a bearish phase in the market.

    The MACD has crossed down its moving average in the daily timeframe. Also, Litecoin is trading below its 100-hour simple moving average, 200-hour exponential moving average, and pivot level of $91.04.

    The relative strength index is at 30.14, indicating very weak demand for Litecoin and the continuation of the selling pressure in the markets.

    Litecoin remains below all of the moving averages, which are giving a bearish signal at current market levels of $90.37.

    The STOCHRSI is signaling overbought market conditions, which means that the price is expected to decline in the short term.

    The short-term outlook for Litecoin has turned strongly bearish.

    • All technical indicators a bearish
    • Litecoin bearish reversal is seen below the $103.38 level.
    • The RSI is bearish.
    • The average true range indicates low market volatility.


    VIEW FULL ANALYSIS VISIT - FXOpen Blog...


    Disclaimer: This Forecast represents FXOpen Companies opinion only, it should not be construed as an offer, invitation or recommendation in respect to FXOpen Companies products and services or as Financial Advice.

  4. #794
    Junior Member FXOpen Trader's Avatar
    Join Date
    Dec 2020
    Location
    Asia
    Posts
    2,040
    Technical Analysis on April 21, 2023


    AUD/USD and NZD/USD At Risk of More Losses

    AUD/USD started a fresh decline from the 0.6770 resistance zone. NZD/USD is also moving lower and might decline below the 0.6150 support.

    Important Takeaways for AUD/USD and NZD/USD

    • The Aussie Dollar started a fresh decline below the 0.6740 support against the US Dollar.
    • There is a key bullish trend line forming with support at 0.6715 on the hourly chart of AUD/USD at FXOpen.
    • NZD/USD failed to clear the 0.6220 resistance zone and reacted to the downside.
    • There is a major bearish trend line forming with resistance near 0.6180 on the hourly chart of NZD/USD at FXOpen.


    AUD/USD Technical Analysis


    On the hourly chart of AUD/USD at FXOpen, the pair faced rejection near 0.6770. The Aussie dollar started a fresh decline and traded below the 0.6740 support against the US Dollar.

    There was a move below the 61.8% Fib retracement level of the upward move from the 0.6697 swing low to the 0.6771 high. It is now trading below the 50-hour simple moving average. It seems like there is a major support waiting near a key bullish trend line with support at 0.6715.

    The trend line coincides with the 76.4% Fib retracement level of the upward move from the 0.6697 swing low to the 0.6771 high. If there is a downside break below the trend line, the pair could decline toward 0.6690.

    The next support could be the 0.6660 level, below which the bears could aim for a test of the 0.6600 zone in the coming days.

    On the upside, the AUD/USD pair is facing resistance near the 0.6740 level. The next major resistance is near the 0.6770 level. A close above the 0.6770 level could start another steady increase in the near term. The next major resistance could be 0.6850.

    VIEW FULL ANALYSIS VISIT - FXOpen Blog...

    Disclaimer: This Forecast represents FXOpen Companies opinion only, it should not be construed as an offer, invitation or recommendation in respect to FXOpen Companies products and services or as Financial Advice.

  5. #795
    Junior Member FXOpen Trader's Avatar
    Join Date
    Dec 2020
    Location
    Asia
    Posts
    2,040
    Watch FXOpen's April 17 - 21 Weekly Market Wrap Video

    In this video, FXOpen UK COO Gary Thomson sums up the week’s happenings and discusses the most significant news reports.

    • Swiss tsunami rips through global markets: FTSE 100 wipeout noticeable
    • Abnormal balance in energy markets
    • FTSE 100 is back on track, but 8,000 points are still out of reach
    • European stocks at historic highs
    • NASDAQ hangs in the doldrums despite optimism around big tech earnings


    Watch our short and informative video, and stay updated with FXOpen.


    FXOpen YouTube


    Disclaimer: This forecast represents FXOpen Companies opinion only, it should not be construed as an offer, invitation or recommendation in respect to FXOpen Companies products and services or as financial advice.

    #fxopen #fxopenyoutube #fxopenuk #weeklyvideo

  6. #796
    Junior Member FXOpen Trader's Avatar
    Join Date
    Dec 2020
    Location
    Asia
    Posts
    2,040
    GBP/USD Eyes Bullish Breakout While EUR/GBP Consolidates Losses


    GBP/USD is eyeing a key upside break above the 1.2470 resistance zone. EUR/GBP is now consolidating losses above the 0.8825 support.

    Important Takeaways for GBP/USD and EUR/GBP

    • The British Pound is slowly moving higher from the 1.2365 support against the US Dollar.
    • There is a key bearish trend line forming with resistance near 1.2440 on the hourly chart of GBP/USD at FXOpen.
    • EUR/GBP started a downside correction from the 0.8860 resistance zone.
    • There is a major bullish trend line forming with support near 0.8825 on the hourly chart at FXOpen.


    GBP/USD Technical Analysis


    On the hourly chart of GBP/USD at FXOpen, the pair found support near the 1.2365 zone. The British Pound formed a base and started a decent increase above the 1.2400 resistance against the US Dollar.

    The pair even spiked above 1.2440 and the 50-hour simple moving average. However, upsides remained capped near the 1.2470 zone. The pair is now consolidating near the 50-hour simple moving average and the 23.6% Fib retracement level of the upward move from the 1.2367 swing low to the 1.2451 high.

    On the downside, there is a major support forming near the 61.8% Fib retracement level of the upward move from the 1.2367 swing low to the 1.2451 high at 1.2400.

    The next major support is near the 1.2365 level. If there is a downside break below the 1.2365 support, there is a risk of a sharp decline. In the stated case, GBP/USD may perhaps revisit the 1.2300 support. Any more losses could lead the pair toward the 1.2250 support.

    On the upside, resistance is near a key bearish trend line at 1.2440. The pair might attempt a fresh increase if the RSI stays above 50. The next major resistance is near the 1.2470 level. A clear move above the 1.2470 level could spark a rally toward the 1.2540 level.

    VIEW FULL ANALYSIS VISIT - FXOpen Blog...

    Disclaimer: This Forecast represents FXOpen Companies opinion only, it should not be construed as an offer, invitation or recommendation in respect to FXOpen Companies products and services or as Financial Advice.

  7. #797
    Junior Member FXOpen Trader's Avatar
    Join Date
    Dec 2020
    Location
    Asia
    Posts
    2,040
    BTC/USD: Bullish Engulfing Pattern Above $26,981


    Bitcoin continues its bullish momentum from last week, and after touching a low of $26,981 on April 24, we can see a move towards a consolidation phase, after which we are expecting upsides in the range of $28500 and $302000.

    We can clearly see a bullish engulfing pattern above the $26,981 handle on the H1 timeframe.

    Bitcoin continues to move in a consolidation phase, after which we can see upside moves towards the $28,000 handle.

    Both the STOCH and Williams’ percent range indicate overbought levels, which means that in the immediate short term, a decline in the price is expected.

    We can also see the formation of bullish Harami pattern in the 1, 2 and 4 hourly timeframes.

    The relative strength index is at 58.23, indicating a strong demand for Bitcoin and the continuation of the buying pressure in the markets.

    Bitcoin is now moving above its 200-hour exponential moving average and above its 200-hour exponential moving average.

    Most of the major technical indicators are giving a bullish signal, which means that in the immediate short term, we are expecting targets of $28,500 and $30,000.

    The average true range indicates high market volatility with mild bullish momentum.

    • Bitcoin bullish continuation is seen above $26,981.
    • The RSI remains above 50, indicating a bullish market.
    • The price is now trading below its pivot level of $28,516.
    • The short-term range is mildly bullish.
    • Some major technical indicators signal that the price may move to $28,000 and $29,500 soon.


    VIEW FULL ANALYSIS VISIT - FXOpen Blog...

    Disclaimer: This Forecast represents FXOpen Companies opinion only, it should not be construed as an offer, invitation or recommendation in respect to FXOpen Companies products and services or as Financial Advice.

  8. #798
    Junior Member FXOpen Trader's Avatar
    Join Date
    Dec 2020
    Location
    Asia
    Posts
    2,040
    XRP/USD: Three Inside UP Pattern is Above $0.4404


    Last week, the market sentiment remained indecisive after Ripple touched a low of $0.4404 on April 21 and started to correct upwards. The market opened bullish this week.

    On the hourly chart:

    • The relative strength index is at 53.79, which signifies a neutral demand for Ripple at the current market prices and the continuation of the bullish phase in the market.
    • Moving averages signal an upward price movement at the current market level of 0.4556.
    • Both the STOCHRSI and Williams’s percent range are in the neutral zones, which means the price is expected to consolidate further.
    • Ripple is now trading just below its pivot level of 0.4560 and is facing its classic resistance at 0.4574 and facing Fibonacci resistance at 0.4587, after which it will be able to move towards 0.4800.
    • The prices are ranging near the horizontal support.
    • CCI indicator is giving a bullish divergence signal.


    Some of the major technical indicators are bullish.

    • Ripple bullish reversal is seen above 0.4404.
    • The price is below its pivot level.
    • Average true range indicates High volatility.


    We have also detected that MACD crosses UP its moving average in the 15-minutes timeframe.


    VIEW FULL ANALYSIS VISIT - FXOpen Blog...

    Disclaimer: This Forecast represents FXOpen Companies opinion only, it should not be construed as an offer, invitation or recommendation in respect to FXOpen Companies products and services or as Financial Advice.

  9. #799
    Junior Member FXOpen Trader's Avatar
    Join Date
    Dec 2020
    Location
    Asia
    Posts
    2,040
    EUR/USD Corrects Gains While USD/CHF Signals Upside Break


    EUR/USD started a downside correction from the 1.1070 resistance. USD/CHF is rising and might aim for more gains above the 0.8930 resistance.

    Important Takeaways for EUR/USD and USD/CHF

    • The Euro started a fresh decline from the 1.1070 resistance against the US Dollar.
    • There is a key bullish trend line forming with support near 1.0970 on the hourly chart of EUR/USD at FXOpen.
    • USD/CHF started a fresh increase above the 0.8900 resistance zone.
    • There was a break above a major bearish trend line with resistance near 0.8895 on the hourly chart at FXOpen.


    EUR/USD Technical Analysis


    On the hourly chart of EUR/USD at FXOpen, the pair faced rejection near the 1.1070 level. The Euro started a downside correction from the 1.1072 resistance against the US Dollar.

    There was a move below the 50-hour simple moving average at 1.1015. The pair dipped below the 1.1000 support before the bulls appeared near 1.0970 when the RSI reached oversold conditions. There is also a key bullish trend line forming with support near 1.0970.

    The pair is now consolidating and facing resistance near the 1.1000 level. The first major resistance is near the 50-hour simple moving average at 1.1015. It coincides with the 50% Fib retracement level of the downward move from the 1.1067 swing high to the 1.0964 low.

    An upside break above the 1.1015 level might send the pair toward the 76.4% Fib retracement level of the downward move from the 1.1067 swing high to the 1.0964 low.

    The next major resistance is near the 1.1070 level. Any more gains might open the doors for a move toward the 1.1120 level. If there is no move above 1.1015, the pair might start a fresh decline. On the downside, immediate support is near the trend line at 1.0970.

    The next major support is near the 1.0945 level. A downside break below the 1.0945 support could start a steady decline toward the 1.0910 level.

    VIEW FULL ANALYSIS VISIT - FXOpen Blog...

    Disclaimer: This Forecast represents FXOpen Companies opinion only, it should not be construed as an offer, invitation or recommendation in respect to FXOpen Companies products and services or as Financial Advice.

  10. #800
    Junior Member FXOpen Trader's Avatar
    Join Date
    Dec 2020
    Location
    Asia
    Posts
    2,040
    AUDUSD Analysis: Breakout of Important Support


    Yesterday's report showed that inflation in Australia in the first quarter of 2023 fell from a 33-year high. The consumer price index rose only by 1.4% in annual terms, although analysts had expected +1.9%.

    Now market participants are focusing on the meeting of the Reserve Bank of Australia on May 2; it is expected that it will resume raising rates and thereby complete the pause made after a series of 10 increases.

    Reacting to the news, the Australian dollar broke through the low of April, while the daily AUDUSD chart shows that the market as a whole looks weak, because:

    → important support (1), which has been in effect since autumn 2022, has been breached;

    → rebounds from this line were weak, the price did not reach the median line (2);

    → MA (200) points down.

    The bears may make even more progress today, as at 15:30 (GMT+3) the US GDP and unemployment news will be published, which may strengthen the USD.


    VIEW FULL ANALYSIS VISIT - FXOpen Blog...

    Disclaimer: This Forecast represents FXOpen Companies opinion only, it should not be construed as an offer, invitation or recommendation in respect to FXOpen Companies products and services or as Financial Advice.

Page 80 of 164 FirstFirst ... 30 70 78 79 80 81 82 90 130 ... LastLast

Bookmarks

Posting Permissions

  • You may not post new threads
  • You may not post replies
  • You may not post attachments
  • You may not edit your posts
  •