
 LinkBack URL
 About LinkBacks


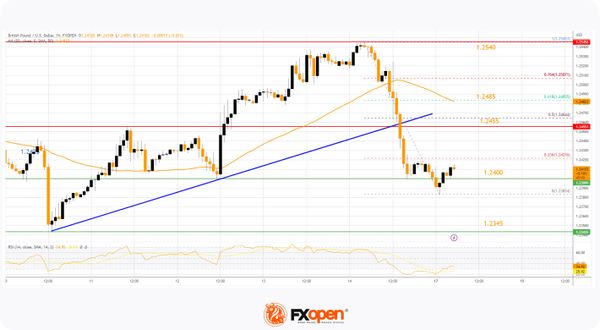
ETHUSD Technical Analysis on April 13, 2023
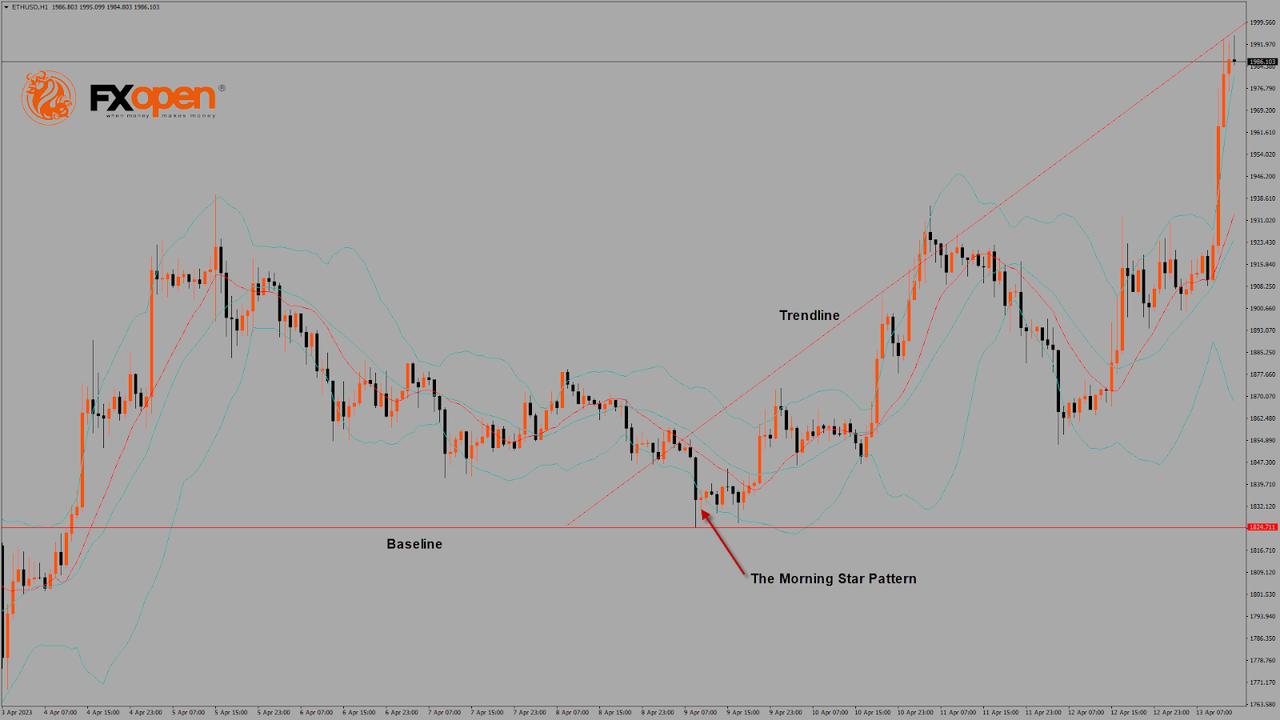
The Morning Star Pattern Is Above $1,824
Bears couldnt keep control of the market, and ETH/USD started to correct upwards after touching a low of $1,763 on 9 April.
ETHUSD is now moving under a strong bullish momentum after crossing the $2,000 resistance and may touch $2,100 and $2,200 levels.
The morning star pattern is above the $1,824 handle on the H1 timeframe. Its a bullish pattern, which signifies the end of a bearish phase.
The relative strength index is at 78.57, indicating a strong demand for Ether and a continuation of the buying pressure in the markets.
The STOCHRSI and Williamss percent range give an overbought signal, meaning that the price is expected to decline in the short-term range.
Most of the technical indicators are bullish. Most moving averages are bullish.
ETH is now trading above the 100-hour simple and 200-hour exponential moving averages.
- Ether bullish reversal is seen above the $1,824 mark.
- The short-term range is expected to be strongly bullish.
- The average true range indicates low market volatility.
VIEW FULL ANALYSIS VISIT - FXOpen Blog...
Disclaimer: This Forecast represents FXOpen Companies opinion only, it should not be construed as an offer, invitation or recommendation in respect to FXOpen Companies products and services or as Financial Advice.


 Reply With Quote


Bookmarks