Page 29 of 145 FirstFirst ... 19 27 28 29 30 31 39 79 129 ... LastLast
Results 281 to 290 of 1442

Daily Market Analysis By FXOpen

This is a discussion on Daily Market Analysis By FXOpen within the Analytics and News forums, part of the Trading Forum category; GBP/USD and GBP/JPY At Risk of More Downsides GBP/USD started a fresh decline and traded below the 1.3300 support zone. ...


  1. #281
    Junior Member FXOpen Trader's Avatar
    Join Date
    Dec 2020
    Location
    Asia
    Posts
    1,751
    GBP/USD and GBP/JPY At Risk of More Downsides


    GBP/USD started a fresh decline and traded below the 1.3300 support zone. GBP/JPY is also trading in a bearish zone and is facing hurdles near 150.00.

    Important Takeaways for GBP/USD and GBP/JPY

    • The British Pound started a fresh decline after it faced sellers near 1.3360 against the US Dollar.
    • There is a major bearish trend line forming with resistance near 1.3280 on the hourly chart of GBP/USD.
    • GBP/JPY also declined heavily below the 150.00 and 150.00 support levels.
    • There is a key bearish trend line forming with resistance near 150.65 on the hourly chart.


    GBP/USD Technical Analysis

    This past week, the British Pound started a fresh decline after it failed near 1.3360 against the US Dollar. The GBP/USD pair broke the 1.3320 and 1.3300 support levels to enter a bearish zone.

    There was also a break below the 1.3260 support zone and the 50 hourly simple moving average. It traded as low as 1.3207 on FXOpen and is currently consolidating losses. It recovered a few points above the 1.3230 level.

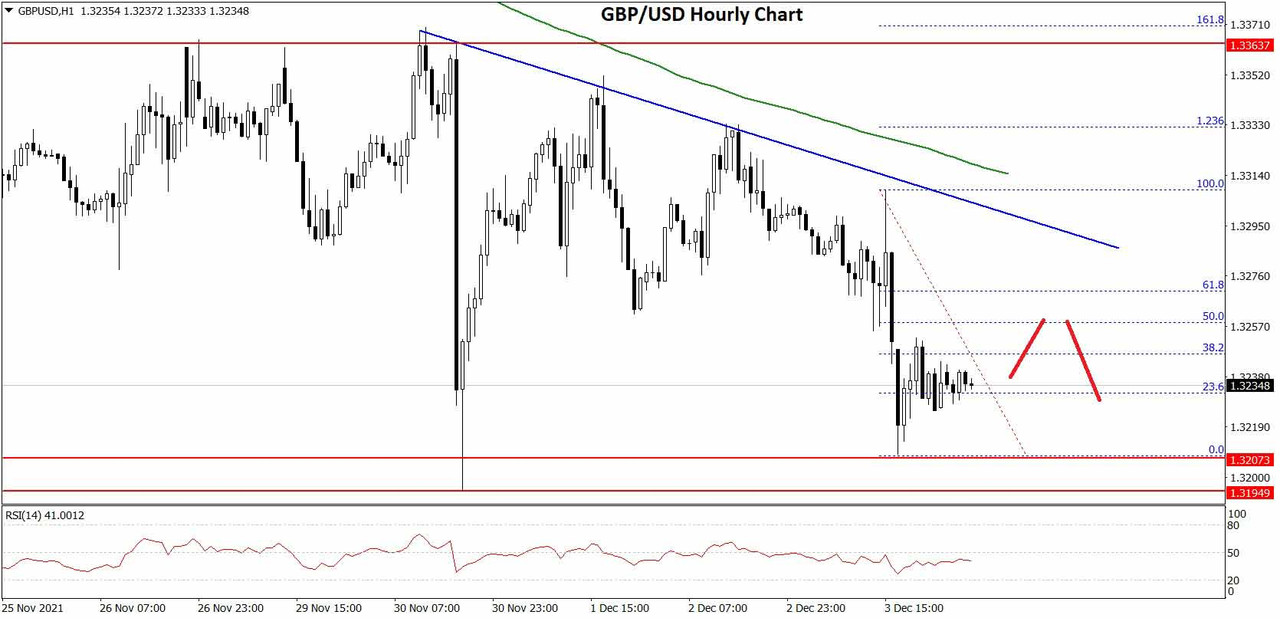
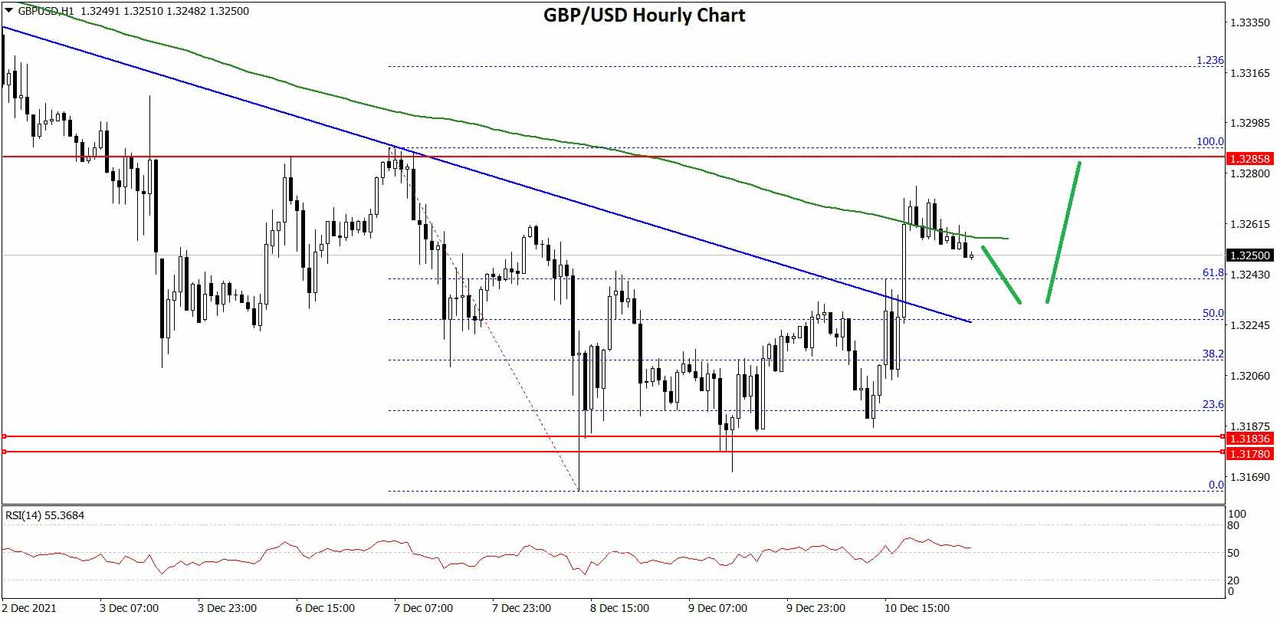
    GBP/USD Hourly Chart


    There was a break above the 23.6% Fib retracement level of the recent decline from the 1.3308 swing high to 1.3207 low.

    The pair is now facing resistance near the 1.3260 level. It is close to the 50% Fib retracement level of the recent decline from the 1.3308 swing high to 1.3207 low. There is also a major bearish trend line forming with resistance near 1.3280 on the hourly chart of GBP/USD.

    A close above the 1.3280 level could open the doors for more gains. The next major hurdle is near 1.3315 and the 50 hourly SMA, above which the pair could surge towards 1.3350.

    On the downside, an immediate support is near the 1.3220 level. The next major support is near the 1.3200 level. If there is a break below the 1.3200 support, the pair could test the 1.3150 support. If there are additional losses, the pair could decline towards the 1.3050 level.

    Read Full on FXOpen Company Blog...

  2. #282
    Junior Member FXOpen Trader's Avatar
    Join Date
    Dec 2020
    Location
    Asia
    Posts
    1,751
    Concern over winter restrictions create bull market for Gold


    There is no doubt that the aversion to risk by many traders is there for all to see, especially when looking at the falling price of physical commodities such as gold.

    As the trading week begins today on this wintery 6th of December, a quick glance at recent performance would show that gold had been down 1.21 points as it closed 0.07% down at the end of the trading day on Friday last week.

    That in itself may not seem like too much of a drop in value, but considering the steady climb that gold prices have taken during the last two years, a sudden downturn is worthy of note.

    This morning, however, it began to rise against the US dollar as the European markets open, with a general consideration among traders that the rise in price from last week's fall is down to risk aversion which has pulled down real interest rates.

    With real interest rates now in negative figures, gold is being viewed once again as a de facto store of value by investors taking a longer term view on the markets and who do not want to go in for the wild rides that the crypto market has been experiencing lately.

    Whilst the crypto market has certainly gained huge appeal among those who see it as a double-edged virtue; that being the circumvention of the centralized markets which have been subject to all manner of geopolitical circumstances recently as well as the chance to finally get into a genuinely volatile market and realize quick returns, there are still a huge number of investors worldwide who are looking to minimize their risks during times of uncertainty, and uncertain times throughout history have resulted in gold price rises.

    Another area of interest which is perhaps causing a move toward confidence in the value of gold is the potential reaction to the sensationalist news reports about Omicron, the latest nomenclature to hit the news after several previous attempts to stir up fear among the corporate world and the investing community.

    Although a week has passed since the Omicron name made its way to the public via the international press and various soundbites from global governments, there is still a degree of uncertainty as to how this will be utilized by the policymakers and therefore physical commodities are becoming favourable once again.

    Gold was down against the US dollar by 2.6 points at close of business on Friday, but begins the trading session this morning with an increase of 0.26% which can be attributed toward this sentiment considering that there are no important market announcements scheduled this week which could otherwise affect the price differences between spot FX and commodities other than the US CPI figures for November which are due to be announced on Friday.

    December is a relatively quiet month for market-related news announcements, therefore it is likely that all eyes will be on the geopolitical effect created by any reactions by governments with regard to Omicron, and whether this will drive investors toward stores of value such as gold and cryptocurrency.

    As this week gets off to a start, there certainly is some evidence toward that.

    FXOpen Blog

  3. #283
    Junior Member FXOpen Trader's Avatar
    Join Date
    Dec 2020
    Location
    Asia
    Posts
    1,751
    BTCUSD and XRPUSD Technical Analysis – 07th DEC, 2021


    BTCUSD: Rounding Bottom Pattern Above $46,000

    Bitcoin suffered heavy losses on Dec 4th, which was primarily driven by liquidation of the holdings from the long-term investors in the markets.

    Additionally, the Dec 4th bitcoin plunge occurred due to the Omicron coronavirus variant which saw BTC touching a low of $45,000.

    We saw BTCUSD touch a high of $59,157 on 30th Nov, and form a bullish momentum before entering a consolidation channel above $55,000.

    Today, bitcoin is back in the bullish channel and trading above the $50,000 handle in the European trading session.

    We can clearly see a rounding bottom pattern above the $46,000 handle which signifies that the markets have entered into a bullish uptrend.

    In the US Trading session, bitcoin is trading in a consolidation phase and is expected to continue doing so.

    The short-term outlook for bitcoin has turned MILDLY BULLISH.

    Both the Stoch and StochRSI are indicating an OVERBOUGHT level, which means that in the immediate short-term, a decline in the price is expected.

    Bitcoin is now moving above its 100 hourly simple and exponential moving averages.

    The average true range is indicating lesser market volatility which means that markets will enter a consolidation phase soon.

    • Bitcoin trend reversal is seen above $46,000
    • Stoch is indicating an OVERBOUGHT level
    • The price is now trading just below its pivot level of $51,140
    • All the moving averages are giving a BUY signal at current market level of $51,027


    Bitcoin: Trend Reversal Towards $60,000 Confirmed


    BTCUSD has already recovered its losses from last week and is now trading above the important psychological support level of $50,000.

    We will need to see a confirmation of the uptrend once the prices hit the $52,000 handle some time later today.

    Some of the major technical indicators are giving a STRONG SELL signal, which means that the prices can also get a downward correction before reaching the level of $60,000.

    The price of BTCUSD is trading below its classic resistance level of $51,345 and Fibonacci resistance level of $51,478 in the European trading session.

    In the last 24hrs, BTCUSD has gone UP by 6.62% with a price change of $3,170 and a 24hr trading volume of USD 37.942 billion. We can see an increase of 12.54% in trading volume as compared to yesterday.

    The Week Ahead

    We can see that bitcoin has recovered from last week’s losses and is on its way towards reaching the $58,000 handle this week.

    The medium to long-term outlook remains BULLISH for bitcoin with the target of $62,000. At present, the markets are giving a BUY signal, so it would be best to enter long positions in bitcoin.

    The relative strength index of 65 is indicating a BULLISH channel, and fresh buying is expected in the markets at any time.

    We can see that the fears related to Omicron are vanishing, and new investors are coming back to the markets which also explains the increased market volatility today.

    Technical Indicators:

    Stoch (9,6): at 99.04 indicating an OVERBOUGHT level

    Average directional change (14-day): at 50.66 indicating a BUY

    Rate of price change: at 4.047 indicating a BUY

    Moving averages convergence divergence (12,26): at 553.80 indicating a BUY

    Read Full on FXOpen Company Blog...

  4. #284
    Junior Member FXOpen Trader's Avatar
    Join Date
    Dec 2020
    Location
    Asia
    Posts
    1,751
    EUR/USD and EUR/JPY: Euro Eyes Fresh Increase


    EUR/USD is attempting a fresh increase from the 1.1220 support zone. EUR/JPY is rising, but it is facing hurdles near 128.30 and 128.50.

    Important Takeaways for EUR/USD and EUR/JPY

    • The Euro gained bearish momentum below 1.1350 and 1.1300.
    • There was a break above a major bearish trend line with resistance near 1.1280 on the hourly chart.
    • EUR/JPY is attempting a recovery wave above the 128.00 resistance level.
    • There is a key bullish trend line forming with support near 127.85 on the hourly chart.


    EUR/USD Technical Analysis

    The Euro started a major decline after it struggled to clear the 1.1350 resistance against the US Dollar. The EUR/USD pair broke the 1.1300 support zone to move into a bearish zone.

    The pair even traded below the 1.1250 support and settled below the 50 hourly simple moving average. A low was formed near 1.1227 on FXOpen and the pair is now correcting losses. There was a break above the 1.1260 level.

    EUR/USD Hourly Chart


    The pair even spiked above the 1.1285 resistance level. There was a clear move above a major bearish trend line with resistance near 1.1280 on the hourly chart.

    It is now facing resistance near the 1.1300 zone and the 50 hourly simple moving average. It is close to the 50% Fib retracement level of the downward move from the 1.1357 swing high to 1.1227 low. The next major resistance is near the 1.1315 level.

    It is close to the 61.8% Fib retracement level of the downward move from the 1.1357 swing high to 1.1227 low. The main resistance is forming near the 1.1320 and 1.1335 levels. A clear break above the 1.1335 resistance could push EUR/USD towards 1.1400.

    On the downside, the 1.1250 level is a major support. Any more losses might lead EUR/USD towards the 1.1200 support zone in the near term. The next major support sits near the 1.1150 level.

    Read Full on FXOpen Company Blog...

  5. #285
    Junior Member FXOpen Trader's Avatar
    Join Date
    Dec 2020
    Location
    Asia
    Posts
    1,751
    ETHUSD and LTCUSD Technical Analysis – 09th DEC, 2021


    ETHUSD: Ascending Channel Pattern Above $4,000

    Ethereum continues its consolidation phase remaining above the $,4300 handle in the European trading session today.

    ETHUSD is slowly preparing itself for its next move against the US dollar. The price continues to recover from its decline below the $4,000 level.

    We can clearly see an ascending channel pattern above $4,000 which signifies that the price will continue to rise aiming upwards of $4,500 to $4,700.

    ETH is now trading just above its pivot level of $4,374 and moving in a bullish ascending channel. The price of ETHUSD is about to break its classic resistance level of $4,418, its Fibonacci resistance level $4,403, and is now aiming towards the $4,500 handle in the US trading session.

    All the major technical indicators are giving a NEUTRAL signal.

    ETH is now trading above its 100 hourly and 200 hourly simple moving averages.

    • Ethereum continues a bullish channel
    • Short-term range appears to be bullish ETHUSD
    • All the moving averages are giving a STRONG BUY signal
    • Average true range is indicating LESSER market volatility


    Ether: Bullish Trend Towards $4,700 Confirmed


    In today’s early Asian trading session today, ETHUSD continues to move in a consolidation channel after touching an intraday high of $4,479 and an intraday low of $4,345 in the European trading session.

    Today’s relative strength index is NEUTRAL which signifies a potential bullish trend.

    It is best to enter into long positions in Ethereum at the present market level of $4,380 with a target of $5,000 for the next month.

    The average true range is indicating a lower market volatility as we can see a drop of 11.76 in the trading volume as compared to yesterday. This is because the market was in a consolidation phase and the buyers were waiting for a bullish pattern, which is clearly visible now.

    ETH has gained +0.55% with a price change of +23.84$ in the past 24hrs, and has a trading volume of 18.912 billion USD.

    Bitcoin vs Ethereum Gains in 2021


    The gains observed in Ethereum have been outstanding as compared to bitcoin during the same period of time. This is because Ether’s underlying technology is far superior to bitcoin’s, which only serves as a mode of payment transfer and Investments.

    The demand for Ethereum is currently stronger due to its leading role in the emerging industry of decentralized finance (DeFi), as well as non-fungible tokens (NFTs).

    The Week Ahead

    Ether is printing above $4,300 today, and this week, we could see a levels of $4,500.

    The medium to long-term outlook for Ether remains bullish with targets of above $5,000 the next month.

    We have observed an $10 billion increase in Ethereum’s market cap which currently stands at $520 billion.

    We have detected an MA50 crossover pattern which signifies a bullish trend in the coming days. A mullish crossover pattern is also seen in the MA20.

    Technical Indicators:

    Ultimate oscillator: at 49.448 indicating a NEUTRAL market

    Moving averages convergence divergence (14-day): at 6.88 indicating a BUY

    MA200 (exponential): at 4298.74 indicating a BUY

    Rate of price change: at 0.403 indicating a BUY

    Read Full on FXOpen Company Blog...

  6. #286
    Junior Member FXOpen Trader's Avatar
    Join Date
    Dec 2020
    Location
    Asia
    Posts
    1,751
    Gold Price Faces Hurdles While Crude Oil Price Is Recovering


    Gold price is attempting a fresh increase above the $1,785 resistance zone. Crude oil price is recovering and could gain pace if there is a clear move above the $73.20 level.

    Important Takeaways for Gold and Oil

    • Gold price is showing a few bearish signs below the $1,800 zone against the US Dollar.
    • There was a break below a key bullish trend line with support near $1,784 on the hourly chart of gold.
    • Crude oil price started a recovery wave above the $70.00 and $72.00 levels.
    • There was a break below a major bullish trend line with support near $72.30 on the hourly chart of XTI/USD.


    Gold Price Technical Analysis

    Gold price started a fresh decline from well above the $1,800 zone against the US Dollar. The price declined heavily, and it even broke the $1,780 support zone.

    The price even settled below the $1,800 level and the 50 hourly simple moving average. Finally, there was a break below the $1,770 level. A low was formed near $1,761 on FXOpen before there was a recovery wave.

    Gold price hourly chart


    The price climbed above $1,780, but it stayed below $1,800. A high was formed near $1,792 and the price corrected lower. There was a break below the $1,785 level and the $1,780 support.

    The price even traded below the 50% Fib retracement level of the upward move from the $1,761 swing low to $1,792 high. There was also a break below a key bullish trend line with support near $1,784 on the hourly chart of gold.

    However, the bulls remained active near $1,774. The price is also stable above the 61.8% Fib retracement level of the upward move from the $1,761 swing low to $1,792 high.

    An immediate resistance on the upside is near the $1,780 level and the 50 hourly simple moving average. The main resistance is near the $1,785 level. A close above the $1,785 level could open the doors for a steady increase towards $1,800.

    The next major resistance sits near the $1,820 level. On the downside, an initial support is near the $1,774 level.

    The first major support is near the $1,760 level. A downside break below the $1,760 support zone may possibly spark a steady decline. In the stated case, the price could test the $1,740 support.

    Read Full on FXOpen Company Blog...

  7. #287
    Junior Member FXOpen Trader's Avatar
    Join Date
    Dec 2020
    Location
    Asia
    Posts
    1,751
    GBP/USD Aims Recovery While EUR/GBP Is Sliding


    GBP/USD is attempting a recovery wave above the 1.3220 resistance. EUR/GBP is declining and is gaining pace below the 0.8550 level.

    Important Takeaways for GBP/USD and EUR/GBP

    • The British Pound is facing resistance near the 1.3280 and 1.3300 levels.
    • There was a break above a major bearish trend line with resistance near 1.3240 on the hourly chart of GBP/USD.
    • EUR/GBP started a fresh decline from well above the 0.8580 support level.
    • There is a major bearish trend line forming with resistance near 0.8540 on the hourly chart.


    GBP/USD Technical Analysis


    The British Pound declined heavily below the 1.3300 level against the US Dollar. The GBP/USD pair formed a base above the 1.3265 level and recently started an upside correction.

    The pair recovered above the 1.3200 resistance level. There was a break above the 50% Fib retracement level of the downward move from the 1.3289 high to 1.3163 low (formed on FXOpen). Besides, there was a break above a major bearish trend line with resistance near 1.3240 on the hourly chart of GBP/USD.

    The pair is now trading near the 1.3250 level and the 50 hourly simple moving average. It is close to the 76.4% Fib retracement level of the downward move from the 1.3289 high to 1.3163 low.

    On the upside, an initial resistance is near the 1.3265 level. If there is an upside break above the 1.3450 resistance and the 50 hourly SMA, the price could surpass 1.3280. The main resistance is near the 1.3300 zone.

    Therefore, a proper break above the 1.3300 resistance could open the doors for a steady increase. The next major resistance for the bulls could be 1.3350. If not, the pair could start a fresh decline below 1.3220. An immediate support is near the 1.3200 level.

    The first key support is near the 1.3180 level. Any more losses could lead the pair towards the 1.3150 support zone. The next major support sits near the 1.3080 level.

    Read Full on FXOpen Company Blog...

  8. #288
    Junior Member FXOpen Trader's Avatar
    Join Date
    Dec 2020
    Location
    Asia
    Posts
    1,751
    Will We See Santa Rally This December?


    As this trading, pandemic-stricken year is nearing its end, the one thing left to emphasize is the stock market's rally. Not all market indices have rallied, for example, emerging markets: their indices performed poorer than developed markets by more than 20%.

    The strongest rally happened in the United States. All major indices, Dow Jones, Nasdaq 100, and S&P 500, are nearing their all-time highs. Nothing could deter their advance. For most of the year, the tapering of asset purchases had been the main reason to expect a correction. The Fed did announce tapering, a small correction did happen, but only for bulls to step in and buy the dip again.

    With the Fed's meeting looming large next week, is it possible for stocks to reach their new all-time highs? Also, is a Santa Rally possible even with the Fed turning hawkish?

    What is a Santa Rally — and what are the chances to see one This December?
    [

    Stocks tend to rally later in December, hence the Santa Rally name. A close look at the chart above shows that the chances for a Santa Rally are quite high. Most rallies occur after December 20, and if, say, the S&P 500 goes up more than 20% YTD, as is the case this year, it will outperform the average December return. The performance record dates back to 1950, so it is fair to say the likelihood is high for the stock's rally going on.

    Furthermore, after this year’s negative November, December has delivered a positive return of 2.7% on average, with a probability of 86.3%. In other words, investors are betting on continuation of the economic recovery despite Omicron fears and the Fed's intentions to tighten the policy.

    All in all, a Santa Rally is not just a possibility but a probability; 86.3% is enough to keep buyers in control.

    FXOpen Blog

  9. #289
    Junior Member FXOpen Trader's Avatar
    Join Date
    Dec 2020
    Location
    Asia
    Posts
    1,751
    Get Ready For December’s Most Important Trading Week


    The most important trading week of the month has started, and traders are preparing for a sharp increase in volatility. No less than four central banks are expected to announce their monetary policy decisions, which will raise the currency market’s volatility.

    Moreover, the moves may be exacerbated by lower liquidity levels typical for December. After all, December is known for most of the investment houses decreasing their market activity in light of the end-of-the-year holidays.

    Inflation pressures central banks to tighten the monetary policy sooner than they would have wanted too. Last week, the US November inflation data showed that the prices of goods and services increased by 6.8% YoY, a rate not seen in the last 39 years. Therefore, the pressure on the Fed and other central banks increases to normalize their policies.


    What to expect from the FOMC meeting on Wednesday

    The Fed is due to announce its decision on Wednesday. The risk is that it will have a more hawkish tone than the markets expect as higher inflation is threatening the Fed’s mandate of price stability.

    A couple of weeks ago, the Fed’s chair, Jerome Powell, announced that it is time to stop describing inflation as “transitory”. The problem with higher inflation in the States is that it will be exported to other parts of the world due to global trade partnerships, and also to the fact that the US is the largest economy in the world.

    Three central banks to announce policy decisions on Thursday

    One day after the Fed’s decision, three central banks will announce their monetary policy stance: the Swiss National Bank, the Bank of England, and the European Central Bank. Out of the three, the focus will be on the BOE and the ECB, because the Swiss National Bank is not expected to change its policy.

    In the UK, while no rate hike is expected, the market participants will focus on the MPC asset purchase facility votes. Just like in the case of the Fed, the risk is that the BOE will be hawkish.

    Finally, the ECB is facing a tough decision. The euro was weak all year, reflecting the bank’s dovishness. On the one hand, it does not plan to hike in 2022, in sharp contrast with the Fed. On the other hand, higher inflation forces its hand to taper asset purchases, a move that may be perceived as hawkish by financial markets.

    This is what makes this trading week the most important in December. After Friday, volatility will decline as investors prepare for the end of the year festivities and holidays.

    FXOpen Blog

  10. #290
    Junior Member FXOpen Trader's Avatar
    Join Date
    Dec 2020
    Location
    Asia
    Posts
    1,751
    BTCUSD and XRPUSD Technical Analysis – 14th DEC, 2021


    BTCUSD: Head and Shoulders Pattern Below $50,000

    Bitcoin was unable to sustain its bullish momentum on 12th Dec and declined after having touched a high of $50,701. We can observe a continuous fall since it touched its all-time high of $59,119 on 30th Nov.

    This fall in BTCUSD can also be attributed to the broad-based December selling in crypto markets; this is a time when global investors seem to withdraw their profits and investments due to the upcoming Christmas and New Year holiday season.

    In today’s European trading session, bitcoin is again back in the bearish channel, trading below the $50,000 handle.

    We can clearly see a head-and-shoulders pattern below the $50,000 handle which signifies a fall in the price of Bitcoin and a continuation of the bearish downtrend.

    At present, the price of bitcoin has entered a consolidation phase below the $48,000, and this is expected to continue in the US trading session.

    Both the Stoch and StochRSI are indicating an OVERBOUGHT level, which means that in the immediate short-term, a decline in the price is expected.

    Bitcoin is moving below its both 100 hourly simple and exponential moving averages.

    The average true range is indicating a lesser market volatility, which means that markets will be entering a consolidation phase soon.

    • Bitcoin trend reversal is seen below $50,000
    • Stoch is indicating an OVERBOUGHT level
    • The price is now trading just above its pivot level of $46,895
    • All the moving averages are giving a SELL signal at current market level of $47,146


    Bitcoin: Bearish Momentum Below $50,000 Confirmed


    BTCUSD is struggling to keep itself above the $50,000 mark, and we can see a mild bullish channel which suggests that a further decline can be expected.

    Some of the major technical indicators are giving a SELL signal, which means that the price will fall below $45,000 soon.

    In the European trading session, the price of BTCUSD is trading above its classic support level of $46,708 and Fibonacci support level of $46,594.

    In the last 24hrs, BTCUSD has gone DOWN by 3.74% with a price change of $1,830, and has a 24hr trading volume of USD 33.547 billion. Compared to yesterday, there was a 41.25% increase in the trading volume. This increase happened thanks to the increased selling pressure, as well as liquidation of bitcoin holdings by investors.

    The Week Ahead

    Bitcoin continues tumbling down from its Nov 30th all-time high of $59,119. A further decline will push it below the $45,000 handle.

    The medium to long-term outlook remains BULLISH for bitcoin, with a target of $55,000. At present, the markets are giving a SELL signal, so it would be best to enter into short positions.

    The relative strength index of 42 is indicating a bearish channel, and fresh selling is expected in the markets at any time. This is also due to the renewed fears related to the Omicron coronavirus variant, and many countries shutting down their international borders.

    Technical Indicators:

    Stoch (9,6): at 98.95 indicating an OVERBOUGHT level

    Average directional change (14-day): at 42.60 indicating a SELL

    Rate of price change: at -0.837 indicating a SELL

    Moving averages convergence divergence (12,26): at -447.70 indicating a SELL

    Read Full on FXOpen Company Blog...

Page 29 of 145 FirstFirst ... 19 27 28 29 30 31 39 79 129 ... LastLast

Bookmarks

Posting Permissions

  • You may not post new threads
  • You may not post replies
  • You may not post attachments
  • You may not edit your posts
  •